Team:TecCEM/Engineering

Home

Team

Project

Awards

Human Practices

Parts

Judging form
Engineering success
Quartz crystal evolution
Quartz crystal microbalance (QCM) sensors are frequently used as micro-weighing devices, thanks to their high sensitivity. This sensitivity is due to the frequency shifts due to mass increments that remain stuck on the sensing film surface of the sensor.
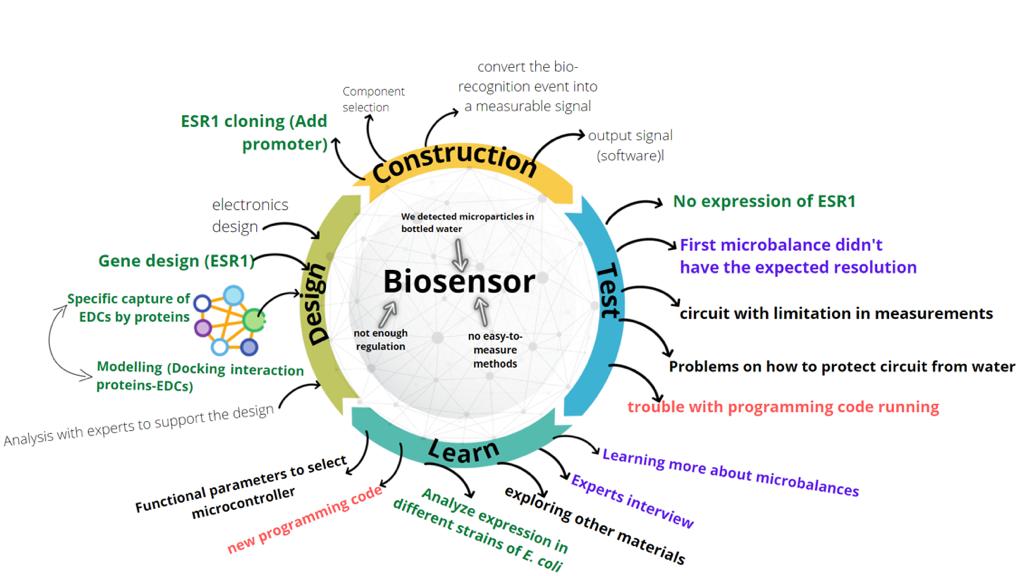

Figure 1. EWN 4Hz quartz crystal

Figure 2. Inital electrical circuit photo
The sensitivity of the quartz crystal (QC) is directly proportional to the resonance frequency. As this QC didn't count with the expected resolution while doing our tests, we decided and learnt that it was necessary to look for another QC.
This QC did not work on our test because, the 2 electrodes needed to be connected at the edges of the crystal and the electrode pattern is a full pad, both sides type. So, it was not possible to functionalize it.
We learnt that the QC is for processes with high heat loads and for optical coatings with dielectric materials and semiconductor processes.
Once again with this outcomes, we looked for a different QC.
Finally, with all the testing previously done, we found the OpenQCM quartz crystal, that counted with a resonance of 10MHZ making it perfect for our project.


Figures 3 and 4. First quartz 5Hz crystal used and final 10Hz crystal used for our design
Electric circuit
For our first prototipe we built a circuit, where we could manipulate the type of signal we wanted to analyze and change the frequency that we will be using.
This very first prtototipe was used to incorporate the push buttons, and the Liquid Crystal Display to our Software.
With this prototipe we learnt that, the Arduino can only measure up to 5MHz of frequency, meaning that we had to redesign our circuit by changing our microcontroller from an Arduino to a Teensy 4.1.

Figure 5. Final circuit schematic.
3D Printing
We use Z -ABS filament because we learnt that it is perfect for parts requiring testing, functional prototypes and concept models.
To make some parts of the casing, such as the walls, a type of snap-fits was used as the first model, as the ones shown in the image on the right.
However, when assembled and disassembled on different occasions, they did not hold and broke. This forced us to make changes in the design. We came up with a new idea: to use neodymium magnets of 8 mm diameter x 2 mm thickness.

Figure 6. "Snap-fit" parts sample.

Figure 7. Magnet based design.
The new designs had the corresponding spaces to accommodate the magnets in different areas. A 5% tolerance was used, so the diameter of the gaps was 8.4 mm and a height of 2.1 mm.
This seemed to work, but when printed, the magnets were forced in, so post-processing was necessary, which slowed down the working time.
So it was redesigned, with new tolerances of 7.5%, excellent results were obtained. It was learned that depending on the region, the 3D printer could have more or less accuracy, which can affect the assembly
A limitation to our parts
The problem:
For Parts BBa_K3809010 and BBa_K3809011 we didn't add a promoter, so the part couldn't be expressed.

Results
We managed to express the protein with the construct we built. It can be seen in the image at the right how the band after the 48 h growth. We can clearly see a band correspoding to the molecular weight of the protein.

Figure 8. Digestion of fragments from BBa_K081005, BBa_K3809010 and BBa_K3809011 to build BBa_K3809012 and BBa_K3809013.
How did we solve it?
We had to find a solution to this, so we used part BBa_K081005 which has a strong constitutive promoter and an RBS and assembled it with the parts with the missing promoter. This led to the creation of parts BBa_K3809012 and BBa_K3809013.

Figure 9. Digestion of fragments from BBa_K081005, BBa_K3809010 and BBa_K3809011 to build BBa_K3809012 and BBa_K3809013.
Figure 10. Protein development
-
Index