PCDA Synthesis and Polymerisation
Our detection method is based on the 10,12-Pentacosadiynoic acid (PCDA) polymer vesicles which can change colour when subjected to various kinds of stress, such as chemical, mechanical, heat and radiation.
The first step was to synthesise PCDA polymers from crystalline PCDA monomers. In their polymer form, PCDAs adopt vesicle formations in a water solution. This solution can then be stored at 4 degrees Celsius for extended periods of time.
We tested the PCDA solution for reactivity to heat and UV-radiation. The results of this test are shwon in Figure 1. For heat, a few mL of the solution was poured into a glass test tube and subjected to a burner flame. After a few seconds, the solution turned to a bright orange, indicating a structural change. When it comes to UV-radiation, the colour change is a lot more subtle. By leaving it overnight with UV-radiation, the colour changed to a deep purple. This is probably due to the UV lamps' supplied energy being relatively low, especially compared to the burner's energy flux into the solution.
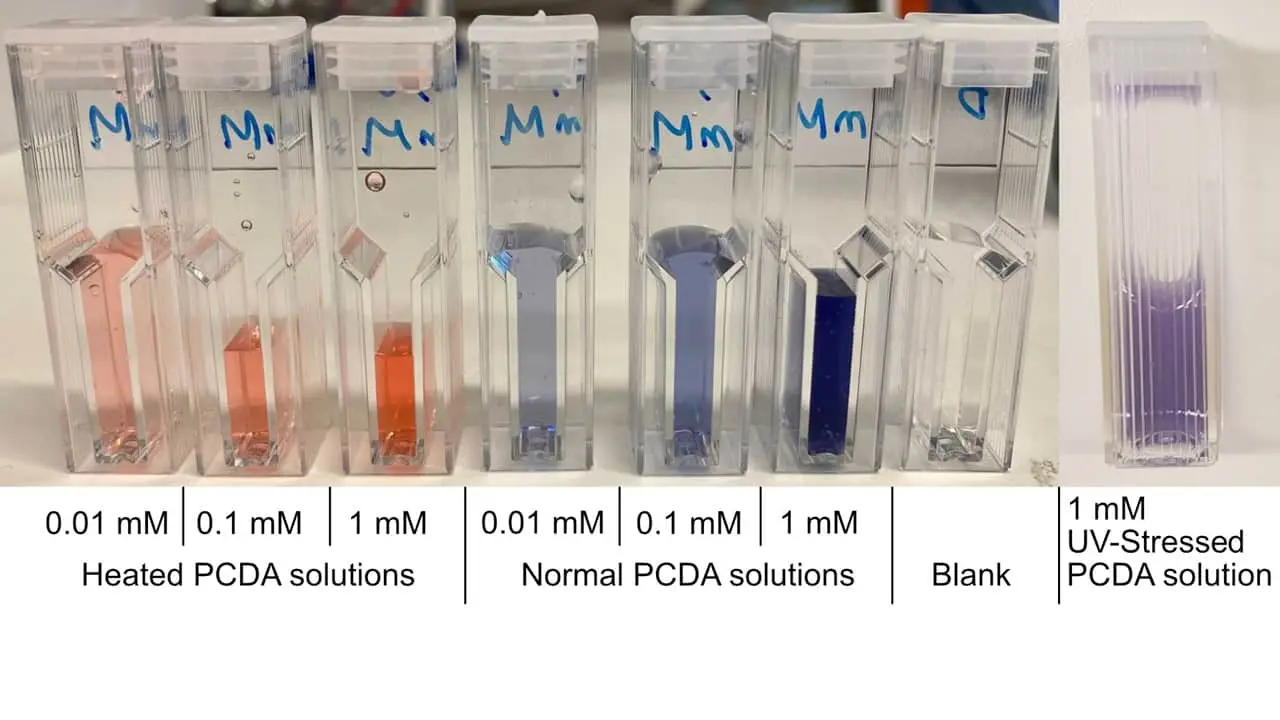
Figure 1: PCDA solutions subjected to different stress conditions (heat, UV radiation, normal), and subsequently diluted for spectrophotometric measurements.
Spectrophotometric measurements of the colour change were performed with the solutions from Figure 1, and the results are shown in Figure 2. The absorbance maxima changes from around 640 nm to around 500 nm. Both peaks visible on the spectrum are shifted to lower wavelengths when the PCDA solution is heated.

Figure 2: Absorbance spectrums, shown with different coloured curves of A: Blue PCDA at 1 mM (Black), 0.1 mM (Red) and 0.01 mm (Blue); B: Red PCDA at 1 mM (Blue), 0.01 mM (Purple), 0.01 mM (Red) and 0.001 mM (Black).
PCDA - Protein A Aptamer Conjugation
The next step was to conjugate our PCDA with the aptamer and then test it using protein A. After incubation of the protein A with the PCDA-aptamer conjugate we did not detect any colour change so we needed to test if the protein A aptamer is actually binding protein A. We investigated the protein A aptamer binding affinity with three different experiments: first, using protein A-coated beads, then with chromatography, and finally by performing a binding assay.
Protein A coated beads
Early on, after noticing that the protein A aptamer might not bind to its target, we used protein A coated beads for testing the binding qualitatively. After following the protocol provided with the beads, we ran the fraction from elution in an agarose gel, which is shown in Figure 3. After elution, the one sample of the fraction was desalted, in order to have a less harsh environment for the aptamers. However, as can be seen on the gel, the wells appear empty, which means that the aptamers most likely did not bind to protein A. It is nonetheless possible for the binding to be too weak, resulting in very little aptamers being eluted and thus not showing up on the gel.

Figure 3: Protein A products were run in 2% agarose gel shared with samples from a PCR troubleshooting. Wells 1-5 have PCR products with different annealing temperatures. Wells 6 and 7 show the product after elution of beads, before and after desalting.
Chromatography using a protein A coated column
Since the test using the magnetic beads could have a too low concentration in the elution for it to be detectable on a gel, we set up a chromatography experiment with a protein using the HiTrap Mabselect SuRe protein A affinity column. The resulting chromatogram is shown in Figure 4. Fractions from the sample application run-through and from the elution were analysed using an agarose gel, which is also shown in Figure 4. The wells containing the sample application run-through had a lot of contents, while the fractions from the elution were empty. This again shows that the protein A aptamer was not binding to protein A.

Figure 4: Chromatography results performed using the protein A affinity column. Top part shows the chromatogram, where the y-axis displays UV-absorbance and conductivity and the x-axis displays volume in mL. Lower part shows chromatography fractions, run in 2% agarose gel in TBE electrophoresis. Lanes 1-4 are from fractions during sample application and lanes 15-24 indicates fractions from elution.
Binding assay using a fluorescent protein A aptamer
The previous results suggest that our protein A aptamer is not binding protein A as expected. In order to finally figure out the aptamer affinity issues we designed the following experiment using protein A aptamer labelled with the fluorophore fluorescein (5' 6-FAM aptamer).
We incubated 100pmol, 200pmol and 300pmol of fluorescent aptamer in triplicates in a 96-well plate coated with protein A for 45 minutes. Then, washed the wells with PBS to remove unbound aptamer molecules and measured the fluorescence intensity in a plate reader.
To infer the pmol of aptamer that had successfully bound to protein A, we created the following standard curve using known pmol quantities of 5' 6-FAM aptamer.

Figure 5: 5' 6-FAM aptamer standard curve showing the relationship between RFUs (Relative fluorescence units) and aptamer amount (pmol). A linear regression model was used to determine the line, regression equation and R^2 coefficient.
Using the regression equation, we inferred the pmol of aptamer that bound to the protein A.
The total percentage of bound aptamer was then calculated for each sample by dividing the pmol of aptamer bound by total pmol aptamer incubated.
Table 1. Amount of aptamer bound (pmol) and percentage of bound aptamer determined by the binding affinity assay.
| Amount [pmol] | RFU | Inferred amount bound aptamer [pmol] | Percentage bound aptamer |
|---|---|---|---|
| 100 | 62 | 0.527 | 0.527 |
| 62 | 0.527 | 0.527 | |
| 51 | 0.434 | 0.434 | |
| 200 | 92 | 0.782 | 0.391 |
| 171 | 1.45 | 0.727 | |
| 93 | 0.791 | 0.395 | |
| 300 | 137 | 1.16 | 0.388 |
| 114 | 0.969 | 0.323 | |
| 63 | 0.536 | 0.179 |
Based on these results, we concluded that the protein A aptamer we chose for our proof of concept does not have sufficient binding affinity to its target.
This conclusion is also supported by protein A - aptamer docking model, where no evidence of obvious strong interactions was found.
SELEX
Another crucial part of our project was to create the two aptamers, one for lipoteichoic acid and one for C. acnes, using SELEX. We faced a lot of problems during this process. The main obstacle was the optimization of the PCR. From wrong concentrations of PCR reagents to contaminations and wrong primers we spent a lot of time troubleshooting in order to make the PCR work since it is the most important part of the SELEX process. One example is shown in Figure 6, which displays an agarose gel with PCR troubleshooting products, where two different polymerases, temperatures and primer concentrations were tried. Everything is written in detail on the Engineering page and in our troubleshooting guide found on the Contributions page.

Figure 6: Troubleshooting of the contaminated PCR products in a 2% agarose gel. Two different polymerases: Takara Titanium Taq DNA Polymerase (lanes 1,2,5,7,8,11) and DreamTaq DNA Polymerase (lanes 3,4,6,9,10,12), two different primer concentrations: 0.5 mM (lane 1,3,7,9) and 1mM (lanes 2,4,8,10); and two annealing temperatures: 55°C (lanes 1-6) and 60°C (lanes 7-12) were tested. Additionally, a non template control (NTC) for each polymerase and annealing temperature was run.
After all the hard work over the summer, we were delighted to get positive SELEX results during our last few days in the lab. We performed a first successful library amplification and determined the right amount of PCR amplification cycles needed for the second amplification based on Figure 7. Then the remainder of both libraries was amplified with 45 cycles of PCR in total, since the pre-amplification accounted for 15 cycles and the optimal number of cycles after pre-amplification was chosen to be 30.

Figure 7: 2% agarose gel showing library amplification PCR products, with pre-amplified library (lane 1), LTA SELEX (lanes 2-7), cell SELEX (lane 8-13) and non template control, NTC (lane 15). Samples indicate increasing PCR amplification cycles for LTA and Cell SELEX, from left to right, respectively. Highlighted bands display selected conditions for library amplification.
The PCR products from the second amplification can be seen in Figure 8. Then, the PCR products were pooled for each SELEX type, after which the sense and antisense strands were separated. The sense strands were eluted and desalted, which yielded very little product as can be seen in Figure 9, and we are unsure whether it is the right product that was obtained.

Figure 8: 2% agarose gel of the amplification products for (A): LTA SELEX, and (B): Cell SELEX; after 45 cycles. For each gel, lanes 1-10 display separate PCR products. Lane 11 has non-amplified libraries as control.

Figure 9: 2% agarose gel of fractions from desalting after the elution of the sense DNA strands. Run-through of the sample in lane 1, sample from the eluted fraction in lane 2, and sample from the left-over volume, after elution in lane 3.
As SELEX is a repetitive process, we were able to prove that each part of our protocol works. Given more time, we would have worked towards achieving multiple successful rounds of SELEX.
BioBrick Engineering
We set out to create a fusion protein A labelled with the yellow chromoprotein amilGFP as a reporter. In order to do this, we selected pre-existing parts from the registry: the amilGFP BioBrick (BBa_K1073024), as well as staphylococcal protein A BioBrick (BBa_K103003).
Following our cloning strategy, as seen on our Experiments page, we first successfully linearised the plasmid containing the amilGFP BioBrick by digesting with the SpeI and PstI restriction enzymes.

Figure 10: Digested and undigested product in 1% agarose gel. Lane C shows the undigested plasmid. Two different bands can be observed, corresponding to two different conformations of the DNA plasmid: open coiled (OC) and Covalently Closed Circle (CCC). Lane D shows the digested plasmid product.
Once we confirmed the plasmid had been linearised, we isolated it by performing gel extraction.

Figure 11: 1% agarose gel with linearised amilGFP plasmid, before (A) and after (B) the gel extraction. (A) AmilGFP plasmid was digested with SpeI and PstI. (B) Using the UV table, the fragment of interest was isolated, leaving out the smear.
Then, we moved on to amplify the protein A BioBrick by PCR, using VF2 and VR standard primers. The PCR product had the expected size: ~ 500 bp.

Figure 12: PCR amplification products on a 2% agarose gel. Lanes 1 to 3 contain the same PCR product. Lane 4 is PCR negative control (non-template control).
After performing a PCR clean up, the amplified protein A BioBrick was digested using XbaI and PstI restriction enzymes. The expected fragments were:
- Protein A BioBrick -> ~ 235 bp.
- VF2 - XbaI -> 133 bp
- PstI - VR -> 154 bp
We could not use PCR clean up to get rid of the digestion leftovers, since it removes oligos up until 40 bp. Therefore, the protein A BioBrick (digestion product) was isolated by gel extraction.

Figure 13: 1% agarose gel with digested protein A BioBrick, before (A) and after (B) the gel extraction. (A) The electrophoresis was run until the protein A BioBrick (~235 bp) was separated from other digestion products (~150 bp). (B) Using the UV table, the fragment of interest was isolated successfully.
The next step was to ligate the protein A BioBrick and the vector containing amilGFP plasmid to create the fusion protein. Compatibility between XbaI - SpeI and PstI - PstI sticky ends allowed for directional cloning of the protein A BioBrick into the amilGFP plasmid. Ligation was performed by incubation of both parts with T4 ligase. The ligation product was then used to transform TOP10 E. coli competent cells.
Several yellow colonies, indicating amilGFP expression, were selected to set O/N cultures, from which glycerol stocks and minipreps were prepared. Sanger sequencing confirmed our plasmid had the desired sequence.

Figure 14: Yellow E. coli colonies due to amilGFP expression on LB-agar plate.
Ultimately, in order to create a functional fusion protein, we had to mutate two sequential stop codons at the end of the amilGFP coding sequence by using Quikchange site-directed mutagenesis. During the PCR step, TAA STOP codons were substituted by TCA Serine codons thanks to the primers, which had these modifications incorporated (Figure 15). Three different annealing temperatures were used in the PCR: 55 degrees Celsius, 58 degrees Celsius and 60 degrees Celsius.
Then, DpnI endonuclease digested the non-mutated parental DNA strands, and the final product was transformed into TOP10 E. coli competent cells.

Figure 15: Quikchange Forward and Reverse primers are complementary to the target sequence at the end of the amilGFP CDS (BBa_K1073024), but include the desired point mutations (mismatches) that were incorporated by PCR. Retrieved from SnapGene.
Plates transformed with products from 55 degrees Celsius and 58 degrees Celsius PCR annealing temperatures had colonies. Expression of functional amilGFP could be confirmed with the presence of bright yellow colonies in LB-agar plates and yellow cell pellets in liquid culture.
Finally, the sequence of the newly engineered amilGFP-proteinA BioBrick (BBa_K4071000) was verified by Sanger sequencing and the part was validated.

Figure 16: Vector map of pSB1C3 containing the final version of the amilGFP-protein A BioBrick (BBa_K4071000).