Model
Modelling was a critical part of our iGEM project. Our main goals were as follows:
- To understand and model the complex interactions in the skin microbiome that lead to dysbiosis
- To understand and model the structure, stability, and binding characteristics of an aptamer
We achieved our first goal by developing an agent-based model in MATLAB. While the second goal was realized by performing molecular dynamics simulations of an aptamer on GROMACS and AmberTools.
You can read or download our code for the MATLAB agent-based model on our GitHub, as a zip file, or directly as a MATLAB file.
MatLab agent based model of skin microbial interaction during dysbiosis
As part of the dry lab, we wanted a model that showed the interactions among different microbes living in normal skin, and to make a simple representation of dysbiosis.
During the summer we first spent time understanding and simplifying the complex skin microbial interactions by reading several research articles. Further, we used MATLAB to develop a model that plots the variation in skin microbial population distribution and respective metabolite concentration (1). We tried to model dysbiosis as being caused by deviations in crucial parameters such as microbial growth rates, death rates of metabolite production rates.
We made a 2D visualisation of dysbiosis using the agent-based model represented as a grid animation. The entire process of MATLAB modeling including the theory, methodology, and results has been explained below.
The microorganisms present on the skin can be divided into two categories, commensals and pathogens. Although there are several microorganisms living on our skin, in our model we only focused on three microbes: C. acnes, S. epidermidis and S. aureus.
C. acnes, a fundamental skin microbe, and S. epidermidis, also present in most parts of our skin, are considered commensal bacteria because they are harmless in healthy conditions. The second type is harmful and pathogenic microbes that colonize the skin and lead to infections and inflammation. S. aureus is one of the most predominant pathogenic bacteria in the skin. (2, 3)
In healthy skin microbiota, S. epidermidis and C. acnes interact with each other to protect against and prevent pathogens, as well as participate in skin equilibrium with the secretion of beneficial metabolites. Thus they keep each other's population in balance and prevent the growth of S. aureus. (3)
The various interactions can be summarised as follows
- C. acnes inhibits proliferation of S. epidermidis through hydrolyzing sebum triglycerides and release of propionic acid
- C. acnes releases coproporhyrin III promoting S. aureus biofilm
- S. epidermidis inhibits proliferation of C. acnes through succinic acid (2)
- S. epidermidis can inhibit S. aureus biofilm formation with production of the serine protease glutamyl endopeptidase (Esp). Moreover, when Esp-expressing S. epidermidis induces keratinocytes to produce antimicrobial peptides via immune cell signalling, S. aureus is effectively killed. (4)
An imbalance in skin microbiota distribution, also known as dysbiosis, leads to several skin problems. Sudden over-colonization of the pilosebaceous unit in the skin by C. acne can cause a loss of diversification, loss of metabolic balance, potentially causing acne. Research has also shown that a loss of microbial diversity and loss of balance between C. acnes phylotypes may lead to dysbiosis (3).
The interaction among the skin microbiome on either balanced skin or skin with dysbiosis have been depicted using a simple MATLAB Model.
Assumptions of the Model
The crucial assumptions made in the MATLAB model are as follows:
The skin is modelled through an agent based model consisting of a two-dimensional grid on MATLAB, representing a part of the skin which is known as the face & scalp sebaceous unit.
In balanced skin conditions the distribution of skin microbiota is assumed to be 70% C. acnes, 20% S. epidermidis, 1% S.aureus and 9% of other bacteria. (4)
The number of square units in the grid signifies the population density of the different bacteria where each colour is associated with one bacteria. The population density depends on the growth and death rate of each type of bacteria.
The growth and death rates are assumed to be proportional to the concentration of a certain corresponding metabolites secreted in the skin. The constants of proportionality have been assumed arbitrarily to fit the model and do not represent actual values.
The proportionality relationships that we assumed in the model are as follows:
Growth rate of C.acnes and S.epidermidis is constant
Death rate of C.acnes is proportional to the concentration of Succinic acid
Death rate of S.epidermidis is proportional to the concentration of Propionic acid
Growth rate of S.aureus is proportional to the concentration of coproporhyrin III
Death rate of S.aureus is proportional to the concentration of glutamyl endopeptidase (Esp)
During dysbiosis there is a change in the values of proportionality constants for the growth and death rates leading to imbalance in bacterial population density.
Models
Figure 1 shows the percentage bacterial distribution and level of metabolite concentration in the normal skin microbiome. We considered 1 to represent the reference value of metabolite concentration in the y-axis indicating a normal level. Values lower than 1 represents a decrease in concentration relative to the normal level. While values higher than 1 indicate a rise in concentration relative to the normal level. An agent based model of microbial distribution is modeled on MATLAB as shown in Figure 1b. The 'cycles' in the x-axis is the number of iterations in the MATLAB model. It is a representation of the time period and could stand for anything such as hours or days, it is only a reference and not the actual time scale.

Figure 1: Percentage of bacterial distribution and metabolite concentration in normal skin

Similarly, for the case of dysbiosis, Figure 2 and Figure 2b depicts the bacterial percentage distribution, variation in the levels of various metabolites, and microbial distribution the resolution imbalance in microbial distribution as seen in the animation.

Figure 2: Percentage of bacterial distribution and metabolite concentration in dysbiosis

AmberTools
Although DNA aptamers offer better stability over RNA aptamers in their laboratory use, there are no simulation tools aimed at DNA aptamer conformational and binding properties. As part of our project, the aims were to generate a computational structure of an aptamer with the sequence:
5' ATACCAGCTTATTCAATTAGCAACATGAGGGGGATAGAGGGGGTGGGTTCTCTCGGCT 3' (6)
Firstly, the structure was generated in Avogadro as a .pdb file, (assumed to be a right handed B DNA model by Arnott et al.(8)) where a manually guided energy minimisation was performed based on previous work by Stoltenburg et al (17). This minimised structure showed binding similar to an expected secondary shape, however the universal force field (UFF) used in Avogadro is not ideal for DNA/RNA or single strand DNA energy minimisations.
A second version of the sequence was generated in AmberTools21 (8). A tool called VMD was used to generate a double stranded version of the aptamer and the complementary strand was deleted in a tool called DSV. To avoid errors in xLeap with loading the PDB file, hydrogens on the terminal OH groups on both 5' and 3' ends were deleted as well. The single strand DNA structure was loaded to AmberTools and adapted for further processing in pdb4amber, which corrected the deleted terminal H atoms.
Preparation for molecular dynamics was done by adding solvent, ions and force field (8) and running energy minimisation, heating and production (10).
The force field and solvent types used were: implicit solvent model IGB1 and force field ff99; and explicit solvent TIP3P and force field bsc1. The benefits of implicit solvent is that they reduce the computational resources necessary to perform a simulation, however they lack solvent viscosity for realistic simulation of electric potential. (9)
The simulation was run in vacuo to establish initial values and fast simulation times, and was aimed to be repeated with both implicit and explicit solvent models as well as including and excluding counter ions.
The energies were extracted from the simulation to show the progress of the energy minimisation and showed local potential energy minima.

Figure 3: Energy progress simulation
Improving the protein-binding site
During the summer, our main activities were installing virtual linux in order to run both GROMACS (11, 12) and AmberTools. This was a big challenge because of our limited experience of computer science and command-based software.
At first, the aptamer was built in Avogadro (13, 14) but when we attempted adapting it to a charmm force field using charmm-gui (15, 16), we discovered that some residues were labeled as UNL, preventing charmm-gui from interpreting them. Therefore we decided to generate the unfolded single stranded DNA (Figure 4) in AmberTools and use Avogadro to modify the secondary structure (5, 17) with interactive tools and the tertiary structure with General AMBER Force Field (GAFF).

Figure 4: The unfolded apatamer

Figure 5: The original aptamer
Starting the GROMACS simulation, the pdb-file required to be translated into the CHARMM force field's writing system which was achieved using the PDB reader provided by charmm-gui.org. Thereafter, the charmm force field CHARMM27 all-atom force field was used to provide files for GROMACS simulations.
The simulation itself utilized a TIP 3-point water model in a 3 nm box with dynamic borders and the solvation was neutralized with sodium ions. It consisted of four phases: an energy minimization phase, two equilibrium phases with regards to pressure and volume, and a molecular dynamics phase. The energy phase was set to run 50 000 steps but was interrupted at approximately 5 000 steps upon reaching the minimum energy requirement: 1000.0 kJ mol-1 nm-1. The equilibration phases ran for 50 000 steps each while the molecular dynamics phase ran for 250 000 steps translating into 0.1 ns and 0.5 ns in simulated real time, correspondingly.

Figure 6: The protein A model
Before the first simulation, the software Hex was used to dock the aptamer to the target protein A (18, 19)(Figure 6), creating OrigD1. The docking was based on shape and electrostatics. After the MD-simulation, the solvation and the protein was removed and another docking was performed (OrigD2), decreasing the total energy of the system from -405 kJ mol-1 (Figure 7a) to -442 kJ mol-1 (Figure 6c). The original aptamer was then mutated based on the second docking results where G29 and G30 were substituted into thymine groups using PyMOL (20). The docking and simulation procedures were then repeated, first yielding -402 kJ mol-1 (MutD1, Figure 7b) and then -486 kJ mol-1 (MutD2, Figure 7c).

Figure 7: The aptamer-protein-A-complexes docked before and after GROMACS simulations. a. The original pre-GROMACS complex (OrigD1). b. The mutated pre-GROMACS complex (MutD1). c. The original post-GROMACS complex (OrigD2). d. The mutated post-GROMACS complex (MutD2) (KiNG, version 2.24).
The original and mutated aptamers were also simulated in GROMACS without protein A in order to be docked afterwards. This resulted in total system energies of -529 kJ mol-1 (OrigD, Figure 8a) and -540 kJ mol-1 (MutD, Figure 8b), correspondingly. All of the aforementioned complexes will henceforth be referred to as their abbreviations.
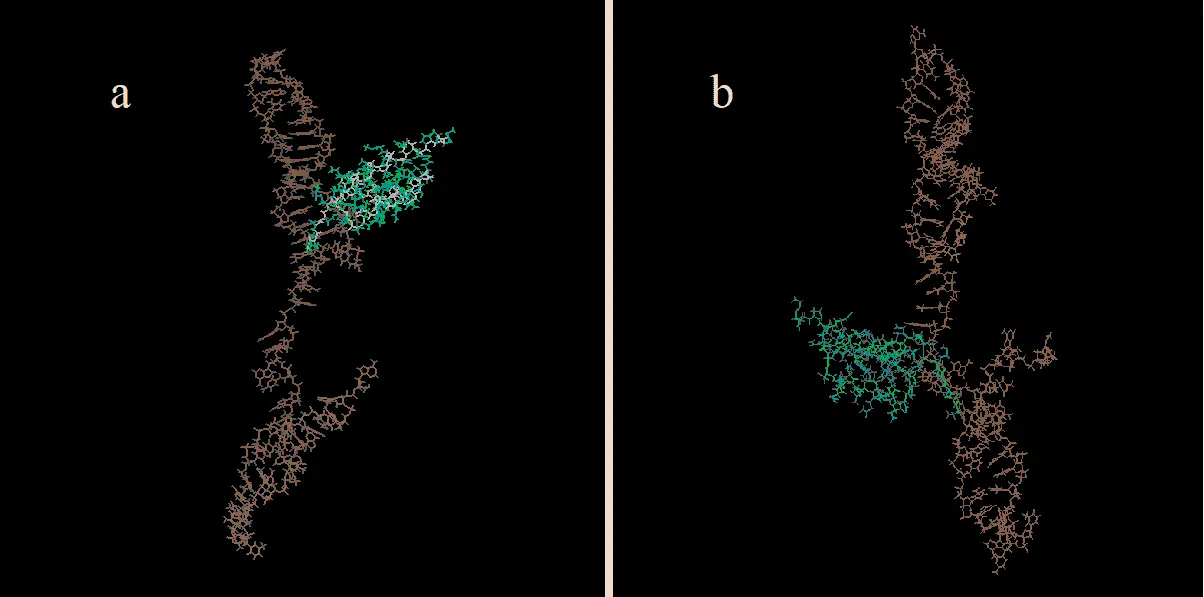
Figure 8: The aptamer-protein-A-complexes docked only after GROMACS simulations. a. The original complex (OrigD). b. The mutated complex (MutD) (20).
A common theme among all of the docking results was the protein's inclination of binding the N-terminal strand rather than its helices to the aptamer. The binding sites themselves tended to be located in the bottom end of a hairpin with the exception being the mutated complex received after a GROMACS simulation (Figure 7d). In docking alternatives not mentioned above as well as in MutD (Figure 8b), the N-terminal strand docked intermolecularly with the N-terminal close to one nucleotide strand and the helix-connected residue in conjunction with the opposing nucleotide strand.
When looking closer at the binding interactions, the lack thereof becomes apparent. The most probable candidates are the potential of the dipole-dipole interactions between lysine 5 and the ether oxygen of adenine 34 (OrigD2, Figure 9b), and the hydrogen bonding between glutamine 10 and the phosphodiester bond of adenine 28 (MutD, Figure 9a) and 34 (OrigD2, Figure 9b) with the donor-acceptor distance being: 2.355 A and 2.024 A, correspondingly.

Figure 9: The interactions between groups in the docked aptamer (blue) and the protein (red) a. A potential hydrogen bonding to the aptamer between amine group of glutamine 10 in OrigD2 and the phosphodiester oxygen as well as a polar interaction between lysine 5 amine group and the ether oxygen in the deoxyribose group, both on adenine 34. b. Potential hydrogen bonding between the amine group of glutamine 10 in MutD and the phosphodiester oxygen of adenine 28 (21).
From these results, it appears as if the tertiary conformation of the aptamer is the determining factor. As mentioned before, most complexes are formed at the end of the hairpin rather than the loop, a region where the nucleotides are bound looser, though more rigidly than the longer strand connecting the hairpins. Even during the exception of MutD2 (Figure 9), the protein is still adjusting to the tertiary structure caused by the strand's twist and one of the nucleotides, forming a seat-like structure.

Figure 10: Protein A bound to a nucleotide 'seat' (red) in MutD2 (20).
Tertiary structures promoting hydrogen bonds and dipole-dipole-interactions might be the ideal binding sites in the end, which begs the question how the tertiary structure can be faithfully predicted.
Regrettably, these results are not entirely reliable as the docking was not possible in a solvated state and the molecular dynamics simulation (i.e. phase 4 in the aforementioned methodology) was performed during a relatively short simulated timeframe, this because of a lack of computer power, time and personal expertise. These would surely affect the resulting structure of the aptamer and, in turn, the complex. Additional simulations could also have been run using other force fields as we were informed by Alexander Lyubartsev that aptamers are not stable when affected by a charmm force field.
References
MATLAB. version 9.10.0.1602886 (R2021a). Natick, Massachusetts: The MathWorks Inc.; 2021.
Claudel JP, Auffret N, Leccia MT, Poli F, Corvec S, Dreno B. Staphylococcus epidermidis: a potential new player in the physiopathology of acne?. Dermatology. 2019 ; 235 (4) : 287 - 94.
Fourniere M, Latire T, Souak D, Feuilloley MG, Bedoux G. Staphylococcus epidermidis and Cutibacterium acnes: two major sentinels of skin microbiota and the influence of cosmetics. Microorganisms. 2020 Nov ; 8 (11) : 1752.
Byrd Allyson L, Yasmine B, Segre Julia A. The human skin microbiome [J]. Nat Rev Microbiol. 2018 ; 16 : 143 - 55.
Jeddi I, Saiz L. Three-dimensional modeling of single stranded DNA hairpins for aptamer-based biosensors. Scientific reports. 2017 Apr 26 ; 7 (1) : 1 - 3.
Stoltenburg R, Krafcikova P, Viglasky V, Strehlitz B. G-quadruplex aptamer targeting Protein A and its capability to detect Staphylococcus aureus demonstrated by ELONA. Scientific reports. 2016 Sep 21 ; 6 (1) : 1 - 2.
Gupta G, Bansal M, Sasisekharan V. Conformational flexibility of DNA: polymorphism and handedness. Proceedings of the National Academy of Sciences. 1980 Nov 1 ; 77 (11) : 6486 - 90.
D.A. Case, H.M. Aktulga, K. Belfon, I.Y. Ben-Shalom, S.R. Brozell, D.S. Cerutti, T.E. Cheatham, III, G.A. Cisneros, V.W.D. Cruzeiro, T.A. Darden, R.E. Duke, G. Giambasu, M.K. Gilson, H. Gohlke, A.W. Goetz, R. Harris, S. Izadi, S.A. Izmailov, C. Jin, K. Kasavajhala, M.C. Kaymak, E. King, A. Kovalenko, T. Kurtzman, T.S. Lee, S. LeGrand, P. Li, C. Lin, J. Liu, T. Luchko, R. Luo, M. Machado, V. Man, M. Manathunga, K.M. Merz, Y. Miao, O. Mikhailovskii, G. Monard, H. Nguyen, K.A. O'Hearn, A. Onufriev, F. Pan, S. Pantano, R. Qi, A. Rahnamoun, D.R. Roe, A. Roitberg, C. Sagui, S. Schott-Verdugo, J. Shen, C.L. Simmerling, N.R. Skrynnikov, J. Smith, J. Swails, R.C. Walker, J. Wang, H. Wei, R.M. Wolf, X. Wu, Y. Xue, D.M. York, S. Zhao, and P.A. Kollman (2021), Amber 2021, University of California, San Francisco.
Oweida TJ, Kim HS, Donald JM, Singh A, Yingling YG. Assessment of AMBER Force Fields for Simulations of ssDNA. Journal of Chemical Theory and Computation. 2021 Jan 12 ; 17 (2) : 1208 - 17.
Buglak AA, Samokhvalov AV, Zherdev AV, Dzantiev BB. Methods and applications of in silico aptamer design and modeling. International Journal of Molecular Sciences. 2020 Jan ; 21 (22) : 8420.
Abraham MJ, van der Spoel D, Lindahl E, Hess B, and the GROMACS development team. GROMACS User Manual version 2018. 2018. www.gromacs.org
Bekker H, Berendsen HJC, Dijkstra EJ, Achterop S, van Drunen R, van der Spoel D, Sijbers A, Keegstra H, Reitsma B, Renardus MKR. Gromacs: A parallel computer for molecular dynamics simulations. In Physics Computing 92 (Singapore, 1993). de Groot, R. A., Nadrchal, J., eds. . World Scientific.
Avogadro: an open-source molecular builder and visualization tool. Version 1.2.0. Available from: http://avogadro.cc/
Hanwell MD, Curtis DE, Lonie DC, Vandermeersch T, Zurek E, Hutchison GR. Avogadro: An advanced semantic chemical editor, visualization, and analysis platform. J. Cheminformatics 2012 ; 4 (17). doi: https://doi.org/10.1186/1758-2946-4-17.
Jo S, Kim T, Iyer VG, Im W. CHARMM-GUI: A Web-based Graphical User Interface for CHARMM. J. Comput. Chem. 2008 ; 29 : 1859 - 65
Jo S, Cheng X, Islam SM, Huang L, Rui H, Zhu A, Lee HS, Qi Y, Han W, Vanommeslaeghe K, MacKerell AD Jr., Roux B, Im W. CHARMM-GUI PDB Manipulator for Advanced Modeling and Simulations of Proteins Containing Non-standard Residues. Adv. Protein Chem. Struct. Biol. 2014 ; 96 : 235 - 65
Stoltenburg R, Schubert T, Strehlitz B. In vitro selection and interaction studies of a DNA aptamer targeting protein A. PloS one 2015 ; 10 (7) : 0134403. doi : 10.1371/journal.pone.0134403.
PDB-ID: 1BDD
Gouda H, Torigoe H, Saito A, Sato M, Arata Y, Shimada I. Three-dimensional solution structure of the B domain of staphylococcal protein A: comparisons of the solution and crystal structures. Biochemistry 1992 ; 31 (40) : 9665 - 72. doi: https://doi.org/10.1021/bi00155a020.
The PyMOL Molecular Graphics System, Version 1.2r3pre, Schrodinger, LLC.
Chen, V., Davis, I., & Richardson, D. KING (Kinemage, Next Generation): A versatile interactive molecular and scientific visualization program. Protein Science 2009 ; 18 (11) : 2403 - 9. doi: https://doi.org/10.1002/pro.250.