Overview of Engineering
At the heart of an iGEM project is the use of engineering principles in synthetic biology to find a solution to a problem. Typically, this is performed by engineering a biological system, e.g., a bacterial organism. With MIKROSKIN we decided not to use a biological system but explore another area of synthetic biology. Still, our project is centered around the engineering cycle with all its steps (Figure 1).
The cornerstone of our project is the production of a semi-quantitative rapid test for the skin microbial community. For our test we focused on two parts. First, we targeted the dominant species of C. acnes and all gram-positive skin bacteria by using SELEX and aptamer technology. Secondly, we created a colorimetric detection method using PCDA polymer to observe
aptamer binding to the ligand.
Here we present the engineering hub and how we tailored the different steps of the engineering design cycle for the various experimental challenges in our project: MIKROSKIN.

Figure 1: The engineering cycle is composed of an initial research step and five recurring steps: Design, Build, Test, Learn, and Improve.
Aptamer Production
Research
The first step of the engineering cycle is intensive research. Every project idea needs to be backed up by previous research findings, which support the need, logic and feasibility of the project.
Our project idea focuses on the skin conditions acne vulgaris and dermatitis. Thus, the first step was to read upon both diseases. We scanned the literature on statistics around the diseases, their causes, diagnosis and treatment. While we started with two diseases, we soon expanded our research and included other diseases, their similarities and the way research on skin conditions is conducted. We concluded the first research phase with our project idea: developing a rapid test to detect skin diseases, by detecting imbalance in the skin microbiota.
Design
After establishing our project idea - the creation of a rapid test - the design phase was initiated with several brainstorming sessions. During the sessions, we decided upon the important characteristics of our test and tried to come up with a design that fits best. We wanted the test to be easily accessible and as cost-effective as possible. Additionally, we aimed for a test that can be conducted without special equipment like sequencing. We started looking into molecules that would recognise and bind to specific targets, which we could base our test on.
Aptamers are small, single-stranded oligonucleotides that can assemble to form complex structures. These folded three-dimensional structures form interactions with small molecule targets which can be detected (1), as shown in Figure 2. The aptamer libraries are obtained using the Systematic Evolution of Ligands by Exponential enrichment (SELEX) technology. SELEX is a basic technique for the selection of aptamers in vitro against various targets, ranging from small molecules like ATP to proteins to even whole cells. The interactions between the aptamer and its target involve different intermolecular interactions including van der Waals forces, electrostatic interactions between charged groups, and three-dimensional shaping by hydrogen bonds.
Due to the ability of aptamers to recognise and bind specifically to targets, they are often compared to antibodies. The former, however, can be crafted to bind to multiple different targets while antibodies, which can only bind to immunogenic toxic targets. Aptamers are much smaller than antibodies, so they are able to fit into clefts and gaps on the surface of much larger target molecules that antibodies sometimes cannot reach. They are also more resilient against heat and organic solvents. These properties provide a huge market for aptamers to be used in, e.g, the field of diagnostics for targeting biomarkers, such as cancer, and in the drug delivery process.
Thus, we decided to base our test on aptamers.

Figure 2: Schematic representation of aptamers mode of action.
Next, we had to decide which targets we wanted to choose. We went back to our literature search and expanded it. This time, our search was focused on finding molecular targets involved in skin diseases, which could be used for aptamer selection.
Furthermore, we wanted the test to be semi-quantitative. We came up with the following strategy to be able to compare the detected amount of a target bacteria to all the skin bacteria in the sample.
We were aiming for the development of two aptamers: one targeting lipoteichoic acid (i.e. LTA), which is present on the cell wall of all gram-positive bacteria. Since gram-positive Actinobacteria are dominant on the skin (Figure 3), teichoic acid can be used for the quantification of the total bacteria in the skin microbiota.
The second aptamer should target a strain of C. acnes, which is dominant in acne-prone skin (4).

Figure 3: Pie chart representing the diversity of bacteria in the skin microbiota. Modified from (3)
Aptamers are developed by the cyclic method of SELEX (Systematic Evolution of Ligands by Exponential enrichment). SELEX starts with the incubation of an aptamer library with random sequences with the targets, C. acnes or LTA.
As a result, some aptamers will bind to the targets while unbound sequences will be removed by washing. The bound sequences are eluted from their target by using heat and are then amplified by error-prone PCR. This mutagenic PCR includes some modifications in the pre-selected aptamer sequences, creating a library of variants that will be used in the next round. This concludes the first round of SELEX, but in order to obtain the desired aptamers with high binding affinity, multiple SELEX rounds are necessary. SELEX is therefore a process of directed and targeted in vitro evolution.
Building and Testing
The Build & Test step of our aptamer selection subproject started with the creation of our own cell SELEX protocol, for the production of the C. acnes aptamer, and in vitro SELEX protocol, for the production of the LTA aptamer. We have consulted with our advisor, Dimitri Van Simaeys, and referred to research papers to find the optimal protocols for aptamer selection.
In the following parts we will guide you through the different phases of the building and test steps of the engineering cycle. These phases are strongly connected to the learn and improve steps of the cycle, as each error identification required us to refine our ideas to move on with the project. Thus, each presented phase is a small engineering cycle in itself.
Phase I - Ordering Primers
The beginning of the building phase was cumbersome. Understanding all specifications for the library as well as ordering the primer from the company (Integrated DNA Technologies (IDT)) was a challenge in itself. At first, we ordered the wrong sequence for our reverse primer.
This error led to unsuccessful PCR amplification of the SELEX library. All PCR products were checked by performing electrophoresis in a 2% agarose gel using TBE buffer. In various troubleshooting attempts we stumbled upon different common errors, such as forgetting to pipette the sample into PCR tubes. No amplification was visible in the form of a band, only primer dimers were detected (Figure 4). Primer dimers are potential byproducts of a PCR. They result from primers that have complementary sequences, which stick together. These dimers can be amplified in the PCR reaction, leading to intense bands with short base pair length.

Figure 4: Primer dimer formation following PCR amplification. PCR products run in a 2% agarose gel. Lane 1 is Preamplified library, lane 2-7 PCR product with increasing cycle number from left to right, lane 8 non template control (NTC).
After a lot of troubleshooting, we started looking at our ordered material. Upon checking our primers for dimerisation potential, we recognised the major problem: We had ordered the complementary sequence to the 3' overhang in our library. However, instead of ordering 5'-3' we had ordered 3'-5', which made the primer useless.
This concluded a first engineering cycle. We designed our idea, built the PCR protocol and conducted it. We failed to achieve the expected results, but investigated why it failed and improved the protocol based on our reflections.
Phase II - Primer Dimers
After having successfully identified and solved one major problem, we soon faced another one. Even when using the right primers we still had no library PCR amplification, only primer dimers. With the help of our instructors and advisors we evaluated the problems and again did several troubleshooting PCR attempts. While examining our protocol step by step, we realised that the annealing temperature should be reconsidered. The PCR annealing temperature needs to be adjusted according to the melting temperature (Tm) of the used primers, as it should be 3 to 5 degrees Celsius lower than the lowest Tm of the primers. As our primers had an annealing temperature of 55 degrees Celsius, we realised that our PCRs were performed using an annealing temperature, approximately 10 degrees Celsius higher than it should be.
This considered the use of annealing temperatures ranging from 50 to 60 degrees Celsius was tested. However, still no success in library amplification was achieved, as no band except the primer band was visible (Figure 5).

Figure 5: 2% agarose showing the library amplification products after PCR using different annealing temperatures.
Phase III - Concentrations of the PCR Components
Next, we evaluated the concentrations of all used components of our PCR. We checked primer concentrations using the Nanodrop and determined that our diluted primer aliquotes did not have the desired concentration. Additionally, we checked our protocol and found out that we had used too high concentration of both primer and template in our PCR protocol. This can lead to decreased amplification due to spatial limitations.
All these troubleshooting steps finally resulted in a successful PCR amplification of our aptamer library. The bands in the agarose gel (Figure 6) correspond to the desired length of the initial library with about 80 nucleotides.

Figure 6: 2% agarose showing the library amplification products after PCR using different annealing temperatures.
Phase IV - PCR Contamination
Unfortunately, after our successful PCR we faced another common problem when doing PCR: contamination. We experienced recurrent aptamer contamination in our Non-template control sample, meaning that some of the PCR components were contaminated with the template.
We identified the contaminated component by setting different PCR reactions without a template where one component at a time was changed for a fresh aliquot. This way, we could infer the culpable component by observing in which sample the contamination band disappeared.

Figure 7: PCR contamination troubleshooting in a 2% agarose gel. New polymerase and polymerase buffer (lane 1), new dNTPs (lane 2), new Forward (lane 3) and Reverse primers (lane 4) aliquots were tested.
In the example shown in Figure 7, bands can be seen in lane 1, 3 and 4, although very faint in the latters. The band disappears when a fresh dNTP aliquot was used, therefore we concluded that it was the component contaminated with template.
Phase V - Elution
Proceeding with our SELEX protocol we faced other difficulties. Elution and desalting of the selected aptamers from the beads were the last steps of the protocol. Unfortunately, we were not able to detect DNA in the flow-through of our desalting column. At first, we thought the desalting was the striking point, however, after checking DNA concentration in our sample pre and post elution, as well as post desalting, we saw that no DNA was detectable already after elution. Thus, we concluded that the critical point was the elution of the aptamers from the beads.
To fix this problem we tested different elution strategies with different elution buffers and different degrees of heat. Still, the elution was unsuccessful. By discussing with instructors we realised that we were assuming the wrong DNA concentration in our samples. The expected DNA concentrations after PCR amplification were based on the Nanodrop measurement of the PCR products. However, due to primer and other components in the PCR product, the measurement is highly inaccurate.
A better approach to determine the DNA amount is by analysing a gel image using the ladder as reference for DNA amount. We concluded that we had too little DNA input to measure anything with the Nanodrop after elution and desalting. We solved this problem by increasing the PCR product used for elution.
Phase VI - Desalting
During the desalting step, a major issue was the elution volume. In our first attempts, the volume of the buffer used to elute the DNA from the NAP-5 column was too high, resulting in the dilution of our library. If the library is too diluted, few aptamer sequences will be incubated with the targets in the next SELEX rounds.
We are currently working on optimising this last step.
Learning and Improving
As mentioned before, learning and improvement are not only final steps at the end of a project. They continuously occur during the building and testing of the project. In our aptamer selection journey we have learned a lot about structured troubleshooting. We faced multiple problems in one step of our protocol, the PCR. It was of greatest importance to discuss with teammates, instructors, advisors and sometimes senior researchers to understand the continuous erroneous results. In the end, we succeeded with our PCR. However, we learned from our project that success in the learning and improvement step is only the beginning of another engineering cycle, and that many rounds will eventually lead to a finished project.
Although we did not have enough time to develop high-affinity aptamers, which was our desired end goal for this part of the project, we optimised our methodology. We gathered our gained knowledge during this journey in the SELEX troubleshooting guides (seen below), where detailed protocols, tips to keep in mind and tricks for accurate troubleshooting can be found. Future iGEM teams working with aptamers will greatly benefit from them!
Additionally to our gained knowledge in the design, build and testing phase of our project, we helped our entrepreneurial subteam to refine the design of our end product. From an at-home use rapid test for detecting acne and dermatitis, to a customisable high throughput test. Learning and improvement is not the last part of the cycle but is conducted after every small step!
PCDA-Based Detection Method
Research
When researching a suitable detection method for our biosensor, we focused on the desired features of our end product. We wanted the test to be easily performed and interpreted without the need for special equipment. Hence, we searched for colorimetric methods, which can be observed by the naked eye, but at the same time allow for quantification by measuring absorbance, which is necessary for an accurate laboratory characterisation.
During the research step, we came across 10,12-Pentacosadiynoic acid (PCDA) (Figure 9). PCDA has special spectrophotometric properties upon polymerisation. Sonication is used to assemble the PCDA monomers into vesicles. Vesicles turn from white to dark blue upon UV irradiation and then red if an external factor such as chemicals, heat or radiation stresses the vesicle surface (5). This colour change is visible with the nake eye and we took advantage of this property to develop the detection method for our biosensor.

Figure 8: Chemical structure and blue to red colour transition of polydiacetylene in polymerised vesicles.
Design
We aim to conjugate our aptamers with blue PCDA vesicles. The premise of this idea is that the aptamer undergoes conformational changes upon target binding; inducing stress to the PCDA vesicles surface, thus changing colour from blue to red.
The colour transition would happen regardless of the target being lipoteichoic acid or a C. acnes cell and would be proportional to the amount of target bound to the aptamers. Moreover, the colour change will not only be visible by the naked eye, but will also be quantifiable by absorbance measurement in a spectrophotometer. The ratio between C. acnes/LTA absorbance makes our biosensor a semi-quantitative test for dysbiosis detection.
In addition, this detection method could be used for high throughput screening tests, if we decide to scale up our prototype and increase the number of targets.
Building and Testing
As in the aptamer selection part of the project, the Build & Test steps of the engineering cycle are strongly linked to the learning and improvement steps of the cycle. Again we will guide you through different phases of the detection method building and testing process, which all led to learning and improvement. Hence, they all display little engineering cycles in themselves.
Phase I - PCDA Polymerisation and Vesicle Synthesis
We started the Build & Test phase with the synthesis of our PCDA vesicles, which are the base of every further step of the project.
The synthesis itself was challenging at first, as none of us had any experience with the procedures.
After following the protocol for the first time, we successfully produced a white substance with little blue and red sparks of PCDA vesicles. We were unsure about the concentration we produced, therefore, we re-calculated the amount of PCDA in our solution. Additionally, we realised that the nitrogen flow used to dry the chloroform when dissolving the PCDA needs to be very gentle to avoid spilling. Furthermore, we should only use a small amount of chloroform, as it easily dissolves.
We learned from these adjustments to improve the protocol. As a result, we were able to produce PCDA vesicles with the desired concentration and a pure-white colour.
Phase II - Inducing Colour Change
After successfully achieving both the PCDA vesicles polymerisation and the colour change from white to blue by sonication, we moved on to induce the blue to red transition.
First, we tried UV radiation as an external stressor, but O/N irradiation only induced a slight colour change. We still wondered if our vesicles were able to turn red, so we tried heat as a source of external stress by using a Bunsen burner for a few seconds. Heat prompted a fast colour change and the blue solution turned into a bright orange within seconds (Figure 9). Thus, we concluded that our PCDA vesicles are susceptible to change colour upon mechanical stress.
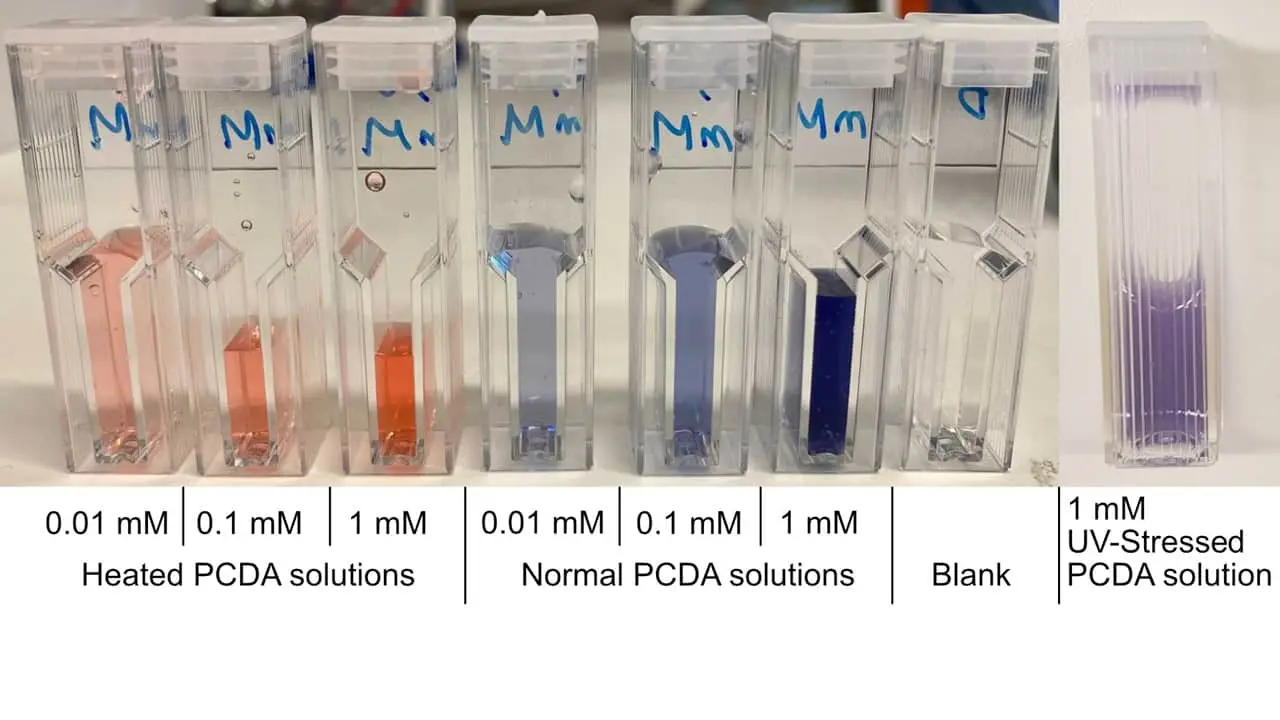
Figure 9: PCDA solutions subjected to different stress conditions (heat, UV radiation, normal), and subsequently diluted for spectrophotometric measurements
Phase III - Testing the detection method
Next, we proceeded to the aptamer-PCDA conjugation and test of the detection method.
Even though we ordered an already published aptamer against protein A, we were not able to see any colour change in the PCDA-aptamer conjugates upon incubation with the aptamer target in 24-well plates.
This was a major drawback in our project. We analysed the potential failures of our biosensor and came up with the following potential explanations for the lack of colour change:
- The PCDA and the aptamer do not conjugate effectively
- The bought protein A aptamer is not binding its target effectively
- Protein A was damaged due to incorrect storage conditions
The latter could be ruled out easily. Even though protein A was stored at room temperature instead of -20 degrees Celsius for several days, according to the advice of senior researchers of the department, protein A is very stable and should still be functional.
To evaluate if the conjugation of aptamer and PCDA vesicles was successful we needed access to advanced imaging methods that were not available for our iGEM team. This is why we reached out to MEPhI (Moscow Engineering Physics Institute) iGEM team. We started a collaboration and sent samples to the Russian team, who tried helping us out. Even though they were not able to condusct the planned tests before the wiki freeze, we were really happy to discuss those techniques and learned a lot about scientific collaborations.
Next, we discussed strategies for testing the affinity of the protein A aptamer with our advisors. We designed a series of experiments aiming to characterise the aptamer affinity.
Phase IV - Low-affinity aptamer
After successfully dissecting possible explanations for the unsuccessful biosensor function, we conducted several experiments to test our aptamer's affinity. Using chromatography, bead based assays and binding assays based on fluorescent detection, we concluded that our aptamer has low affinity for its target.
This taught us not only to think about experimental errors but also analyse published data in a critical way - already published data does not always work perfectly in your set-up.
Learning and Improving
Again, learning and improvement occurred during every phase of the development, building and testing of the PCDA-based detection method.
Learning was done by reaching out for help to people with more experience or access to special equipment needed for the experiment.
We also realised the weight of creativity for the experimental design and how important it is to break down big experiments into smaller ones in order to rule out the different hypotheses during troubleshooting.
References
- Keefe AD, Pai S, Ellington A. Aptamers as therapeutics. Nature reviews Drug discovery. 2010 Jul ; 9 (7) : 537 - 50.
- Sun H, Zhu X, Lu PY, Rosato RR, Tan W, Zu Y. Oligonucleotide aptamers: new tools for targeted cancer therapy. Molecular Therapy-Nucleic Acids. 2014 Jan 1 ; 3 : e182.
- Grice, E. A., & Segre, J. A. (2011). The skin microbiome. Nature reviews. Microbiology, 9 (4) , 244 – 253. https://doi.org/10.1038/nrmicro2537
- Dreno B, Dagnelie MA, Khammari A, Corvec S. The skin microbiome: a new actor in inflammatory acne. American Journal of Clinical Dermatology. 2020 Sep 10 : 1 - 7 .
- Scoville SP, Shirley WM. Investigations of chromatic transformations of polydiacetylene with aromatic compounds. Journal of applied polymer science. 2011 Jun 5 ; 120 (5) : 2809 - 20.
- Kim, Young-Rok & Jung, Sungho & Ryu, Hyunil & Yoo, Yeong-Eun & Kim, Sun Min & Jeon, Tae-Joon. (2012). Synthetic Biomimetic Membranes and Their Sensor Applications. Sensors (Basel, Switzerland). 12. 9530 - 50. 10.3390 / s120709530.
- De Grazia A, Mikhael M, Stojanovska N, Reedy B, Shimmon R, Tahtouh M. Diacetylene copolymers for fingermark development. Forensic science international. 2012 Mar 10 ; 216 ( 1 - 3 ) : 189 - 97.