Team:SMS Shenzhen/Model3


In this model, our team wants to quantify the Lcp and Laccase CotA protein production in the system by constructing a mathematical model. The result of our model aims to show a relationship between time and the amount of protein expression employing a graph to find an appropriate time for protein extraction. Since the cellular environment is too complex, in order to simplify the system, we choose to model within cell-free environment, and finally apply the model to the cell environment.
Design
Gene expression, which is the basis of protein production, can be divided into two steps: transcription and translation. The products of transcription and translation are mRNA and protein. After a specific time, those products will degrade by particular enzymes. The approximate mechanism is shown in figure 1 below.
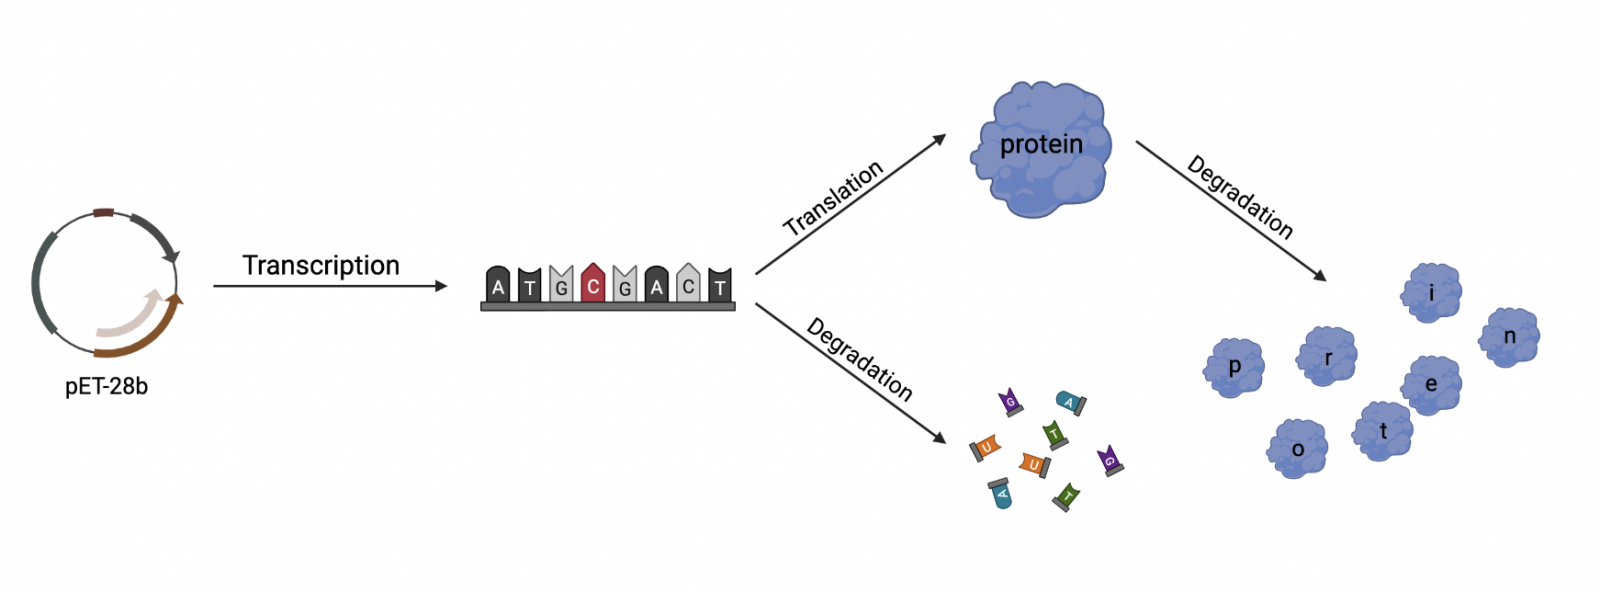
Figure 1 | Expression Model: Gene Expression in E. coli (created in BioRender)
Therefore, we establish several equations relating to reaction rates to describe the process above. This works on the assumption that the reaction rate is proportional to the concentration of the reactants and products. The equations are shown in table 1, and the variables are explained in table 2 below.
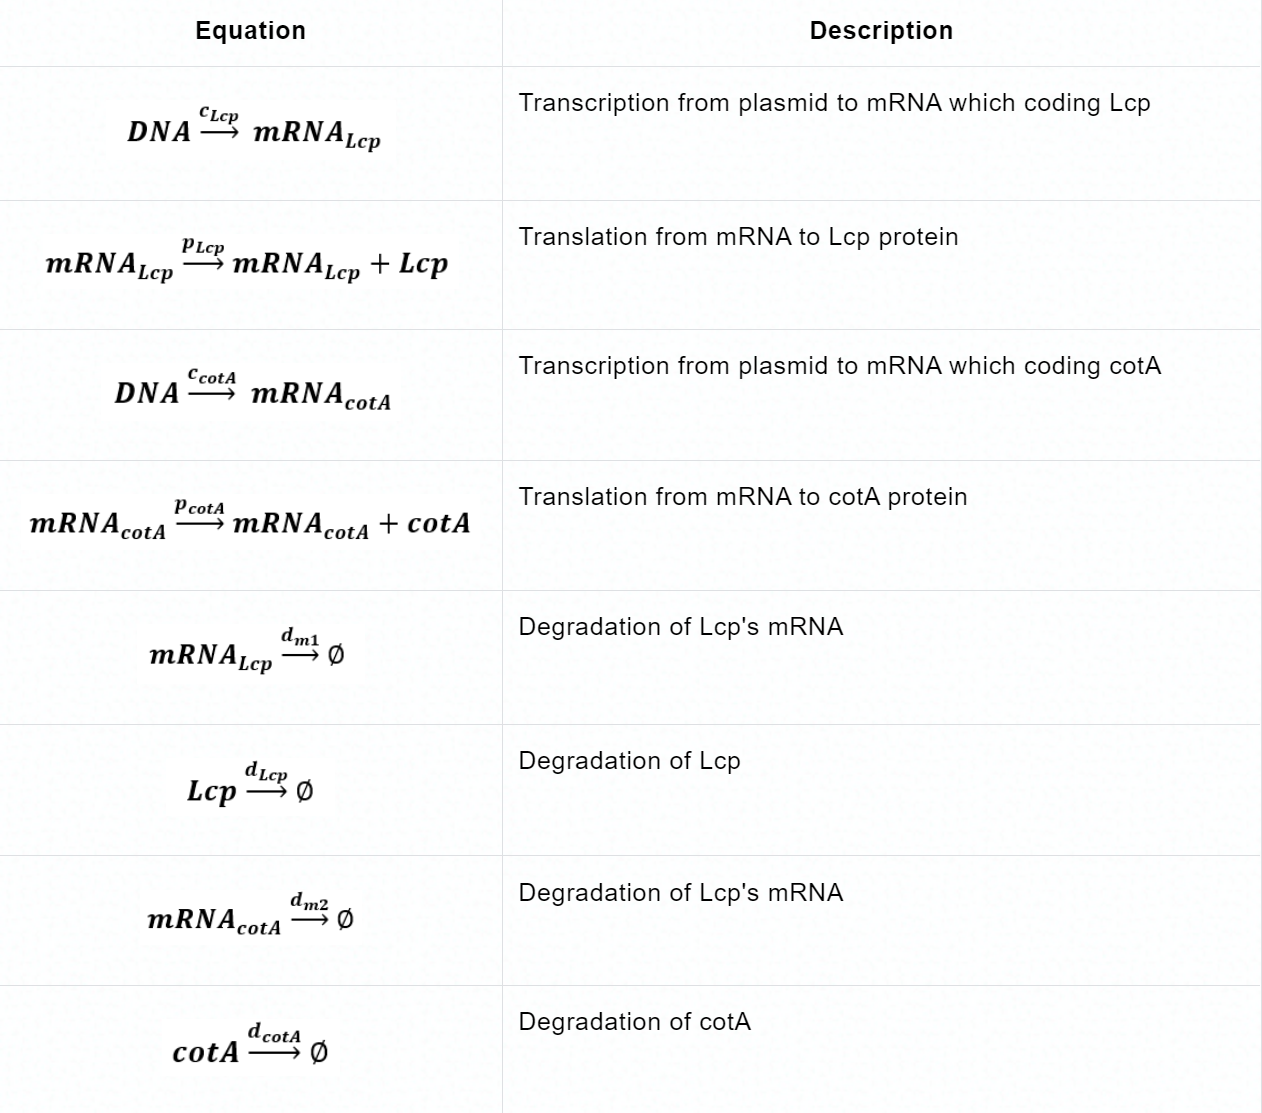
Table 1 | Biochemical reaction with reaction rate in the Expression model.
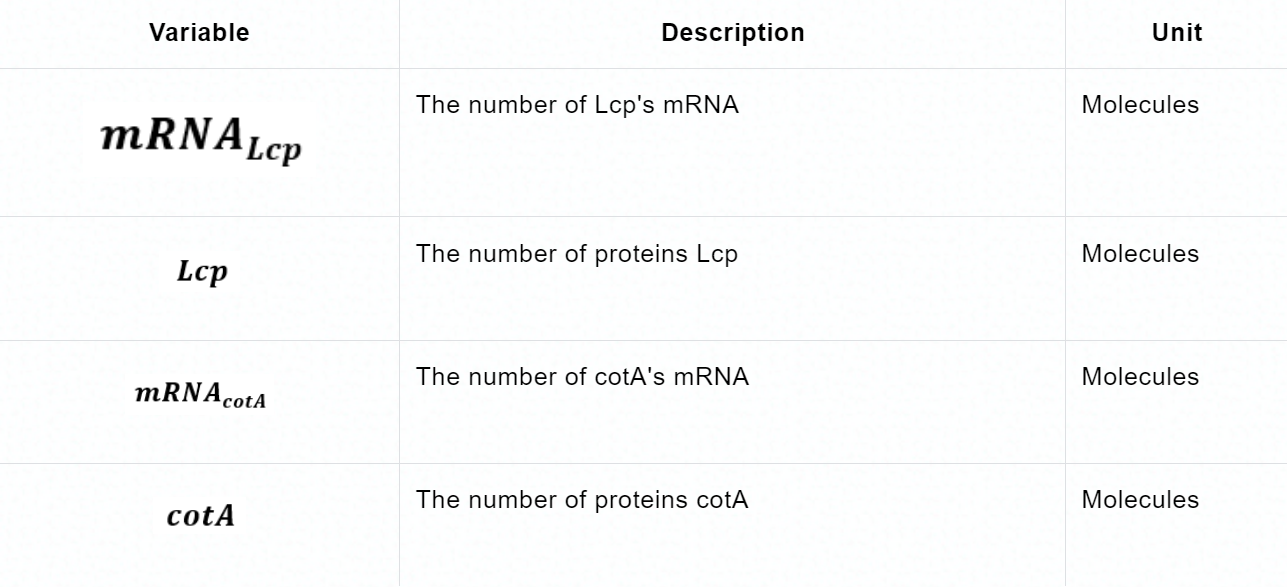
Table 2 | Variables, Biochemical species, and Units in the Expression model.
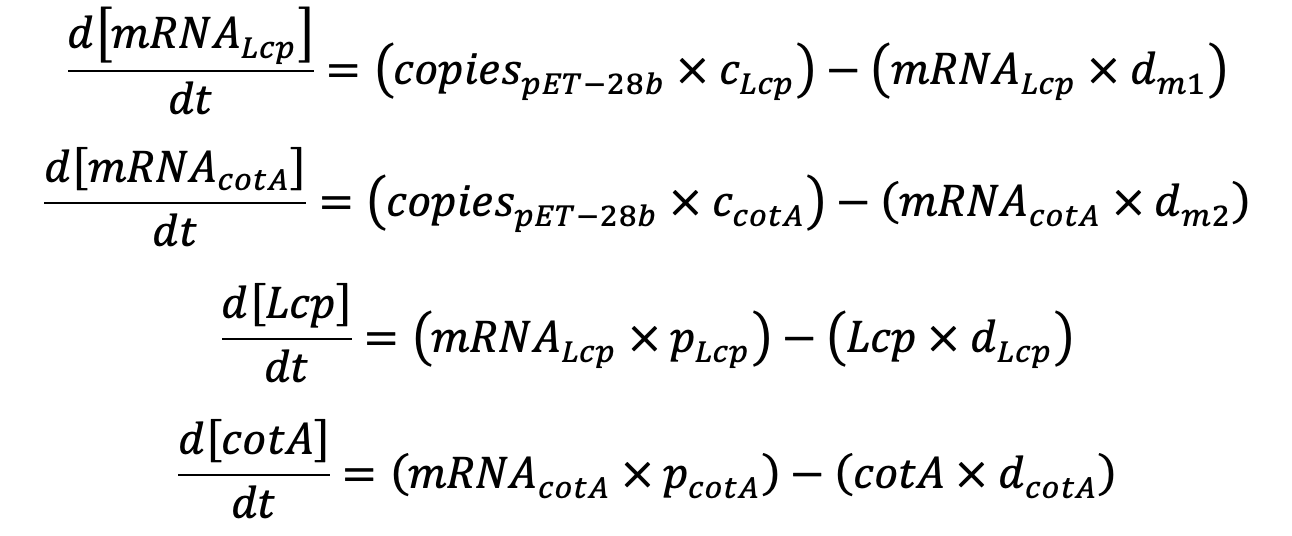
Through the above biochemical reactions, we try to describe the amount of mRNA and protein in molecules as the funtion of time. The followings are our functions.
Now that we have derived our equations, we must now define our constant (see table 3).
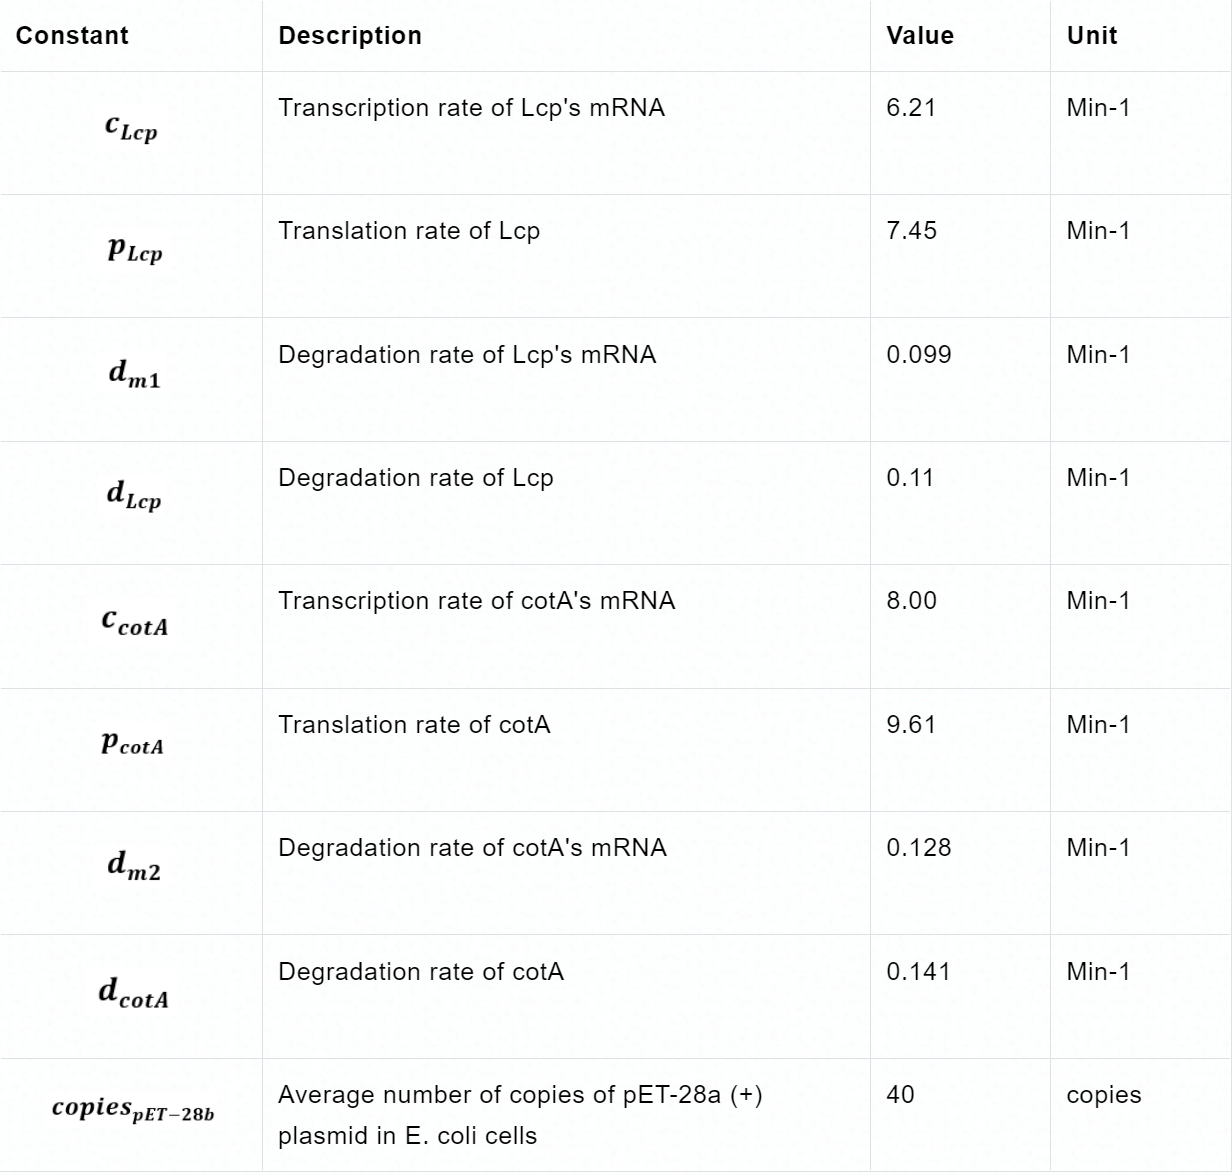
Table 3 | Parameters in the equations
(Those data are obtained by converting existing protein data into our data through the difference in protein size.)
Assumption
Before solving those equations, we need to make clear several prerequisites to rationalize our model:
- Protein and mRNA levels were 0 before induction.
- The synthesis and degradation rates of protein and mRNA are constant.
- The transcription speed of E. coli RNA polymerase is 50 nt/s.
- No other substance will affect the reaction.
Solving the Equations
Because they are ordinary differential and generally non-linear equations (ODE), mathematical models are simulated using software tools such as MATLAB. The results obtained from the simulation reflect the evolution of the concentration of biochemical species over time.
The computational simulation of this ODE model uses three MATLAB files: the odefun1.m and the odefun2.m function, which describes the system of differential equations, and the script testode45.m where the parameters are defined, and the ode45 MATLAB function solves the model. The corresponding codes and simulation results are shown in figure 2.
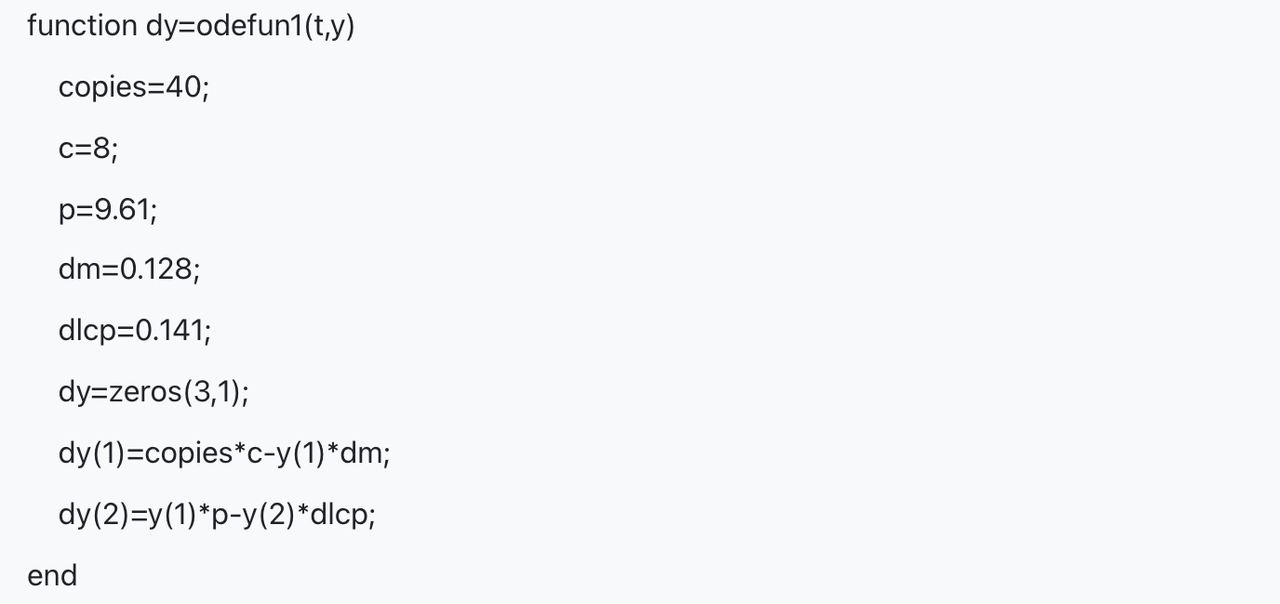
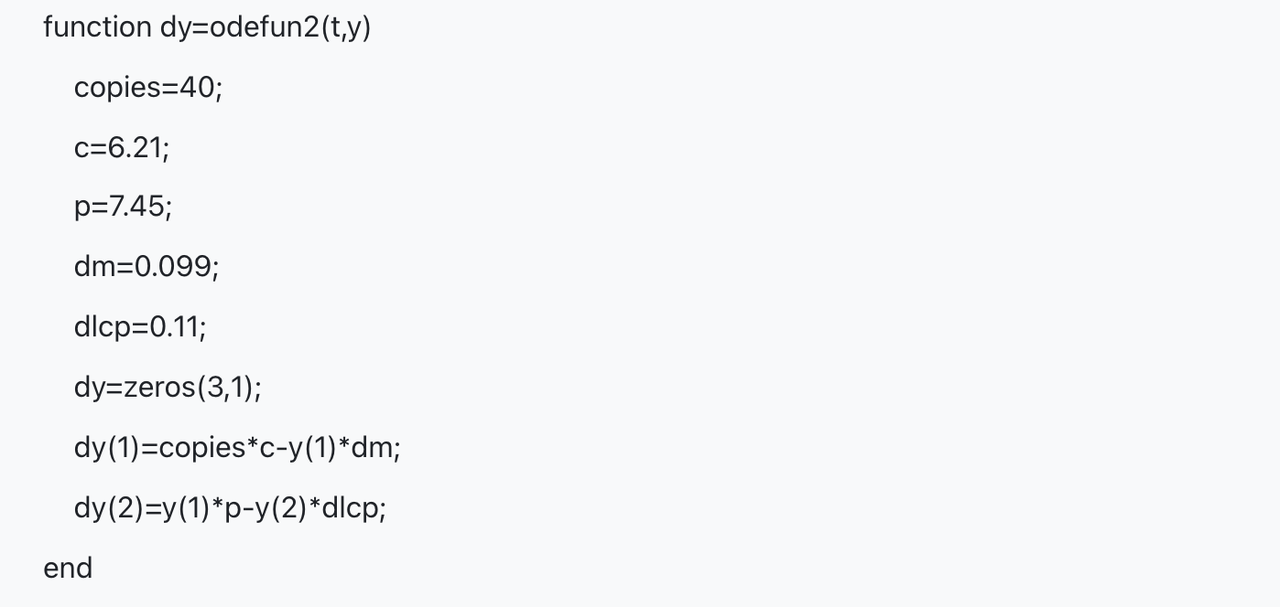
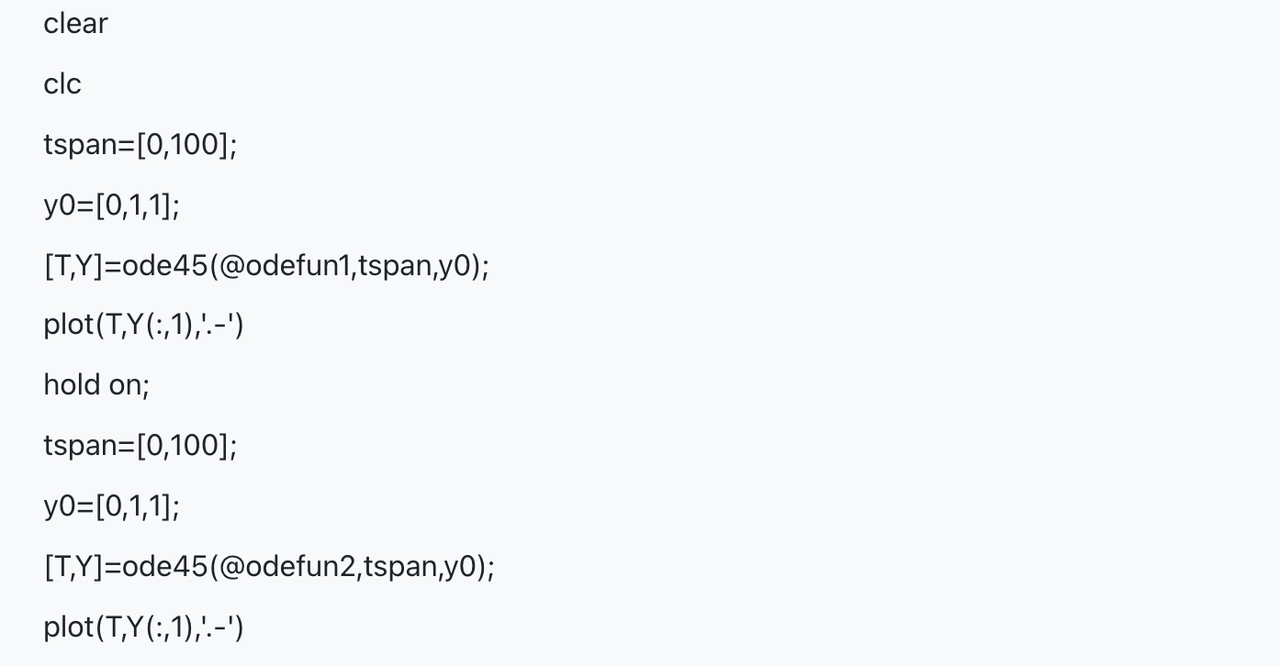
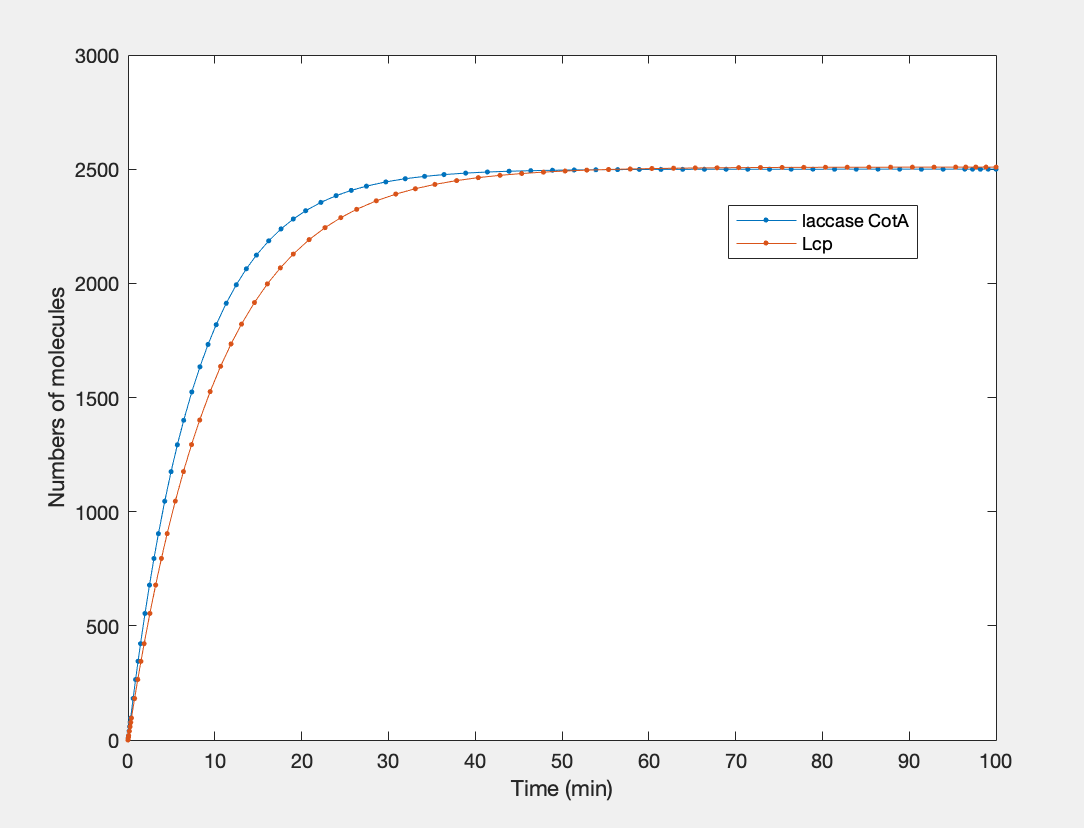
Figure 2 | Expression Model: Simulated result
In this simulated result, we can find the time for Lcp to reach its peak is about 55min, and the time for laccase CotA to reach its height is about 40min. Therefore, theoretically, the appropriate time for centrifugation and adding Lysozyme is 55min after fostering for Lcp and 40min after promoting laccase CotA.