Team:SMS Shenzhen/Model2


This year, SMS_Shenzhen heterogeneously express Laccase Cot A. In order to compare the enzyme activity and their affinities to the substrate of the original Laccase CotA and the mutated Laccase CotA, we conduct an enzyme-catalysed reaction model.
Michaelis-Menten Equation is used as the basic model, in which Vmax and Km indicate the enzyme activity. As a result, we set up the model to obtain the Vmax and Km of our Laccase CotA, and conclude a qualitative result: which enzyme works better in degrading the substrate, and a quantitative result: values of Vmax and Km of both laccases.
Enzyme-catalysed Model
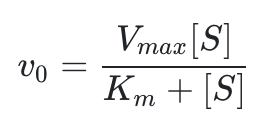
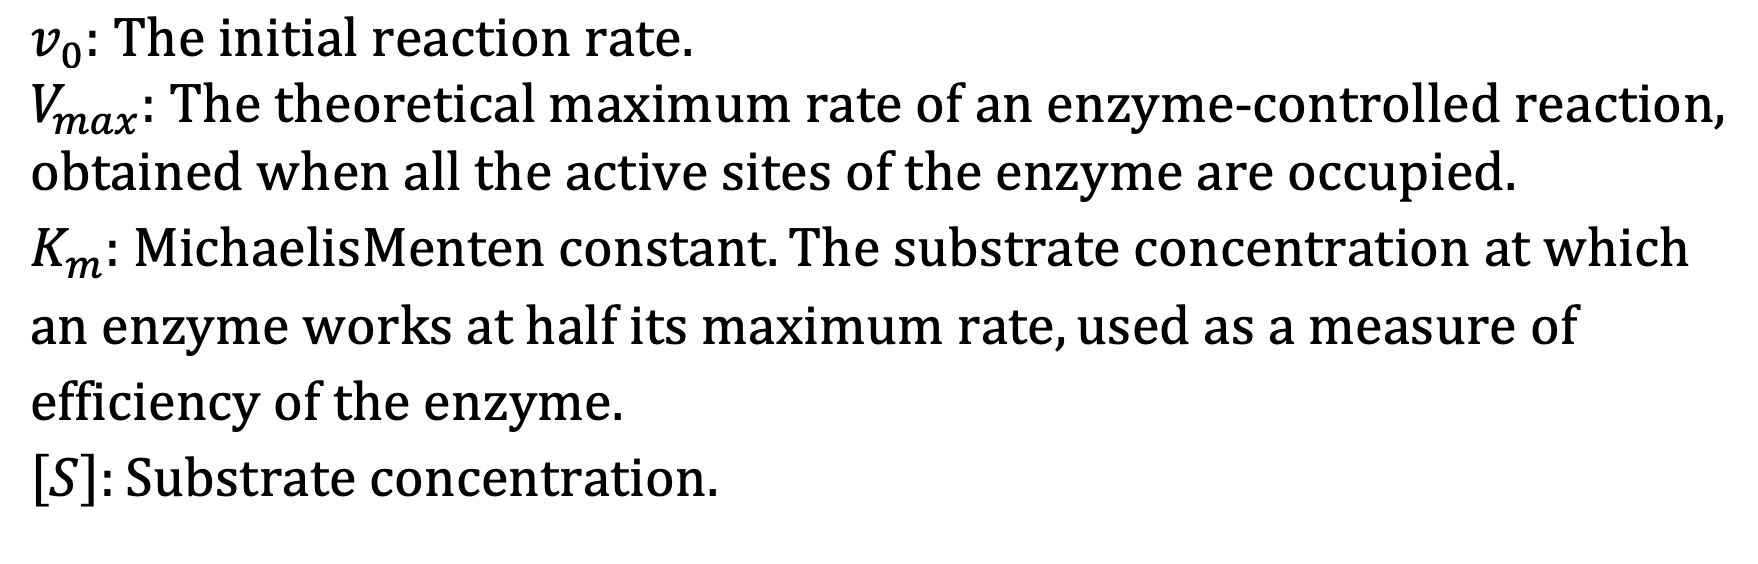
Michaelis-Menten Equation
Laccase is an enzyme or biocatalyst, which may help degrade chemical components in the gum base (hydrocarbon polymer) to small molecules. The biodegradation process by our laccase CotA is a typical enzyme-catalysed reaction. This reaction can be described by classic Michaelis-Menten equation.
Lineweaver-Burk Equation
In order to determine Vmax and Km, we use the conversion form of Michaelis-Menten equation, Lineweaver-Burk equation, also known as the double reciprocal equation.
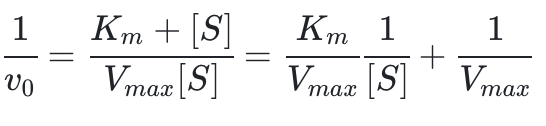
IA linear graph of 1/v0 against 1/[S] can be plotted by this equation. Km/Vmax is the gradient of the graph, and 1/Vmax is the y-intercept of the graph.
Assumption
We make three assumptions before we carry out the model:
1.The activity of the Laccase CotA is assumed to be almost unattenuated in 6 hours.
2. Laccase CotA and substrate are uniformly distributed in the reaction tube, therefore the enzyme contacts evenly with substrate.
3.When the substrate concentration is low, the equation can be simplified as V[S]/Km. Thus, the degradation reaction obeys the first-order rate law i.e. the [S]-t graph is an exponential function.
Method
Since the concentration of polymer is difficult to determine, we use the intermediate of the degradation reaction, ABTS, to obtain the data we need. The light absorbance of the oxidized ABTS, ABTS+, is determined.
Condition:
25 Celsius Degree; 0.1M sodium citrate; pH=3; OD=420nm.
Experiment Process:
1. Two experimental groups, Group A and Group B, are set up in total, with both group inoculated with laccase. The reagent solution is prepared by the following method:
a. Prepare Assay mixture containing 2 mM ABTS and 0.1M sodium citrate buffer.
b. Add 20uL purified and concentrated laccase with known concentration into 96-well plate.
c. Add 180uL assay mixture into the 96-well plate. Add 200uL assay mixture into the 96-well plate as blank control. Move the 96-well plate forwards and backwards to blend the assayed mixture.
2. Continuously measure the absorbance of assay mixture. The oxidation of ABTS is followed by absorbance increased at the absorption peak, 420nm (e420=36,000M-1·cm-1). The data applied in the equation here is tested every 10 minutes in a 6-hour period.
Data
The results of OD420 absorbance of the reaction catalyzed by laccase are shown in Table 1-2. According to Beer-Lambert law, (A=Kbc, where K stands for Molar Absorption Coefficient, which is 36000 in our experiment; b represents the thickness of the absoption layer; c is the concentration of the solution) we could convert OD into concentration. Therefore, ABTS+ concentrations are shown in Table 3-4. Each part of the data consists of two tables corresponding to two experiments respectively.
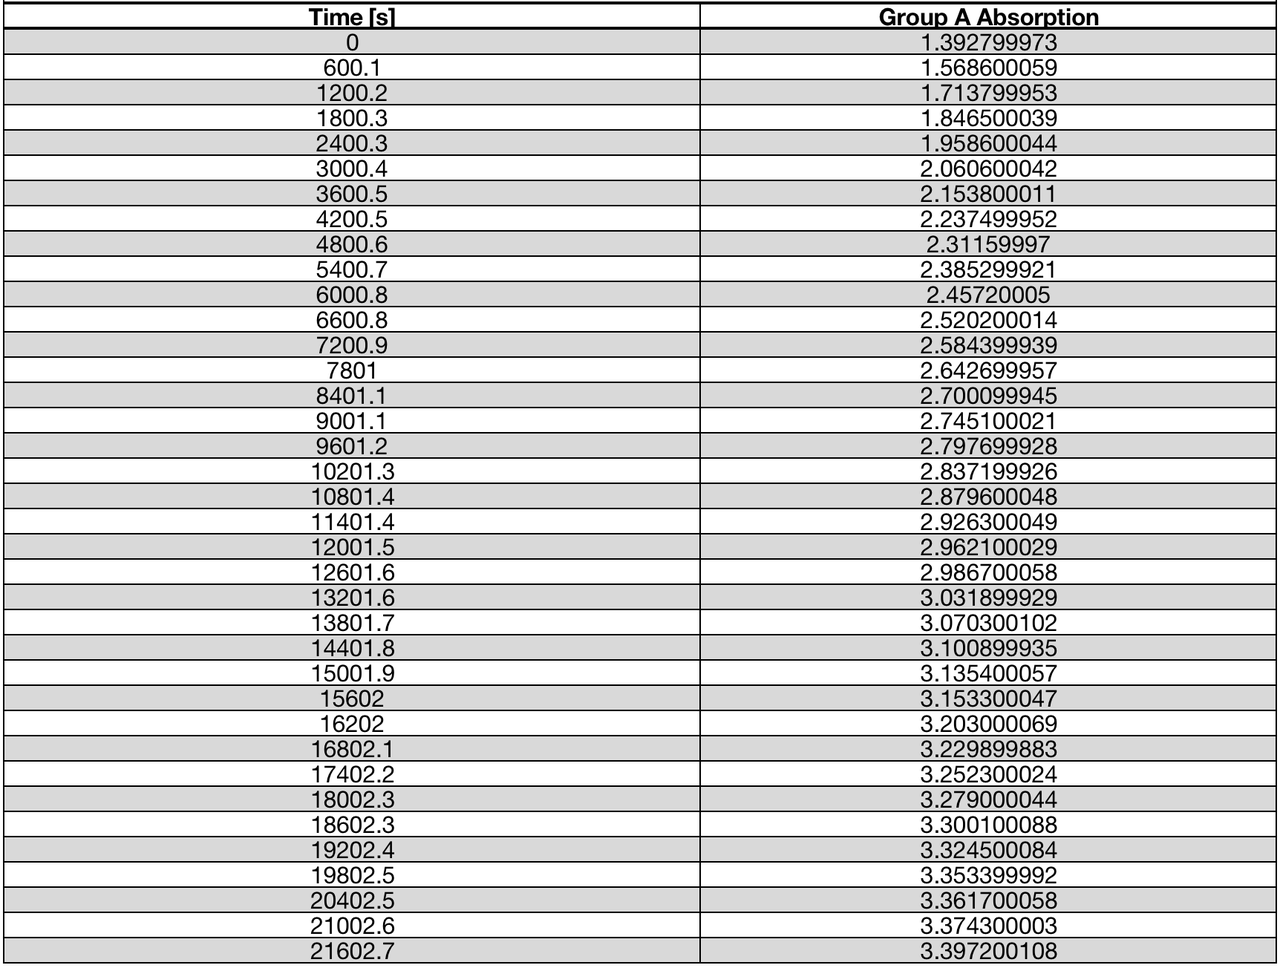
Table 1 | OD420 absorbance of ABTS+ in reaction catalyzed by Laccase CotA (A)
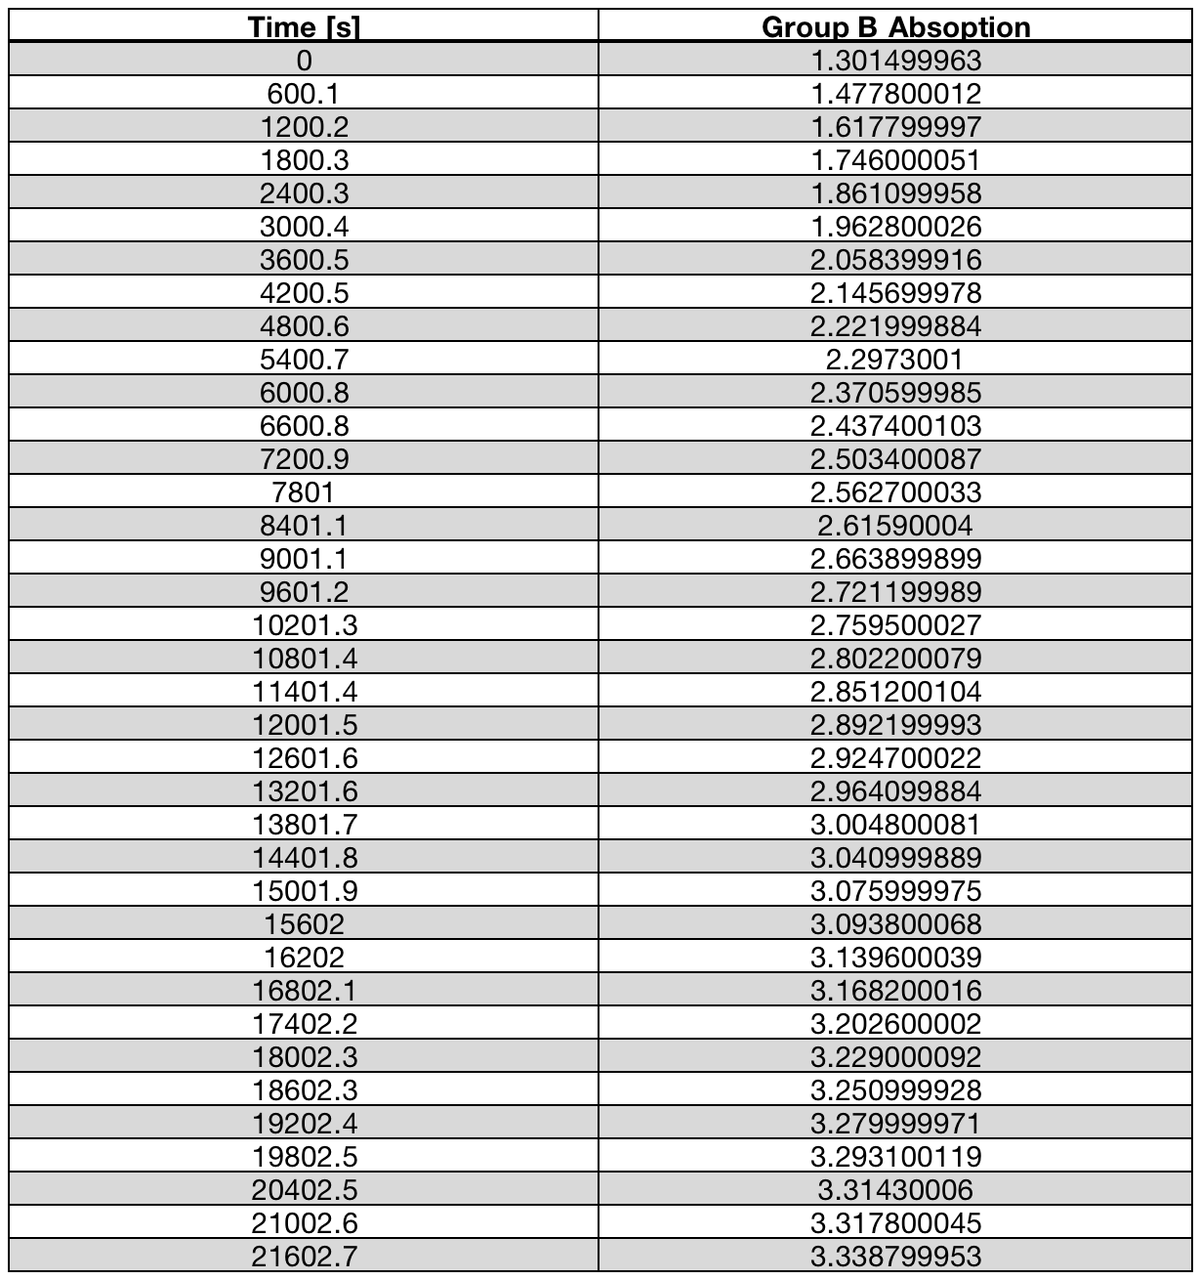
Table 2 | OD420 absorbance of ABTS+ in reaction catalyzed by Laccase CotA (B)
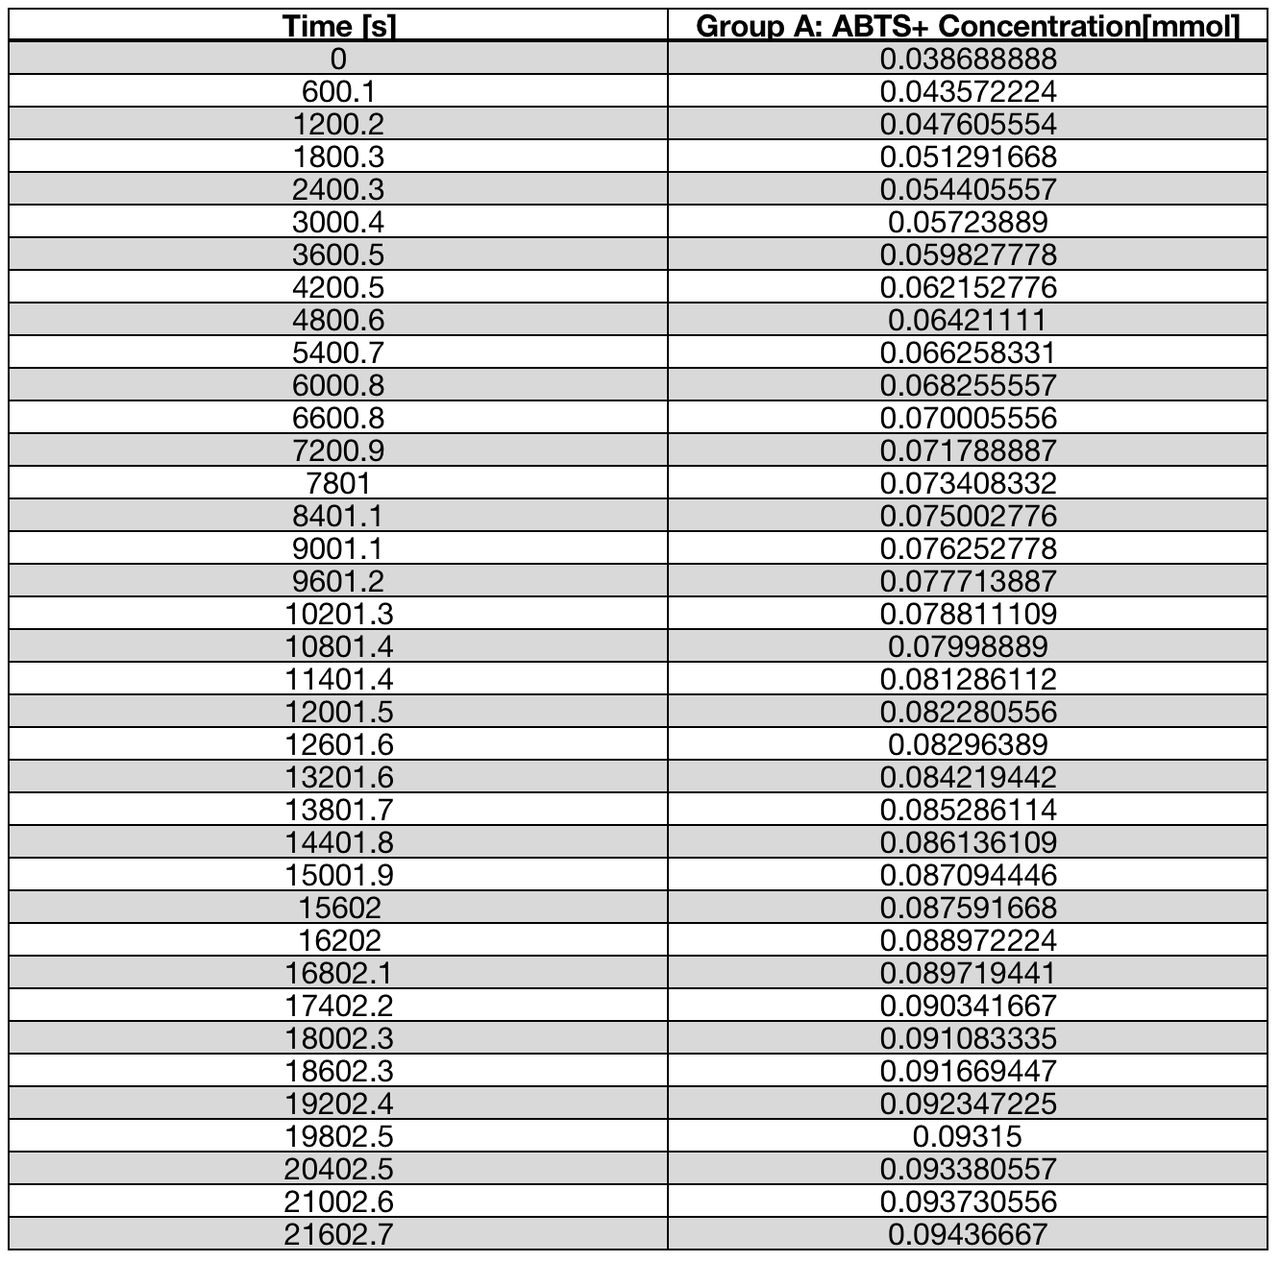
Table 3 | ABTS+ concentration in reaction catalyzed by Laccase CotA (A)
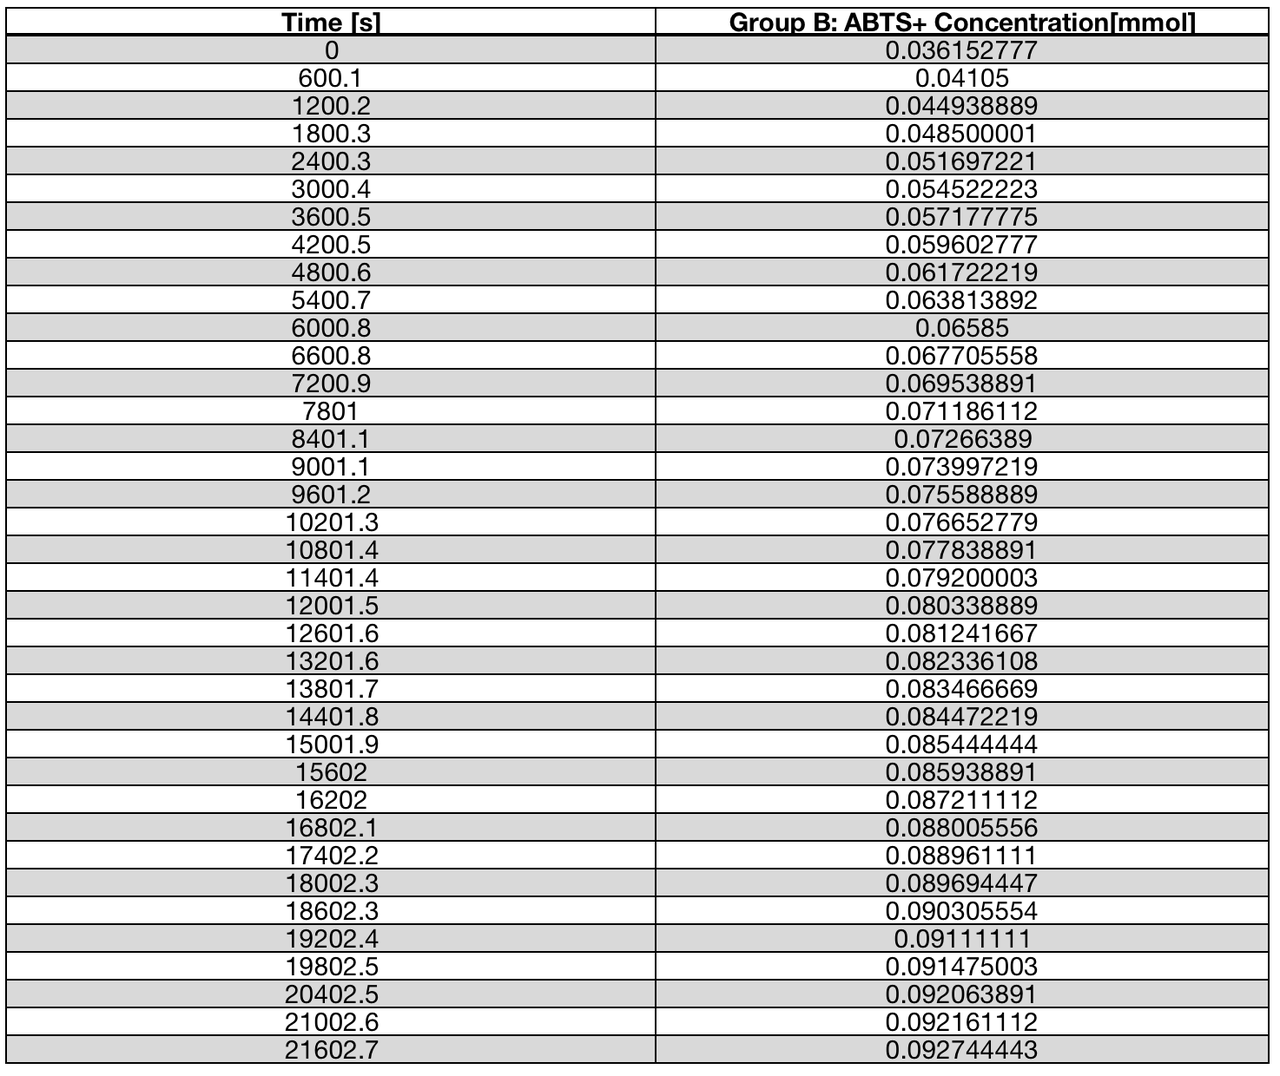
Table 4 | ABTS+ concentration in reaction catalyzed by Laccase CotA (B)
Test and Modeling
Obtaining initial reaction rate
In our modeling process, we choose to measure concentration continuously. The initial reaction rate is acquired by differentiating the graph, which is plotted with data above, fitting in a exponential function, at each substrate concentration.
Therefore, the results are shown in the following tables (table 5-6). The v0 acquired from an average of Table 5 and Table 6 are shown in Table 7.
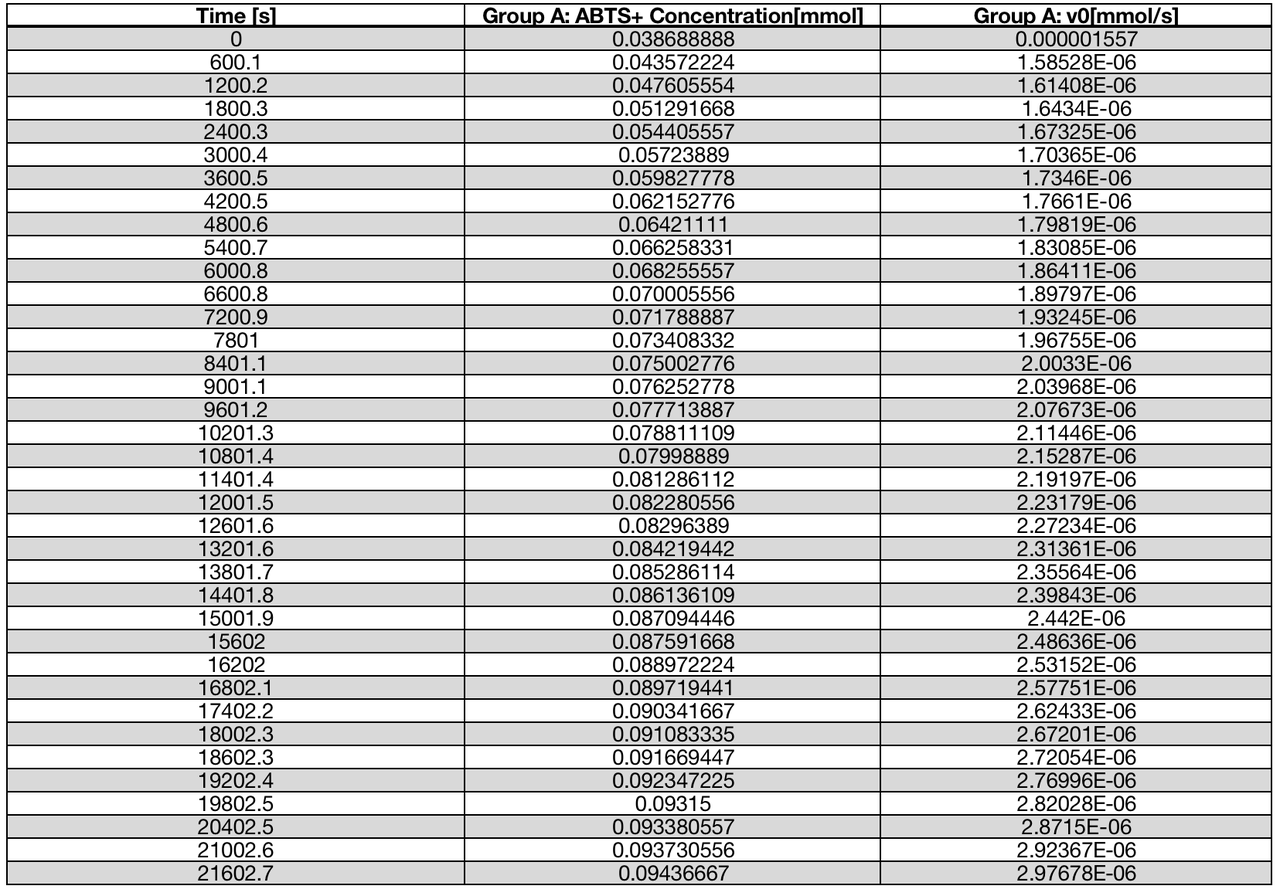
Table 5 | v0 at each substrate concentration in the reaction catalyzed by Laccase CotA (A)
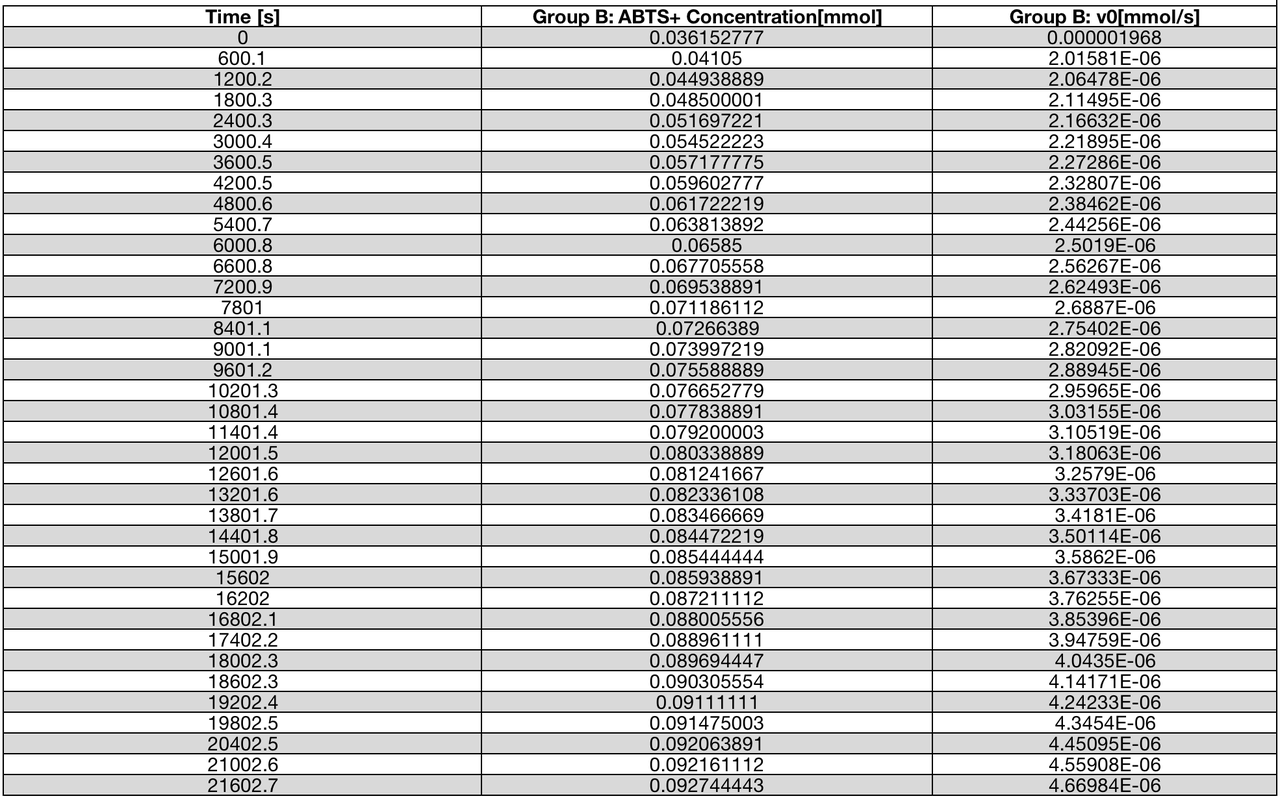
Table 6 | v0 at each substrate concentration in the reaction catalyzed by Laccase CotA(B)
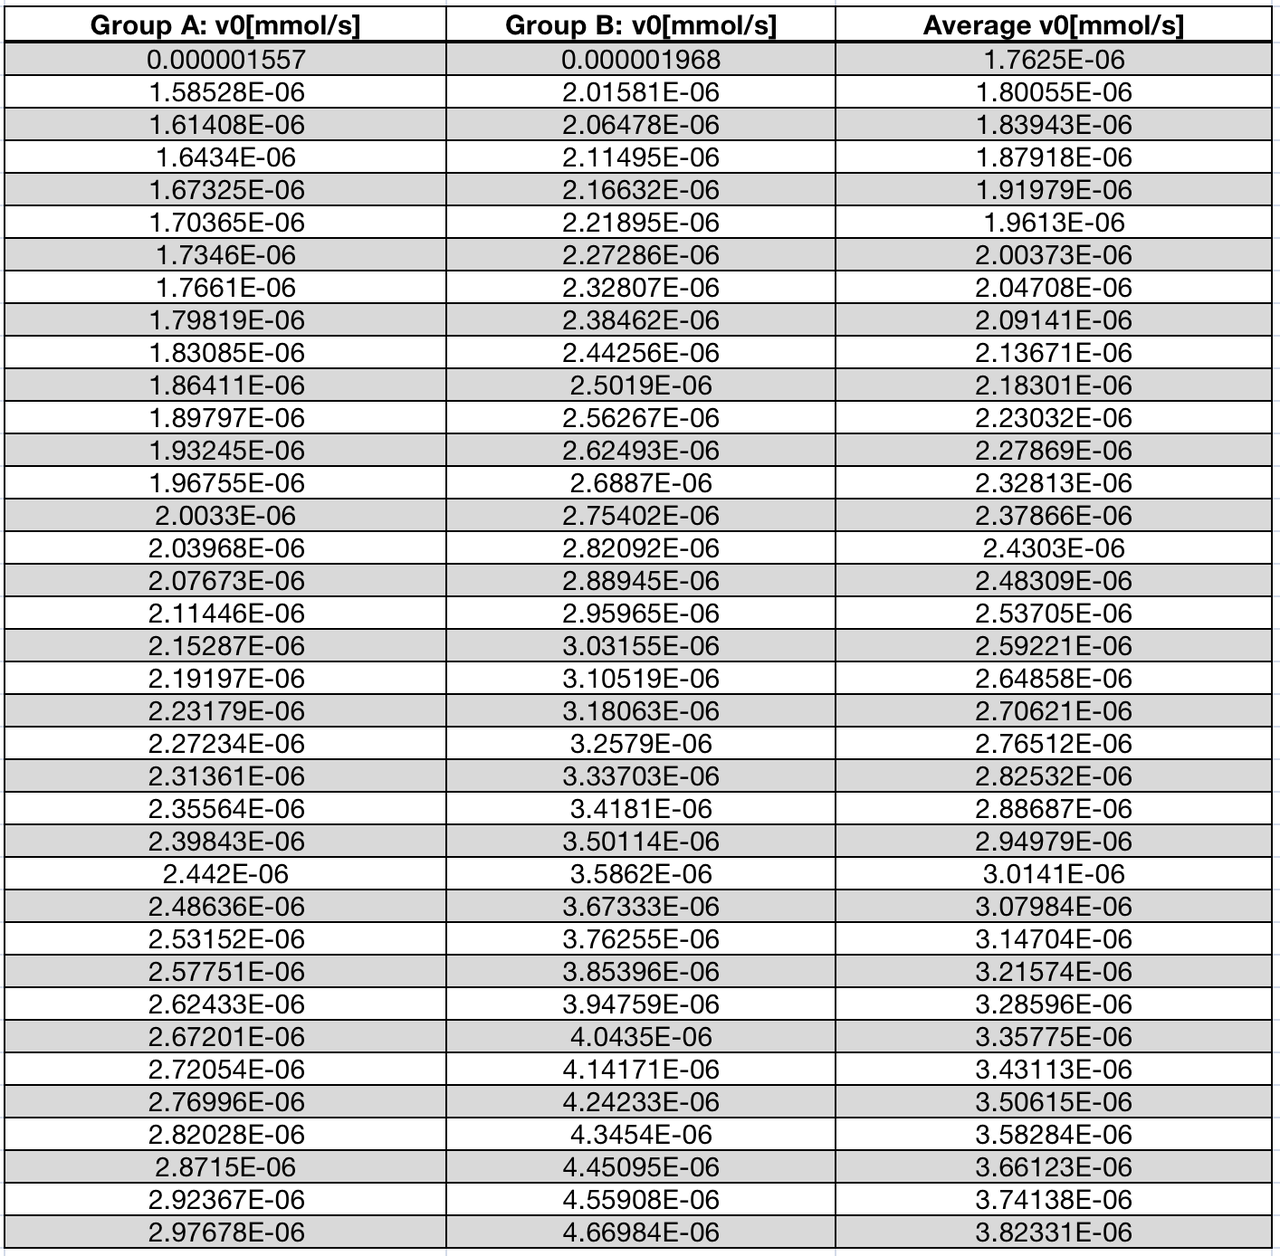
Table 7 | v0 acquired from an average of Table 5 and Table 6
Then, the data for the Lineweaver-Burk equation, 1/v0 and 1/[s], can be calculated (table 8).
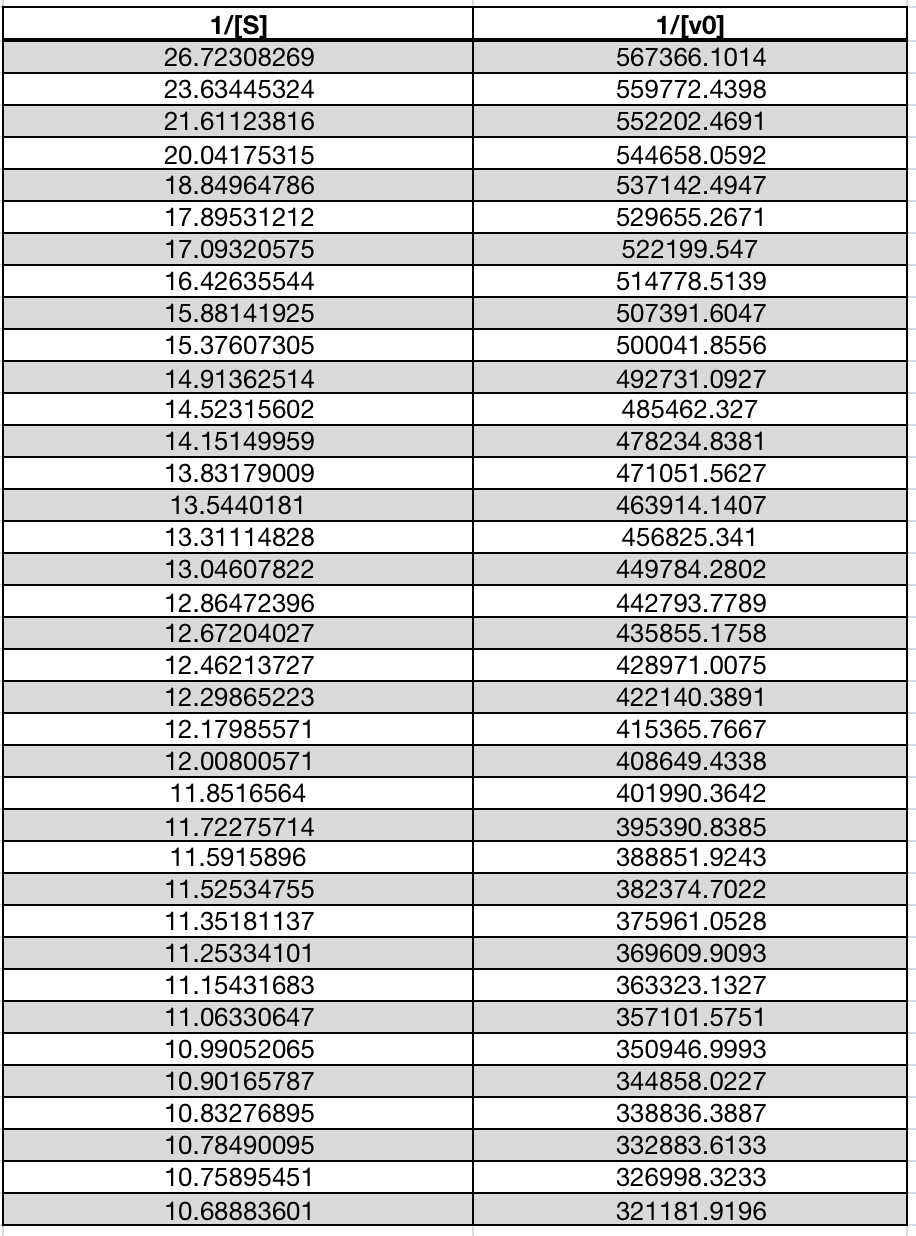
Table 8 | 1/v0 and 1/[S] in the reaction catalyzed by laccase
Model solution
By plotting 1/[S] and1/v0 scatter plots of original and mutated laccase data, it can be recognized that the data has a linear trend, so the dependent variable may be set y =1/v0 and independent variable x=1/[S]. Km/Vmax is the slope of line, 1/Vmax is the intercept of the line and the y-axis.
The graphs of original and mutated laccase are shown below.
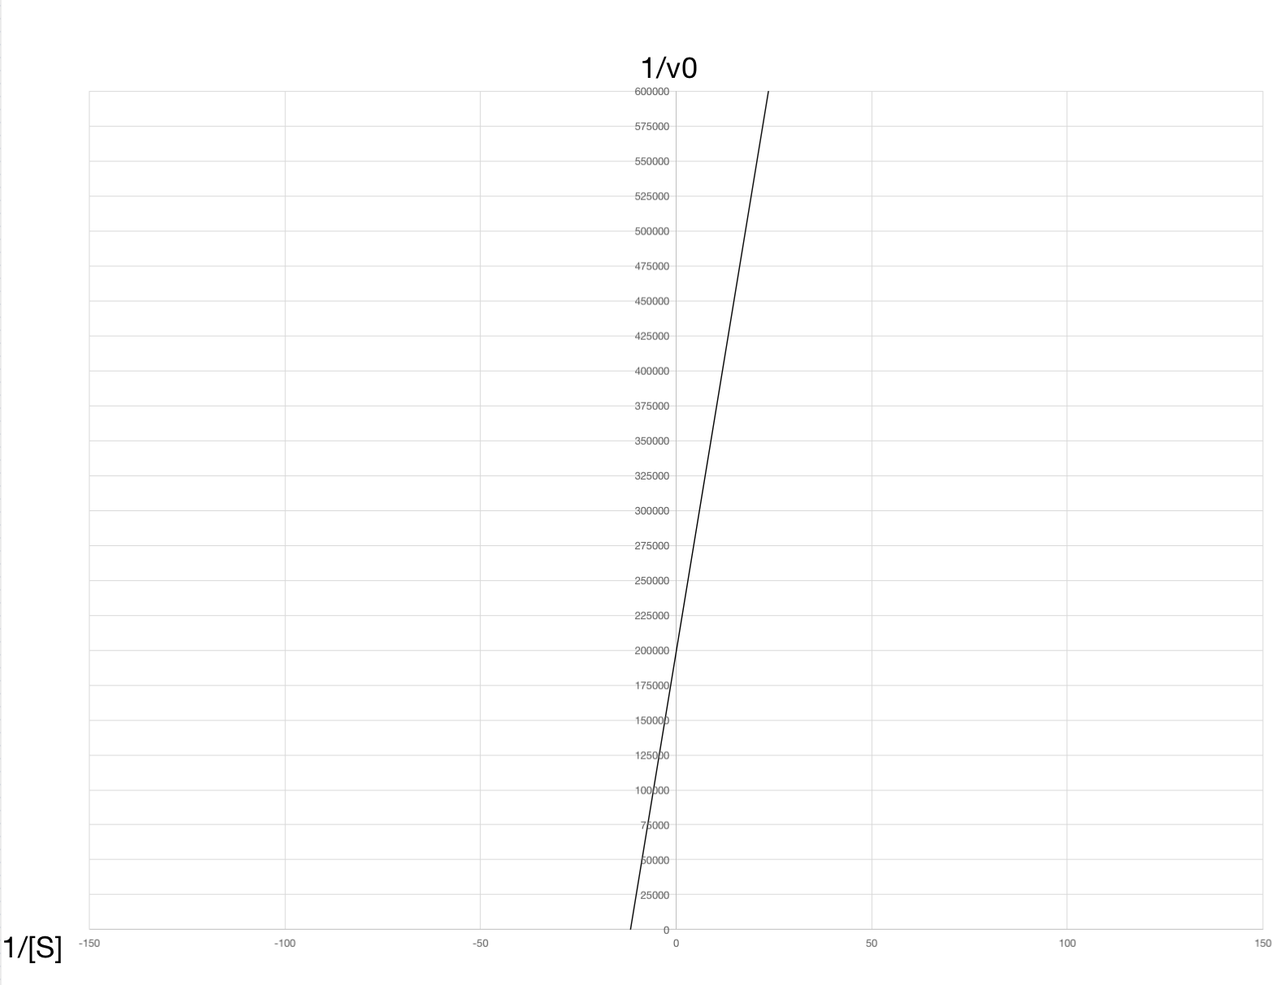
Figure 1 | graph plotted using Lineweaver-Burk Equation
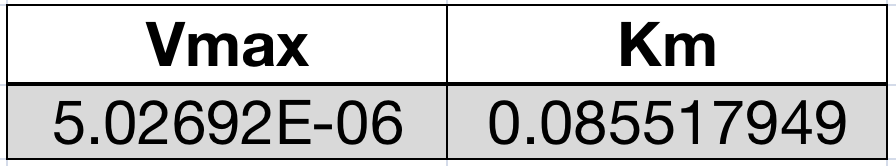
Table 9 | Results of model solution (Lineweaver-Burk Equation)
Graphing method improvement
From the graph above, we find that when the substrate concentration is turned to reciprocal, the interval of the two 1/[S] is too large, which may lead to high error when plotting the graph. Thus, a better statistic technique should be applied to obtain a more accurate result.
After doing some research, we learn a graphing method called Hanes-Woolf graphing method. It can be written as following:
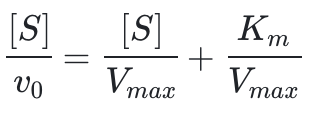
It can be seen that the slope is 1/Vmax, x-interception is -Km and y-intercept is Km/Vmax. It avoids taking the recipocals and the consequent error as well as the influence on x axis due to v0 error.
The data needed is shown below:
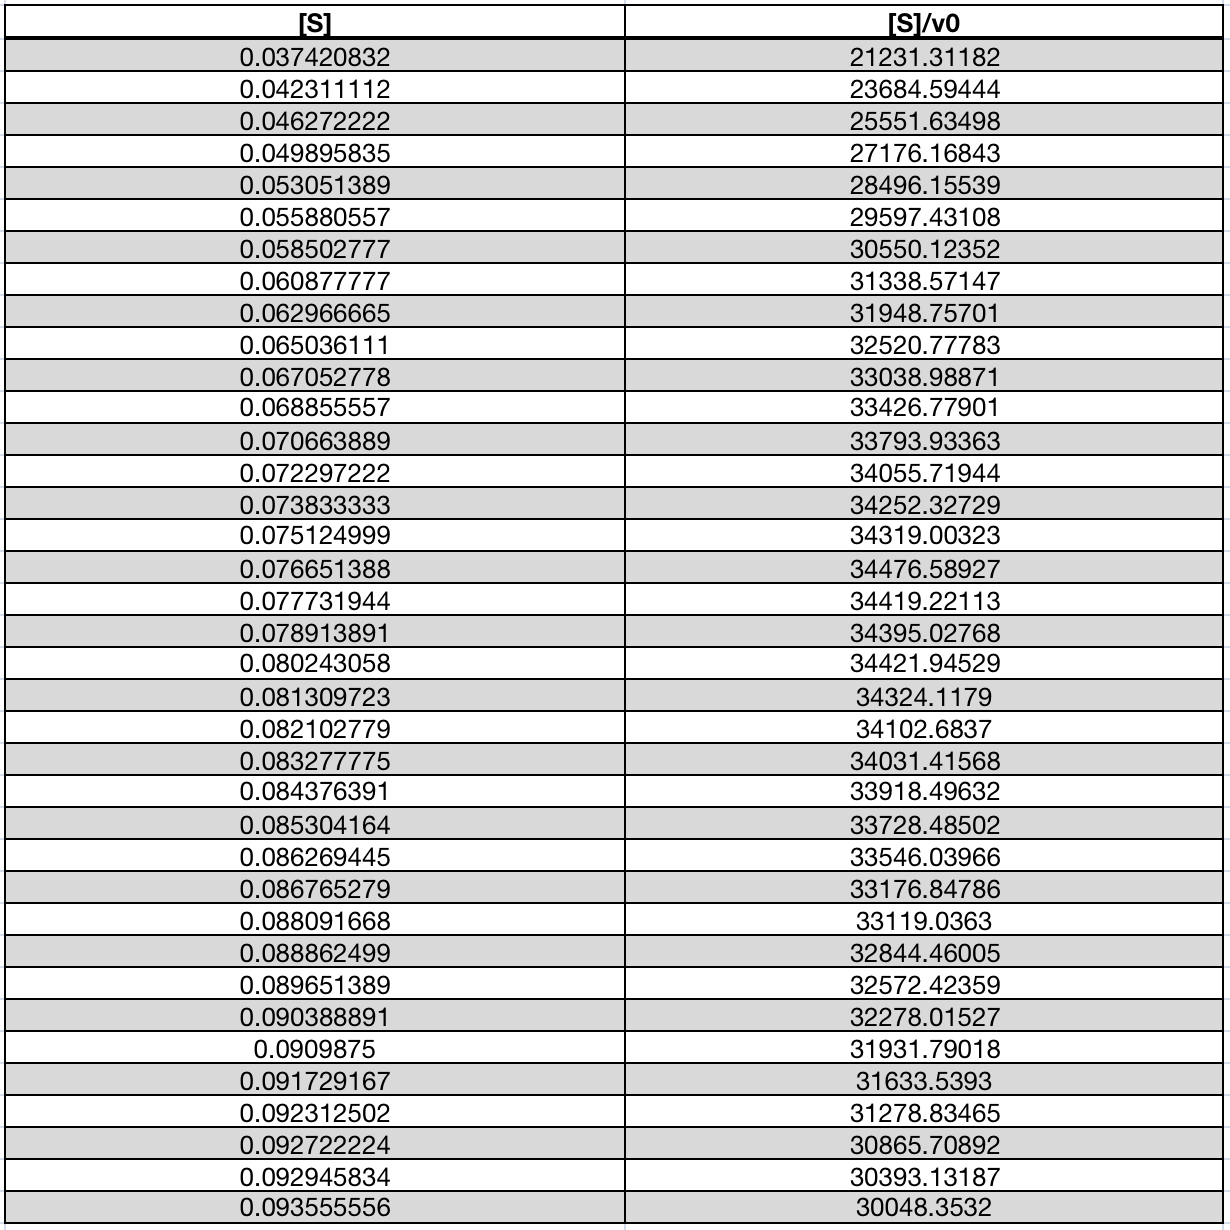
Table 10 | Data needed for Hanes-Woolf graphing method
Using this method, the graph is plotted as follow:
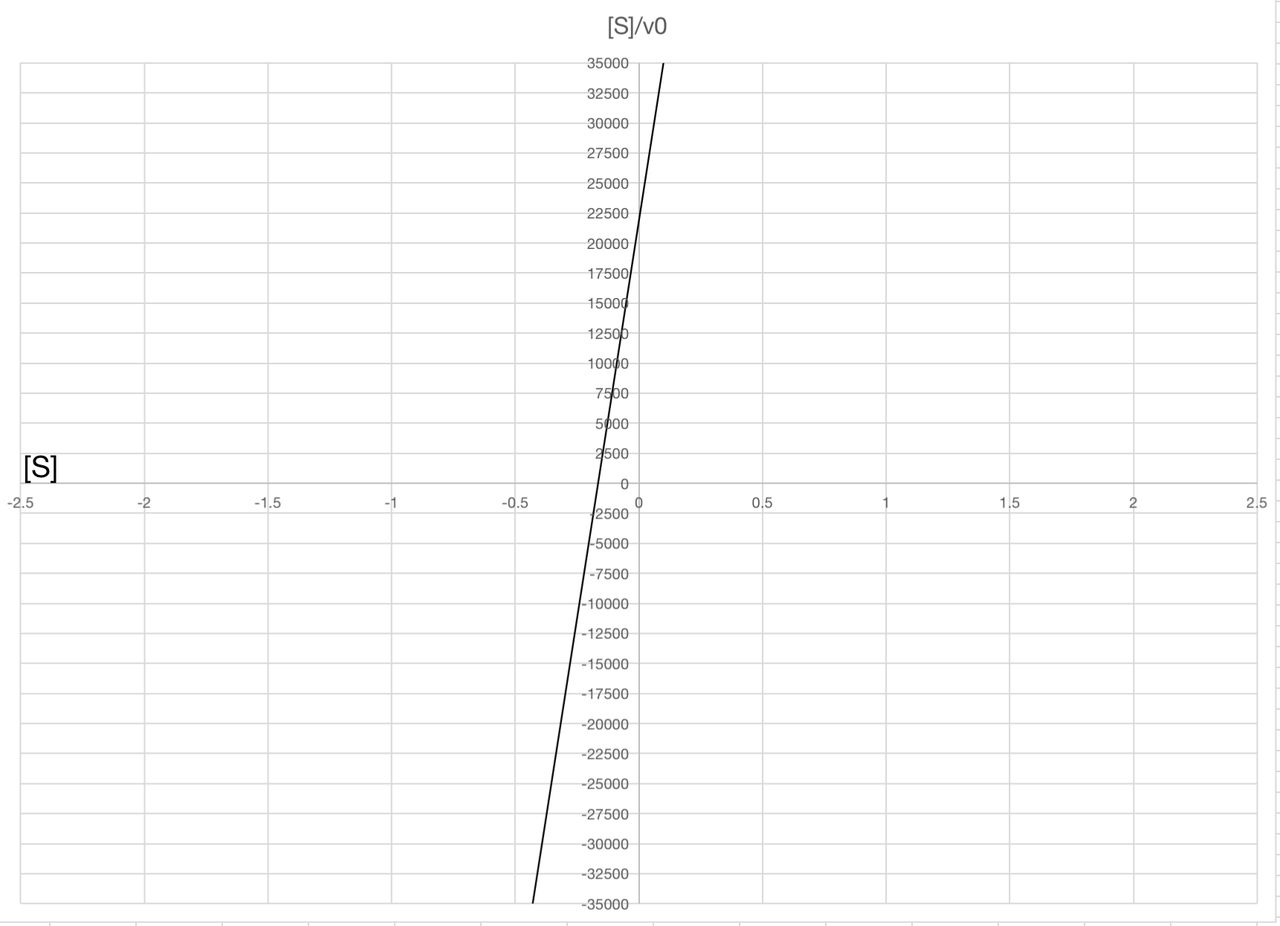
Figure 2 | Graph plotted using Hanes-Woolf graphing method
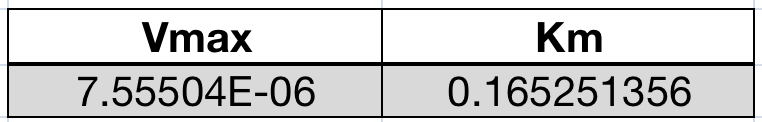
Table 11 | Results of model solution (Hanes-Woolf graphing method)
Conclusion, Discussion and Future Plan
Conclusion
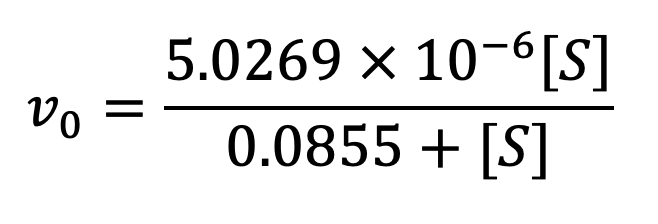
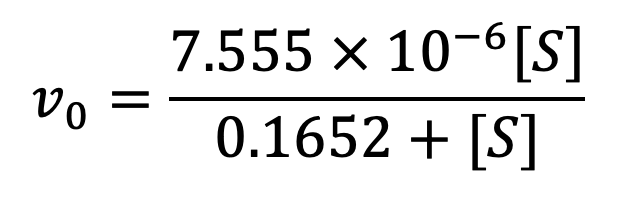
From the above results we can conduct the Michaelis-Menten equation of laccse-catalysed reaction of ABTS.
1. Using Lineweaver-Burk Equation
2. Using Hanes-Woolf graphing method
Discussion
When looking back our modeling process, we discover that the exponentially fitted [S]-t curve and the linear 1/v0-1/[S] graph are not fitted as perfectly as we expected. After doing some research, we suggest possible causes of the error.
For the curve, the rate law of enzyme-catalysed reaction is more complicated than our assumption. When substrate concentration is low, the reaction obeys first order rate law; when substrate concentration is high, it obeys zero order rate law; when substrate concentration is not high nor low, the reaction is a mixed order reaction. However, we assume that the throughout reaction obeys first order reaction, that might be the reason why our graph did not fit perfectly. More research should be done to solve this problem.
When we use Lineweaver-Burk Equation to linearize the Michaelis-Menten Equation, we discover some defects. Because the substrate level we take in our experiment is relatively low, the data points are concentrated at the left bottom of the coordinate when we take the reciprocals of the raw data, leading to the deviation of the linear graph. Therefore, Km and Vmax may not be calculated accurately by the function of retention line. In future modeling, we will dilute the solution into 1/[S] concentration gradient and test the absorption respectively, so that more data can be gathered and the data will evenly distributed along the x-axis with smaller error.
Future Plan
Since we haven't got a quantitative data for the mutated Laccase CotA, the model for mutated Laccase CotA has not been set up. As soon as we amend our experiment and acquire relevant data of mutated Laccase CotA in the near future, this model will be completed, and a quantitative comparison of enzyme activities and affinities to substrate will be carried out.