Team:Rochester/Contribution

Loading...


Menu
Contribution
Table of Contents
Click on a title to visit
The Potentiostat: an essential device in electrochemical and electroanalytical analysis.
Potentiostats are the required instruments in precise electrochemical biosensing applications, and are simple devices that use operational amplifiers to maintain a potential difference between two electrodes (working and reference electrodes) in a solution while monitoring the changes of the electrical current that flows between these electrodes. In our project, we required an instrument that could measure the signal at the electrodes once biomarkers in sweat bind to the aptamers on reduced graphene oxide (rGO). We were advised to use a potentiostat by Dr. Cecilia de Carvalho Castro e Silva to characterize the surface of a working electrode after adding the solution of rGO and aptamers on the top of it. By conducting cyclic voltammetry using a potentiostat , we can observe changes in the current after modifying the electrode with the solution of rGO and aptamer. However, we did not find any potentiostat on our campus, and the instrument was too expensive for us to purchase (around $9000).1
Not having a potentiostat of our own, and aiming to make it more accessible to iGEM teams, we built an alternative potentiostat machine. This instrument can help with detecting signals at electrodes once there is a conformational change of a molecule(s) after the binding occurs. In our project, aptamers attached to rGO will change the conformation once the biomarkers bind to them. Projects aiming to detect the presence of any type of analyte in a certain body fluid or the solution could use this potentiostat to analyze electrochemical signals.
We found and contacted a group from Northwestern University which manufactured a low-cost potentiostat with simple, user-friendly software.2 To manufacture a potentiostat, they developed a device that included a low-cost microcontroller-based potentiostat and a LabVIEW-generated graphical interface as an accompanying software.3 The advantages of manufacturing this potentiostat were: could be made out of cheap, accessible electronics, it is modular and it is connected to software which could give a quick readout. The cost of all components is around $40. To make a potentiostat inspired by their design, we connected Arduino Uno circuit board and a daughter board. For more information on required components and assembly of the device, refer to a this page
Using Arduino Uno and Daughter board.
An Arduino Uno board is a low-cost, easy-to-use, open-source microcontroller that can be used in electronics. It was used for generating a fixed-voltage waveform through the control of the pulse width modulation (PWM) pin (Figure 1) . We used a printed circuit board (PCB) for assembling the daughter board, which is a printed circuit board that plugs into the main Arduino board. Gerber file, where we had all the information about what each component is and how components are connected, was used as a standard format file for PCB. We used a Gerber file provided by the team of international students from Northwestern University, led by Y. Christopher Li from Penn State, and we purchased the PCB from Seeed Studio.
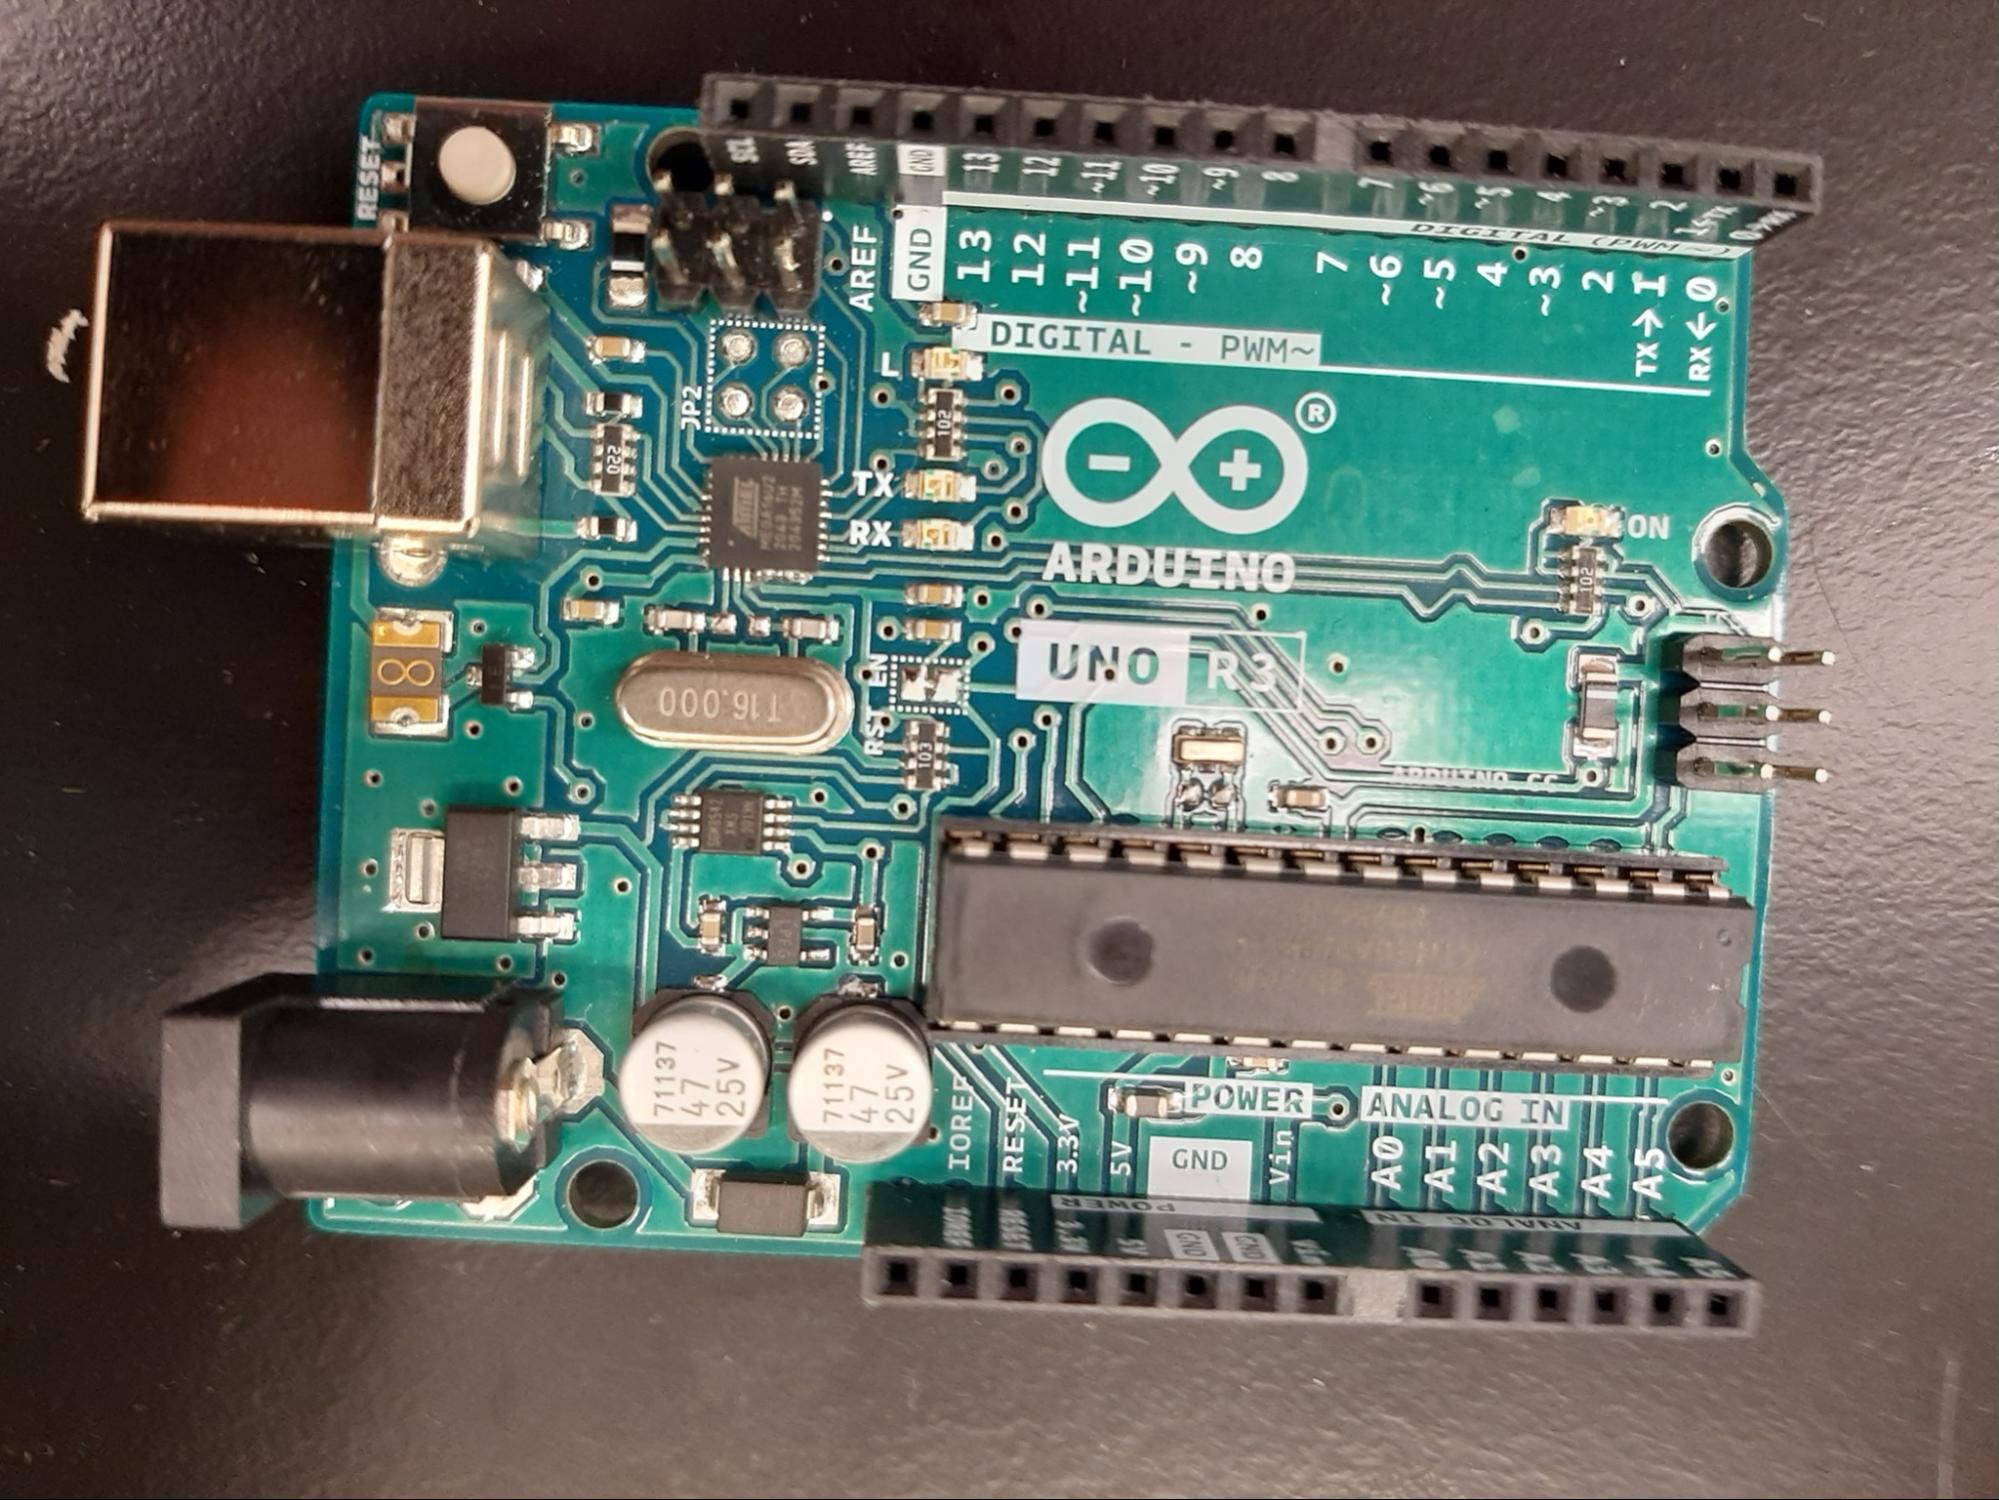

Figure 1: Printed circuit board (on the left) and Arduino Uno board (on the right) as the main components of our potentiostat.
Electronic Components
Capacitors and resistors were used to construct the circuit in PCB (Figure 2). C indicates capacitor and R indicates resistors. Table 1 lists components we required for the circuit.
| Quantity | Components | Value |
|---|---|---|
| 1 | Capacitor (C1) | 1 uF |
| 1 | Capacitor (C2) | 1000 pF |
| 2 | Capacitor (C3)(C4) | 10 uF |
| 1 | Capacitor (C5) | 100 pF |
| 2 | Resistor (R1,R13) | 1K |
| 4 | Resistor (R2,R3,R9,R11) | 10K |
| 1 | Resistor (R4) | 4.7K |
| 2 | Resistor (R5,R6) | 100K |
| 4 | Resistor (R7,R8,R10,R12) | 68 |
| 1 | Resistor Jumper | 220 |
| 1 | Op Amp |
Table 1: Components required for the daughter board.

Figure 2: Adding circuit components to the printed circuit board.
3D Printed Casing
CAD drawings for the bottom and middle part of potentiostat were designed in AutoCAD software, and with the permission from the author, we used the design to print the parts for our potentiostat. Bottom part was designed so that the Arduino Uno could fit inside of it (Figure 3).

Figure 3: Top- the bottom part of the potentiostat made to fit Arduino Uno. Bottom- and the middle part of the potentiostat.
Assembly
After we finished connecting the daughter board, we assembled it with the Arduino Uno (Figure 4). These two parts were connected using the following ports:
- The PWM wire on the daughter board to digital Pin 9 on the Arduino Uno.
- +5 V wire on the daughter board to the 5 V Pin on the Arduino Uno.
- The ground wire on the daughter board to the GND pin on the Arduino.
- Analog read 1 and analog read 2 on the daughter board to analog Pin 0 and Pin 2 respectively.
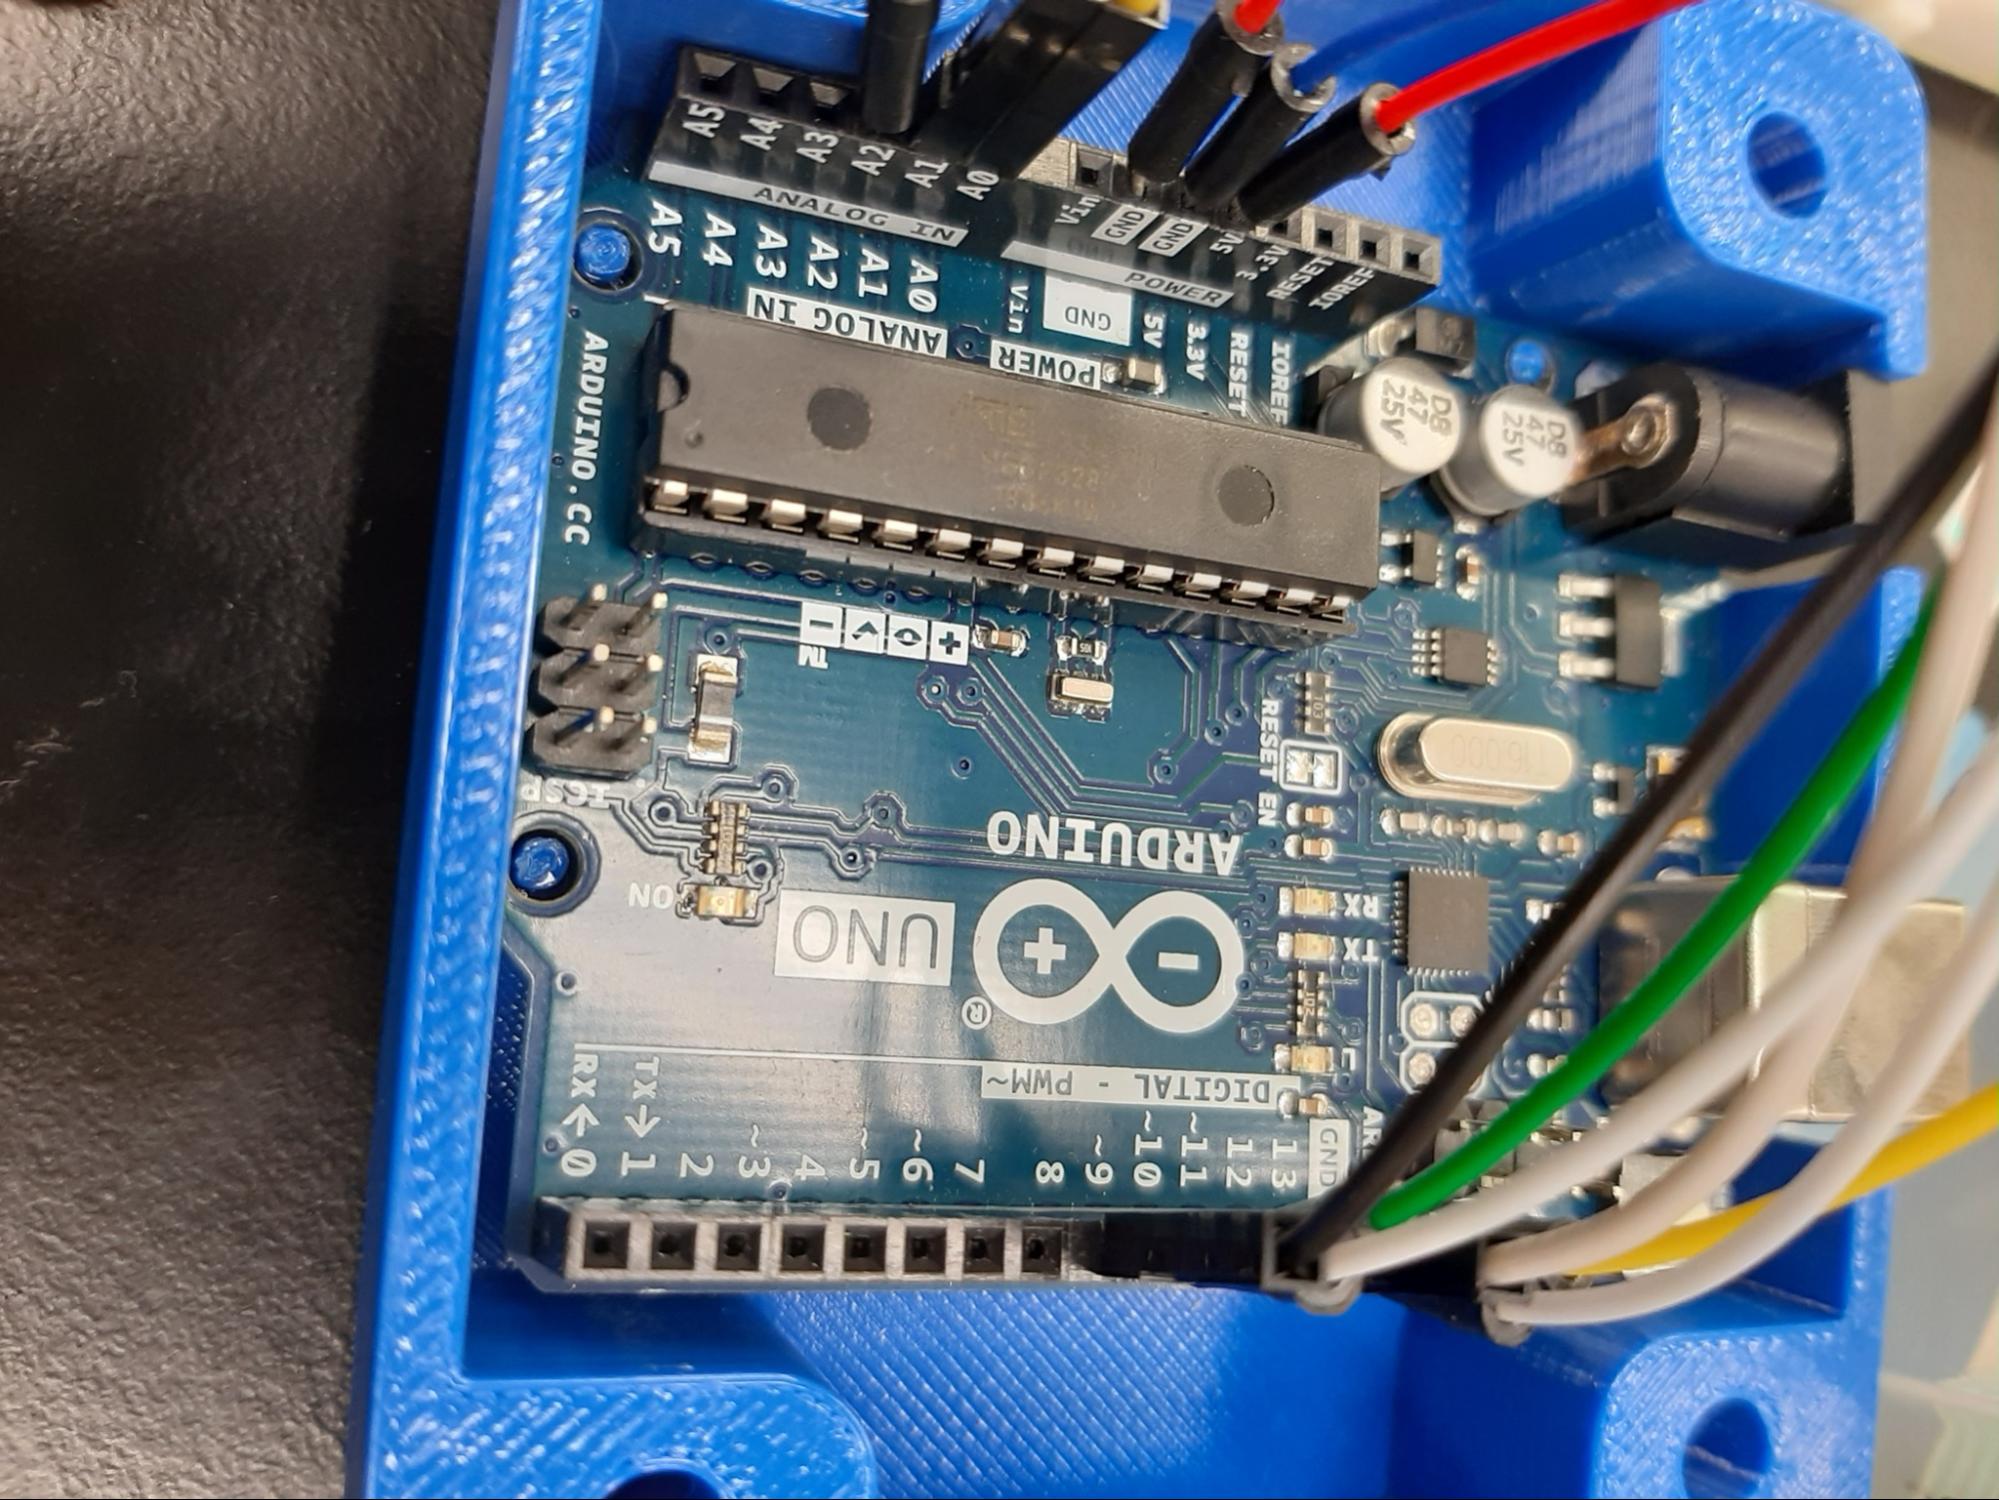

Figure 4: Connecting Arduino and daughter board
The Arduino code presented in the paper did not work for our design, as it could not connect to JUAMI software and LabVIEW. Therefore, we had to change the design to make Arduino connect to JUAMI and LabView. We found a different code and changed it a bit to adapt it to our existing design.4 This new code was written to conduct cyclic voltammetry but it did not include any a PCB board that our design had. Therefore, we connected a breadboard to Arduino, and added a Liquid Crystal Display (LCD) to the existing circuit to provide a user interface to make a new code work. This way, Arduino in our new design connected to LabView and JUAMI software and was able to conduct cyclic voltammetry experiments.
To add LCD to the circuit, we used a potentiometer to adjust the contrast of the display, a breadboard and wires. Using the schematic from Figure 5., we connected the breadboard with LCD to Arduino Uno. To connect the potentiometer and LCD to the Arduino, we did the following steps:
- We connected the LCD screen by inserting each line of it to the individual pins on the breadboard. Potentiometer has three lines and each of them was inserted into an individual pin on the breadboard.
- We connect 5V and GND from Arduino to the + / - rails on the breadboard. This grounded the LCD.
- We connected pins 1 and 16 from the LCD screen to the negative power rail (- rail on the breadboard). Pins 2 and 15 from the LCD were connected to the positive power rail. This connection led to powering the LCD.
- Next, pin 3 was connected to the center pin of the potentiometer to control the contrast.
- Potentiometer has two more outer pins and they were connected to the GROUND (GND) and 5V rails on Arduino.
- Next, pin 4 from the LCD was connected to pin 12 on the Arduino.
- Next, pin 5 from the LCD was connected to the ground on the breadboard.
- We connected pin 6 from the LCD to pin 10 on the Arduino.
- We connected pin 15 to the + rail of the breadboard. Pins 11, 12, 13, and 14 were connected to Pins 11,10,9, and 8 on the Arduino, respectively.5

Figure 5: Connecting LCD to Arduino6
Testing
.After building our potentiostat, and connecting it to JUAMI, we wanted to test how sensitive it was to varying concentrations of an analyte. To test if our potentiostat could reliably detect different concentrations of the analyte in the electrode, we prepared different concentrations of salt (NaCl) and ran cyclic voltammetry using a potentiostat. We prepared the following concentrations of NaCl: 1M, 0.5M, 0.1M, 0.05M, 0.001M, 5uM, 1uM, 100nM, 50nM, 5nM, and 1nM. Then, we connected the screen-printed electrode to the potentiostat circuit. The circuit was connected to JUAMI. We set the voltage scan rate to be 0.1 V/s, from -2 V to 2 V for 10 cycles - 200 seconds. The electrode was immersed into the solution and we started cyclic voltammetry. We plotted the results (Figure 6).


Figure 6: Testing sensitivity of our potentiostat using NaCl.
Figure 6 shows that, at the concentrations of NaCl at 100nM, 5nM, and 1nM, the peak current shifted. The peak current was -2 mA in 100nM, 5mA in 5nM, and around 1mA in 1nM of NaCl.
Next, we wanted to test if the potentiostat could detect the binding between aptamer on rGO sheet and the biomarker in sweat. We conducted cyclic voltammetry experiments to test binding between lactoferrin aptamer and biomarker. We used a range of biomarker concentrations from 1000 nM to 1.9 nM and recorded change in current given the constant potential a difference.
We connected our potentiostat to JUAMI software, and we set the scan rate as 100 mV/s with voltage oscillating between -2 to 2 V. We ran 10 cycles, which was 200 seconds, for each experiment.
Figure 7 shows the potentiostat output, where change in current was monitored at desired voltage difference. At biomarker concentrations of 1.9 nM and 7.8 nM, we observed a shift in peak current between the control (rGO) and experimental condition (rGO and aptamer). On the top part in Figure 7, using biomarker concentration of 1.9 nM, we observed that the peak current for control was about 6 mA. In contrast, the peak current on electrodes covered with rGO and lactoferrin aptamer was -1 mA. When we used a biomarker concentration of 7.8 nM, we observed the similar trend - peak current was about 6 mA for control and -2 mA for aptamer. Additionally, when we compared controls at both concentrations of biomarker, we observed the same peak (6 mA), while peak current values were negative when aptamer was attached to rGO at both concentrations of biomarker. These observations confirmed that binding between aptamer and biomarker was not detected in control at any biomarker concentration.


Figure 7: Using cyclic voltammetry to detect binding between lactoferrin aptamer and biomarker.
Next, we found the maximum current and inferred the potential at which this current was observed. Using Ohm’s Law, we calculated the resistance of rGO sheet (Table 2). Then, we plotted the concentration of biomarkers against the resistance of rGO sheet (Figure 8).
| Resistance (Ohm) | ||
|---|---|---|
| Concentration (nM) | rGO | rGO and aptamer |
| 1.9 | 2.25E+02 | 1.12E+02 |
| 7.8 | 2.24E+02 | 1.87E+02 |
| 15.63 | 2.30E+02 | 1.42E+02 |
| 31.5 | 2.16E+02 | 2.35E+02 |
| 62.5 | 2.16E+02 | 2.14E+02 |
| 125 | 1.53E+02 | 2.28E+03 |
| 250 | 1.90E+02 | 2.89E+02 |
| 500 | 2.22E+02 | 2.89E+02 |
| 1000 | 2.16E+02 | 2.16E+02 |
*-measured as average between pH 4.7 and pH 6 sweat

Figure 8: The resistance of rGO sheet given the concentrations of lactoferrin biomarker.
When lactoferrin aptamer was attached to rGO, we observed the increase in resistance with increasing biomarker concentration until about 400 nM (Figure 8). The data increased monotonically in a range from 50 nM until around 400 nM. Figure 8 also showed that the lowest concentrations of biomarker (1.9 nM - 50 nM) gave resistance values that fell under the curve for the negative control, indicating that the signal was not significant compared to background for the low biomarker range. At biomarker concentrations higher than 400 nM, the resistance decreases again which could be explained by aptamers being saturated with biomarkers. The control showed the flat line, as the resistance values were around the same value for all the biomarker concentrations. This showed that there was not any non-specific binding and that binding occurred only in the presence of an aptamer attached to the electrode.
We hope that future iGEM teams can use our design to make a low-cost device which is sensitive to varying concentrations of analyte. The design did not require many materials and it was easy to assemble all parts. Given that measuring binding between analytes and ligands is important in any biosensing device, any iGEM team working on developing biosensing tools could benefit from using a low-cost potentiostat (Figure 9).

Figure 9: Low-cost potentiostat
References
- Keithley 2450-EC Graphical Potentiostat, 200V, 1A, 20W. https://www.testequipmentdepot.com/keithley/potentiostats/graphical-potentiostat-2450ec.htm?ref=gbase&gclid=Cj0KCQjwqp-LBhDQARIsAO0a6aJJ0ZFiHaB8bpw8MrYq4c7ctYyrXlk6y4t2PJ4CEDjQqfjiby8Yb6oaAlfSEALw_wcB (accessed Oct 21, 2021).
- Low-cost potentiostat. https://www.juami.org/education/low-cost-potentiostat/ (accessed Oct 21, 2021).
- Li, Y. C.; Melenbrink, E. L.; Cordonier, G. J.; Boggs, C.; Khan, A.; Isaac, M. K.; Nkhonjera, L. K.; Bahati, D.; Billinge, S. J.; Haile, S. M.; Kreuter, R. A.; Crable, R. M.; Mallouk, T. E. An Easily Fabricated Low-Cost Potentiostat Coupled with User-Friendly Software for Introducing Students to Electrochemical Reactions AND Electroanalytical Techniques. Journal of Chemical Education 2018, 95 (9), 1658–1661.
- Meloni, G. N. Building a Microcontroller Based Potentiostat: A Inexpensive and Versatile Platform for Teaching Electrochemistry and Instrumentation. Journal of Chemical Education 2016, 93 (7), 1320–1322.
- Aidan. LCD screens and the arduino uno - tutorial. https://core-electronics.com.au/tutorials/use-lcd-arduino-uno.html (accessed Oct 21, 2021).
- https://learn.sparkfun.com/tutorials/basic-character-lcd-hookup-guide/all (accessed Oct 21, 2021). https://learn.sparkfun.com/tutorials/basic-character-lcd-hookup-guide/all (accessed Oct 21, 2021).