Team:NYCU-Taipei/Results

results

Nattokinase Production
Construct Plasmid for Nattokinase Expression
First of all, we extracted the genomic DNA from Bacillus subtilis  natto HS01(a generous gift from Dr. Hsueh).
Fig 1. The result of Bacillus subtilis genomic DNA extraction.
Then, we successfully cloned aprN  from gDNA of Bacillus subtilis  natto HS01 by PCR. At the same time, we added XbaI and XhoI cutting site in front of aprN  and behind aprN , respectively.
Fig 2. The result of nattokinase cloning.
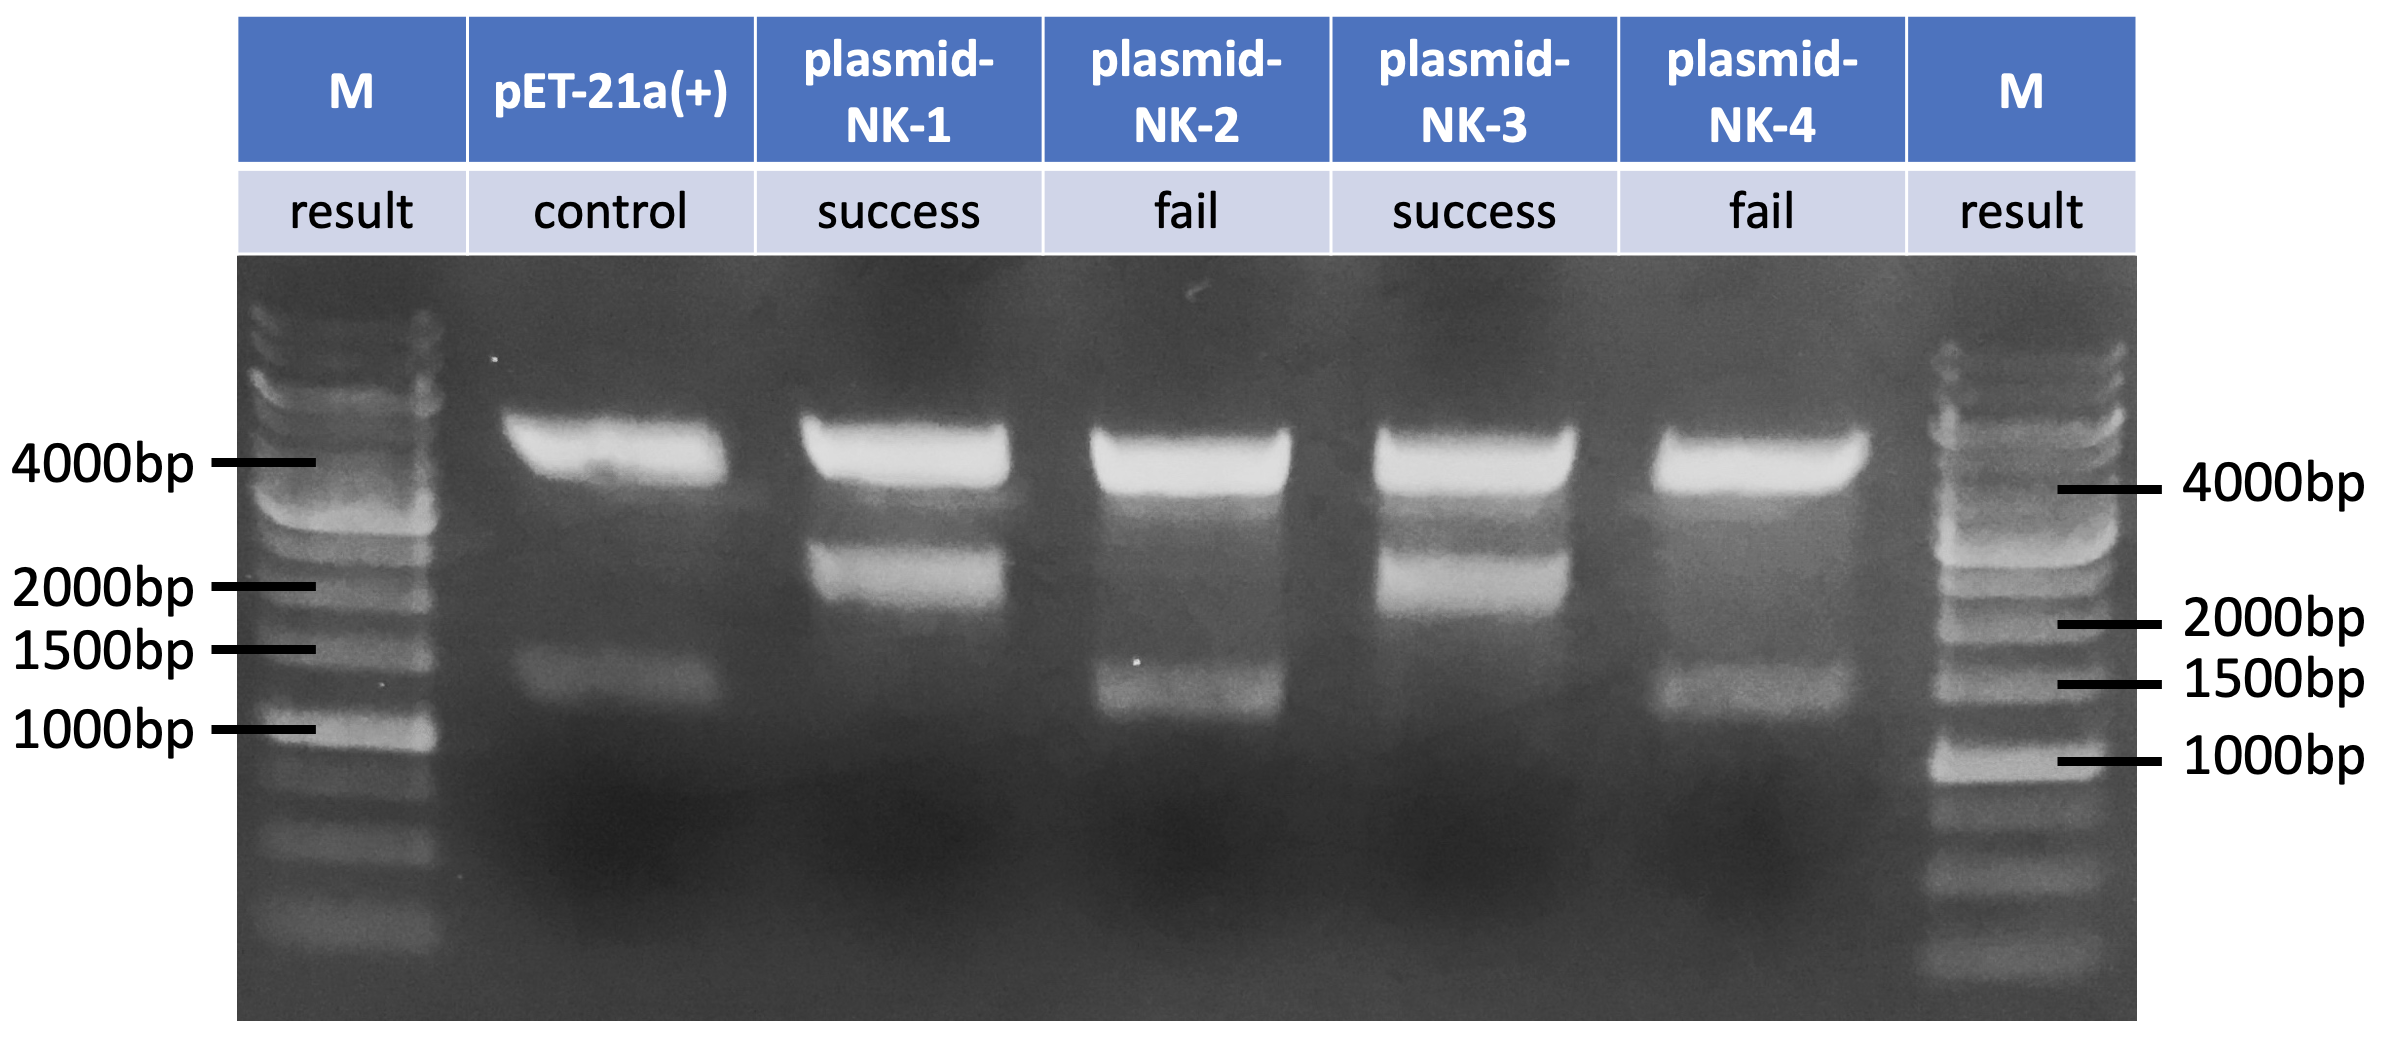
After ligating aprN  PCR product to pET-21a(+), we used NotI/ PstI enzyme digestion to test our construction because there is a NotI cutting site in aprN .
Fig 3. Prediction of plasmid-NK digestion(NotI/PstI).
Fig 4. The result of plasmid-NK confirmation.
Nattokinase Induction and Test
To know whether E. coli  can produce Nattokinase, we transformed the successfully made plasmid-NK construct into E. coli  BL21 cell and treated them with 0.7 mM of IPTG after OD600 of the liquid culture reached 0.6, and measured OD600 every 4 hr throughout the 16 hr induction procedure at 20°C.[1, 2] Next, we checked Nattokinase expression by running SDS-PAGE. We can see there are bands presenting between 25~35 kDa after IPTG induction, and Nattokinase should be around 28 kDa. Thus, there are chances that Nattokinase is successfully expressed.
Fig 5. The SDS-PAGE result of Nattokinase induction.
However, in our fibrin plate assay, no lytic circle was observed after dropping 10 ul medium onto it, which means no Nattokinase activity was detected. This may be due to the expression level in medium was too low to be detected, or our Nattokinase lost its activity somehow. Also, our SDS-PAGE results of Nattokinase purification were not as expected, too.
Fig 6. The result of fibrin plate test.
Due to the limitation of our time, we are still in the troubleshooting process. Here are some experiments we plan to do in the near future:

Gene sequencing
Confirm the sequence of aprN  sequence and 6xHis-tag are as expected. Make sure our Nattokinase will be produced with 6xHis-tag at the C-terminal.

Western blot
Check the presence of Nattokinase with 6xHis-tag by 6xHis-tag antibody.

Adjust purification protocol and expression condition
In the reference, when E. coli expresses Nattokinase at higher temperature (e.g 37°C, 30°C), Nattokinase will prefer to present at about 40 kDa. On the other hand, while expressing at lower temperature (e.g. 15°C, 20°C), it will present at about 28 kDa (mature protein) instead.[2] So, we are going to check the optimized temperature for our Nattokinase secretion. Also, we may try to use different concentrations of IPTG to induce the expression, add PMSF to avoid unwanted protein degradation (however, this way will permanently inactivate Nattokinase), and so on.

Retest activity
If our Nattokinase is secreted into medium successfully, we can measure its activity by fibrin plate assay and spectrophotometric method to know how our Nattokinase expression level and activity is.

References
[1] Liang X, Jia S, Sun Y, Chen M, Chen X, Zhong J, Huan L. Secretory expression of nattokinase from Bacillus subtilis YF38 in Escherichia coli. Mol Biotechnol. 2007 Nov;37(3):187-94. doi: 10.1007/s12033-007-0060-y. Epub 2007 Jul 17. PMID: 17952663.

[2] Jeong SJ, Cho KM, Lee CK, Kim GM, Shin JH, Kim JS, Kim JH. Overexpression of aprE2, a fibrinolytic enzyme gene from Bacillus subtilis CH3-5, in Escherichia coli and the properties of AprE2. J Microbiol Biotechnol. 2014 Jul;24(7):969-78. doi: 10.4014/jmb.1401.01034. PMID: 24743573.

Kill switch result
For more information about our kill switch part, please visit our Parts page.

Result of Design 1

Analysis and Validation of the constructed strains
The RFP expression of Construct 3
We used RFP(E1010) to monitor the expression of TetR, so that we can figure out how L-arabinose will influence the expression of TetR in our Design 1.
Fig 1. The RFP intensity of construct 3 (Pre B3) from 0 hr~ 24 hrs in different L-arabinose concentrations.
Fig 2. After 24 hrs cultivation, the RFP intensity of construct 3 in different L-arabinose concentrations
The RFP expression of Construct 2
Fig 3. The RFP intensity of construct 2 in different L-arabinose concentrations and temperatures.
Fig 4. After 24 hrs cultivation, the RFP intensity of construct 2 in different temperatures.
The comparison between Construct 2 and Construct 3
Fig 5. The RFP intensity of Construct 2 and Construct 3
Discussion
1. The RFP wasn’t expressed under 23°C:
According to Fig.3 & 4, the expression of RFP in Construct 2 is nearly zero at 23°C. According to the mechanism of thermometer RBS, the structure of the thermometer RBS will change under 23°C so the RFP gene behind it couldn’t express[1]. That is to say, the MazE won’t be expressed in Construct 1. Hence, we suppose that our kill switch design will work when the LBP escapes from the human body, achieving safety in the environment.

2. The mechanism of pBad promoter interacting with L-arabinose is much more complicated than what we thought:
According to the RFP expression of Construct 3, the relation between pBad and L-arabinose is complicated. First of all, the RFP intensity is still high when the concentration of L-arabinose is zero. We suggested that it’s because the leakage rate of pBad may be too high. Yet, this is out of our expectation since we initially hope the pBad won’t express when the L-arabinose concentration is low. Secondly, L-arabinose would enhance the expression of pBad when the concentration is not too high. However, once the L-arabinose concentration surpasses 0.025, it inhibits the expression of pBad. After doing some paper research, we suggested that too much L-arabinose interacting with pBad would become a huge barrier for the RNA polymerase to transcript the gene.

3. The result of RFP intensity of Construct 2 is beyond our expectation:
To our expectation, we hope that construct 2 will show fluorescent red. If so, the expression of MazE in construct 1 would be stable. Besides, construct 2 shows fluorescent red when the concentration of L-arabinose rises, but drops again when the concentration of L-arabinose rises to 0.05M. What’s more, the RFP increases sharply as the concentration of L-arabinose surpasses 0.05M.

According to our design, the RFP in construct 2 was directly influenced by the expression of TetR. The RFP expression in construct 3 may stand for the expression of TetR in construct 2. According to Fig 5, we can see that the expression rate of construct 2 is almost zero, but construct 3 has about 1000 RFP intensity. On the other hand, as the expression in construct 3 drops, the expression in construct 2 will rise simultaneously. Hence, it means that the expression ability of pBad in construct 3 would significantly affect our kill switch design 1.

4. Conclusion: The pBad leakage may make our Design 1 unusable
Since the pBad expression didn’t function as we expected, we considered the Design 1 inappropriate to serve as our kill switch design. In the meantime, we analyzed the Design 1 system through modeling, which turned out to be the same results. Please see our project Model model page for more information. Therefore, we constructed Design 2 for our new design.


Molecular engineering for Kill Switch Design 2

Analysis and Validation of the constructed strains
The RFP expression of Pre C1 and Pre C2
Fig 6. The RFP intensity of Pre C1 and Pre C2 after 24 hr cultivation.
According to the figure, we found that Pre C2 is hardly induced by L-arabinose and the endogenous expression rate of Pre C2 is very low. On the other hand, the expression rate of Pre C1 is great when L-arabinose is added. This experiment is conducted by our collaboration partner, 2021 TAS_Taipei. For more information, please visit our Collaborations page.

The RFP expression of Pre C1 compared with other 5 tandem promoters constructed by Strategy 3
Fig 7. The RFP intensity of tandem promoters.
According to the figures, when the concentration of L-arabinose is 0 M, the order of the expression rate of these tandem promoters is the same as that of the constitutive promoter individually. Besides, when the concentration of L-arabinose rises from 0 M to 0.025 M, the expression of RFP under the regulation of pJ102, pJ118, and pJ110 decreases while others rise. Interestingly, among these six tandem promoters, only the Pre C1 will be induced by L-arabinose significantly.

Discussion
1. The expression of Pre C1 and Pre C2 is significantly different:
The mechanism of L-arabinose regulating pBad is that L-arabinose will bind and change the pBad inhibitor araC into an inducer [2]. We suggest that the formation of L-arabinose-araC-pBad may be a huge barrier for RNA polymerase to transcribe the gene. Hence, when the pBad is constructed behind the constitutive promoter J23106, the RNA polymerase will be hard to function J23106 because there is a L-arabinose-araC-pBad complex located behind it.

2. The tandem promoter with relatively strong constitutive promoter will be inhibited as the L-arabinose increases:
Those tandem promoters with strong constitutive promoters like pJ102, pJ118 and pJ110 have a better expression rate when there is no L-arabinose. We suggest that it’s still the L-arabinose-araC-pBad complex which serves as a barrier. Even though L-arabinose may enhance the expression of pBad, the interference of the transcription by the L-arabinose-araC-pBad complex plays an more important role.

3. Pre C1 and the other tandem promoters constructed through strategy 3 have similar components but have quite different RFP expression characteristics:
The constitutive promoter J23106 in Pre C1 is from the same constitutive promoter family as others. Also, the strength of J23106 ranks in the middle among others. Besides, the structure of sequence behind these different tandem promoters is identical. The only difference is that Pre C1 is constructed in pSB1A2, while the others are constructed in pSB1C3. We suggest it is the difference of plasmid backbones that lead to different results. Hence, we are going to transfer these tandem promoters into pSB1A2 to see if these tandem promoters will have different results.

4. To implement kill switch design 2
To make design 2 come true, we should choose the promoter before MazE wisely. According to the result of the RFP expression of each tandem promoter, there are some pBad tandem promoters whose RFP expression ability will drop as the concentration of L-arabinose increases such as pJ102, pJ118, pJ110, which are all with strong constitutive promoters. Here we take pJ102 for example. We can construct pJ102 before MazE while Pre C1 before MazF. Under this design, in general, the expression of MazE will be higher than MazF, since when the concentration of L-arabinose is zero, the RFP expression of pJ102 is better than that of Pre C1. When the L-arabinose concentration increases, the expression rate of pJ102 will drop while that of Pre C1 will increase simultaneously. As the MazF surpasses MazE, the killing system will turn on and achieve the kill switch.

Fig 8. Our final kill switch design
References
[1] Narberhaus, F., Waldminghaus, T., & Chowdhury, S. (2006). RNA thermometers. FEMS microbiology reviews, 30(1), 3–16. https://doi.org/10.1111/j.1574-6976.2005.004.x

[2] Lee, N. L., Gielow, W. O., & Wallace, R. G. (1981). Mechanism of araC autoregulation and the domains of two overlapping promoters, Pc and PBAD, in the L-arabinose regulatory region of Escherichia coli. Proceedings of the National Academy of Sciences of the United States of America, 78(2), 752–756.
Oral Delivery system
Freeze-drying (lyophilization)
Results
From Fig1, results showed that freeze-dried EcN in the presence of our protective medium can survive from harsh conditions during freeze-drying; whereas the freezing in the presence of 0.9% NaCl resulted in no viable EcN after freeze. Besides, the survival rate remained stable after 48 hours and 4 days of storage at 4°C, with the rate of 58.5% and 41.68% respectively. From Fig2, we compared the viability of bacteria storage at 4°C and 27°C. Both conditions show similar results. After 4 days of storage at 27°C, freeze-dried EcN still showed the survival rate of 43.3%. Freeze-drying in the presence of a protective medium ensures that our bacteria are still viable after lyophilization for storage at either 4°C or 27°C. The survival rate was calculated as the percentage ratio of viable cells after freeze-drying to viable cells before freeze-drying.


Statistical analysis and conclusion
All experiments were carried out in triplicate. The difference between two means before and after freeze-drying was calculated using the t-test.

In conclusion, we evaluated the impact of freeze drying on the bacterial viability using 0.9% NaCl as a control. We suppose that freeze drying (lyophilization) is harmful to EcN. Although we didn’t reach the expected viability as the references, using the protective medium as cryoprotectants is still a good alternative to protect E. coli  Nissle 1917 during freeze drying. We realized that conditions for freeze drying and freeze dryers’ differences are also factors resulting in different viability after lyophilization. We hope that our engineered bacteria which can secrete Nattokinase can be freeze-dried for storage and then loaded into capsules to become commercial dietary supplements in the future.


Capsule option: BioVXR® Acid-Resistant Capsule
According to Fig4 provided by DFC, after 120 minutes of the pH1.2 environment, the dissolution rate of BioVXR® is lower than 10%, which has protection for ingredients. After 45 minutes of the pH6.8 environment, the dissolution rate of BioVXR® reached 89.18%. BioVXR® shows good acid resistance ability and dissolutes quickly at pH 6.8.BioVXR® Acid-Resistant Capsules can protect acid-vulnerable ingredients from gastric acid and release in the intestinal tract, which is an ideal choice for the delivery of our EcN to the small intestine. We are grateful and honored to be sponsored by the most leading and finest capsule manufacturing company, Dah Feng Capsule (DFC), in Taiwan. For more information, please visit: Dah Feng Capsule-DFC
Note:
1. The graphs are provided by Dah Feng Capsule (DFC)
2. BioVXR® Acid Resistant Capsules are sponsored by Dah Feng Capsule (DFC)

References
[1] Mawad, A., Helmy, Y.A., Shalkami, AG. et al. E. coli Nissle microencapsulation in alginate-chitosan nanoparticles and its effect on Campylobacter jejuni in vitro. Appl Microbiol Biotechnol 102, 10675–10690 (2018)

[2] Dah Feng Capsule (DFC) website: https://www.dfc.com.tw/

[3] Bellali S, Bou Khalil J, Fontanini A, Raoult D, Lagier JC. A new protectant medium preserving bacterial viability after freeze drying. Microbiol Res. (2020)

Remote control
E.coli MG1655 gDNA extraction and LexA cloning
We successfully extracted the genomic DNA of E.coli MG1655 and then used it as template for LexA cloning.
Fig 1. E.coli K12 MG1655 genomic DNA extraction (M: lamba HindIII; 1: gDNA sample 1; 2: 0.5xgDNA sample-1; 3: gDNA sample-2; 4: 0.5xgDNA sample 2)
Fig 2. LexA cloning (M: 100bp marker; 1-6: LexA cloning sample 1-6 ; the lightest bands of the cloning samples cooperate to size of 600bp approximately.)
BphP1 and QPAS1 cloning
We successfully cloned BphP1 and QPAS1 from template pKA-207I10 ordered from Addgene.
Fig 3. QPAS1 cloning (M: 100bp marker; 1-10: QPAS1 cloning sample 1-10 ; the lightest bands of the cloning samples cooperate to size of 400bp-500bp approximately.)
Fig 4. BphP1 cloning (M: 1000bp marker; 1 and 2: Bphp1 cloning sample 1 and 2 ; the lightest bands of the cloning samples cooperate to size of 2000bp approximately.)
Plasmid construction and functional test
Currently, we successfully constructed most of the plasmid we design for the optogenetics system. However, due to time limitations, we did not finish the functional tests of these plasmids we constructed.

Adhesive protein
Overview (Experimental Design)
OmpA-FimH fusion protein connected by GS flexible linker was designed hopefully to bring FimH, the adhesive protein, to the outer membrane of our E. coli  host with OmpA transmembrane protein. (See link for our design)

The adhesive protein part consists of two major experiments.
  • FimH expression test under body temperature
  • OmpA fusion protein mobility test.

  • Experiment results & proof of concept
    Cloning PCR of targeted DNA and restriction site addition
    Fig 1. Cloning PCR of our targeted DNA.
    1. Cloning PCR of FimH aa 22~300 from E. coli  BL21 genomic DNA
    Fig 2. DNA electrophoresis result of PCR of FimH aa 22~300 from E. coli  gDNA. NdeI and XhoI cutting sites were added from primer to 5’ and 3’ end respectively.
    2. Cloning PCR of OmpA from E. coli  BL21 genomic DNA
    Fig 3. DNA electrophoresis result of PCR of OmpA from E. coli  gDNA.NdeI and XbaI cutting sites were added from primer to 5’ and 3’ end respectively.
    3. Cloning PCR of GFP from iGEM part BBa_E0040
    Fig 4. DNA electrophoresis result of PCR of GFP from BBa_E0040. XbaI and XhoI cutting sites were added from primer to 5’ and 3’ end respectively.
    Enzyme digestion and ligation of targeting constructs
    Enzyme digestions were carried out on gel extracted linear PCR products to their corresponding digestion sites shown in the following graph.
    Fig 5. Cloning of our targeted constructs.
    Ligation of the inserts to pET21a+ by T4 ligase finally succeeded after several attempts. See notebook and protocolfor detailed description.
    Fig 6. DNA electrophoresis result of FimH-pET21a ligation product and NdeI / XhoI enzyme digestion check. A respected 952 bps releasement were observed.
    FimH protein induction test
    To make sure FimH protein can be induced under body temperature, we transformed the successfully made FimH-pET21a+ construct into E. coli  BL21 cell and treated them with 0.25, 0.5, 1.0, 2.0 mM of IPTG after OD600 of the liquid culture reached 0.4, and sample every one hour through the 4 hours induction procedure of FimH protein at 37°C.
    Fig 7. SDS page result of FimH protein induction.
    Authored and maintained by Team NYCU-Taipei 2021.