Team:NUS Singapore/Model
Model
Overview
Modelling played a pivotal role in shaping our iGEM project. We leveraged on modelling to gain a better understanding of the various systems, optimize the circuitry design, and guide the direction of the overall project. The data collected by experimental characterization was subsequently used to generate predictive equations and estimate the parameters in our model. We primarily designed 3 models that allowed us to:
- Rationalize and Optimize the Blue-Light Activation
- Rationalize the Dynamics of the Flocculation
- Estimate time taken for 99% flocculation in our bioreactor
The results obtained from modelling have greatly assisted the DBTL process. Specifically, they have assisted the Wet Lab Team in the optimisation of the Blue-Light System and has directed the hardware design
In the absence of light, the EL222 proteins remain as a single subunit. However, upon exposure to blue light, the EL222 subunits change their conformation, exposing both a LOV domain and a helix turn helix domain. This conformation change allows the EL222 to form homodimers that bind to a target C120 sequence, bringing the activation domain in close proximity and activating downstream transcription.
Figure 1. Light inducible system for the mRNA of mKO (orange fluorescence).
We attempted to model the inducible blue light system to reveal its mechanistic kinetics as illustrated in Figure 1. Subsequently, we utilized the fitted curve to suggest and explore possible improvements to the blue-light activated expression system.
Next, based on the curve fitting result, we analyze how to improve the expression of the system under blue light activation.
Method and Model
Optical Density (OD) and fluorescence data were obtained from the experiments conducted by the Wet Lab. A model was then fit and analyzed using Python lmfit and Salib libraries. To generate enough data points for the curve fitting process and further understand the effect of the light-duty cycle on the activation of the C120 promoter, we performed the following investigative experiments:
- Blue Light Off for 6hrs
- Blue Light On for 6hrs
- Blue Light Toggled On/Off every 30min for 6 hours
To simulate the light pattern, we initially used a stepwise function with 0 and 1 representing the off and on states. However, the discontinuity of the light function radically affected the result of the simulation. Therefore, we decided to choose a ‘soft’ stepwise function to allow better continuity. The soft stepwise function utilizes the idea of sigmoid functions:

Figure 2. Comparison of light pattern using stepwise function and soft stepwise function.
To simplify our model, we made a few assumptions:
- The initial concentration of dimerized EL222 (EL222*) is 0
- The concentration of EL222 monomers (EL222total) is constant (10000 a.u, scaled based on experimental data)
- The initial concentration of mKO mRNA is 0
- The initial concentration of mKO is 0
The following 9 factors were accounted for while modelling the inducible system:
- kdim = The rate of EL222 dimerization
- kund = The rate of EL222 undimerization
- basC120 = The basal transcription rate of C120
- synC120 = The max transcription rate of C120
- nEL222 = The Hill coefficient for the promoter bound EL222 dimers
- KEL222 = The concentration of EL222 dimers at which half of maximum transcription rate is reached
- degmRNA = The rate of mRNA degradation
- synpro = The rate of translation
- degpro = The rate of mKO degradation
The system of differential equations is:

Result
The fitting was done using the Basin-hopping algorithm to find the global minima. The model exhibited a good fit to the experimental data (Figure 3).
Figure 3. Result of curve fitting to the blue light induction data.
| Parameter | Optimized Value | Unit |
|---|---|---|
| kdim | 0.014 | AU FU-1 hr-1 |
| kund | 0.034 | hr-1 |
| basC120 | 0.1 | FU AU-1 hr-1 |
| synC120 | 28.732 | FU AU-1 hr-1 |
| nEL222 | 1.103 | |
| KEL222 | 300.089 | FU AU-1 |
| degmRNA | 3.746 | hr-1 |
| synpro | 54.766 | hr-1 |
| degpro | 0.141 | hr-1 |
Next, we performed a sensitivity test within the range of 10% of the original values (Figure 4). The result showed that KEL222 is the most sensitive variable, followed by protein translation, protein degradation rate, mRNA degradation rate, maximum transcription rate, and the Hill coefficient. Therefore, we decided to improve KEL222 and possibly the Hill coefficient nEL222. We hypothesize that, by increasing the number of repeats of the C120 domain, the sensitivity of the inducible promoter will increase and these two parameters may be improved for better expression.
Figure 4. Result of sensitivity analysis of blue light system model.
Based on this result, the Wet Lab team constructed a new strain of Yeast with 3 repeats of the C120 domain (3C120-CYCp mko). The experimental protocol for curve fitting was repeated for the new strain. Except that this time only KEL222 and nEL222 were fitted, other parameters were kept at their values established from the previous curve fitting result. The curve fitting of 3C120-CYCp mKO showed a great fit to experimental data (Figure 5), implying that the effect of increasing the number of C120s on other parameters is negligible. Furthermore, the max fluorescence/OD value of the 3C120-CYCp in the presence of 6hrs of blue-light, exhibited a 20% increase when compared to the max fluorescence/OD value of EL222 for the same curve.
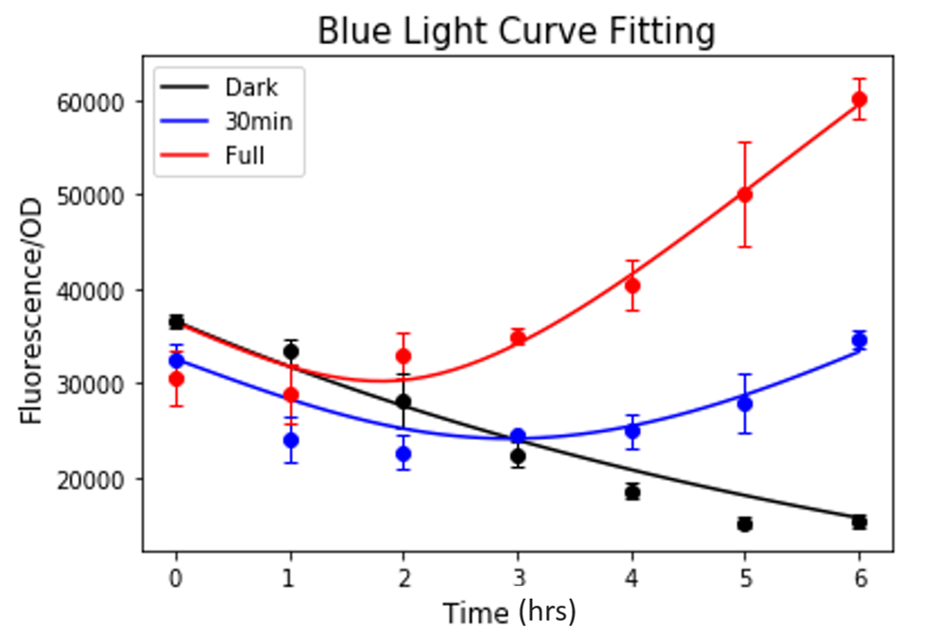
Figure 5. Result of curve fitting to the blue light induction for 3C120-CYCp mKO strain.
Subsequently, we compared the KEL222 and nEL222 values between the old and new strains. We found a clear improvement of both parameters in the new strain with 3 C120 repeats. The KEL222 value decreased 3-fold and the nEL222 value increased almost 8-fold.
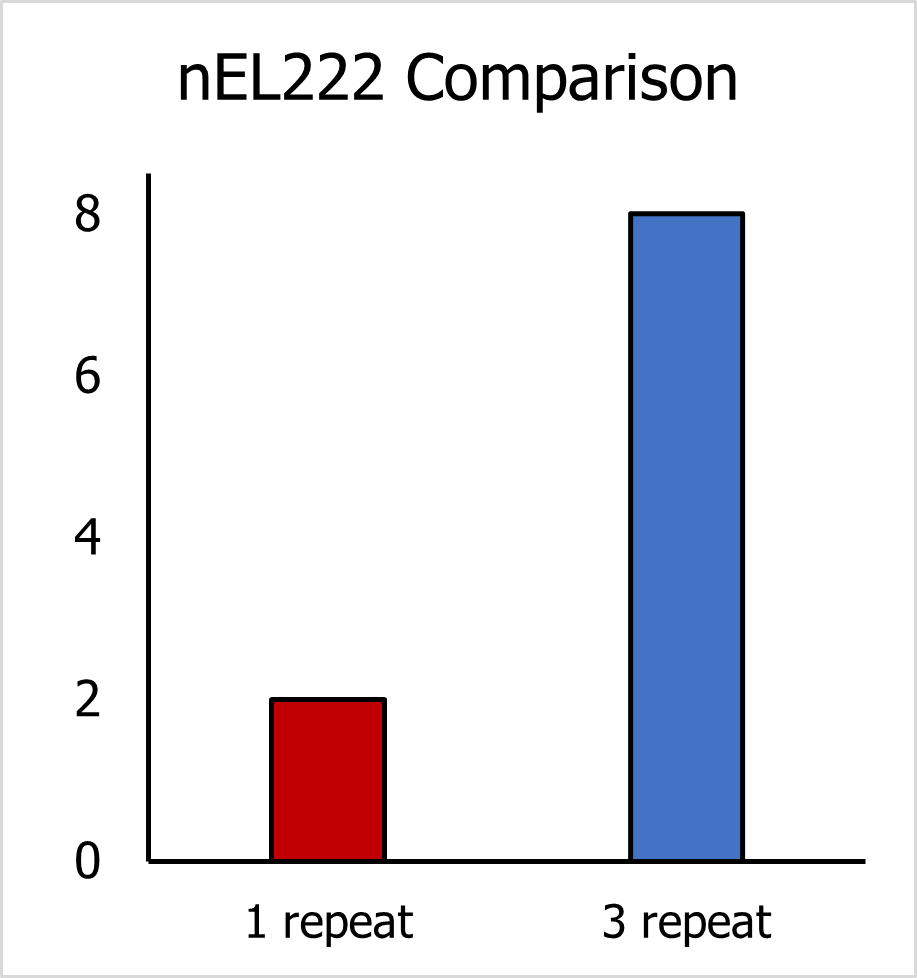
Figure 6.1. Comparison of nEL222 between 2 yeast strains.
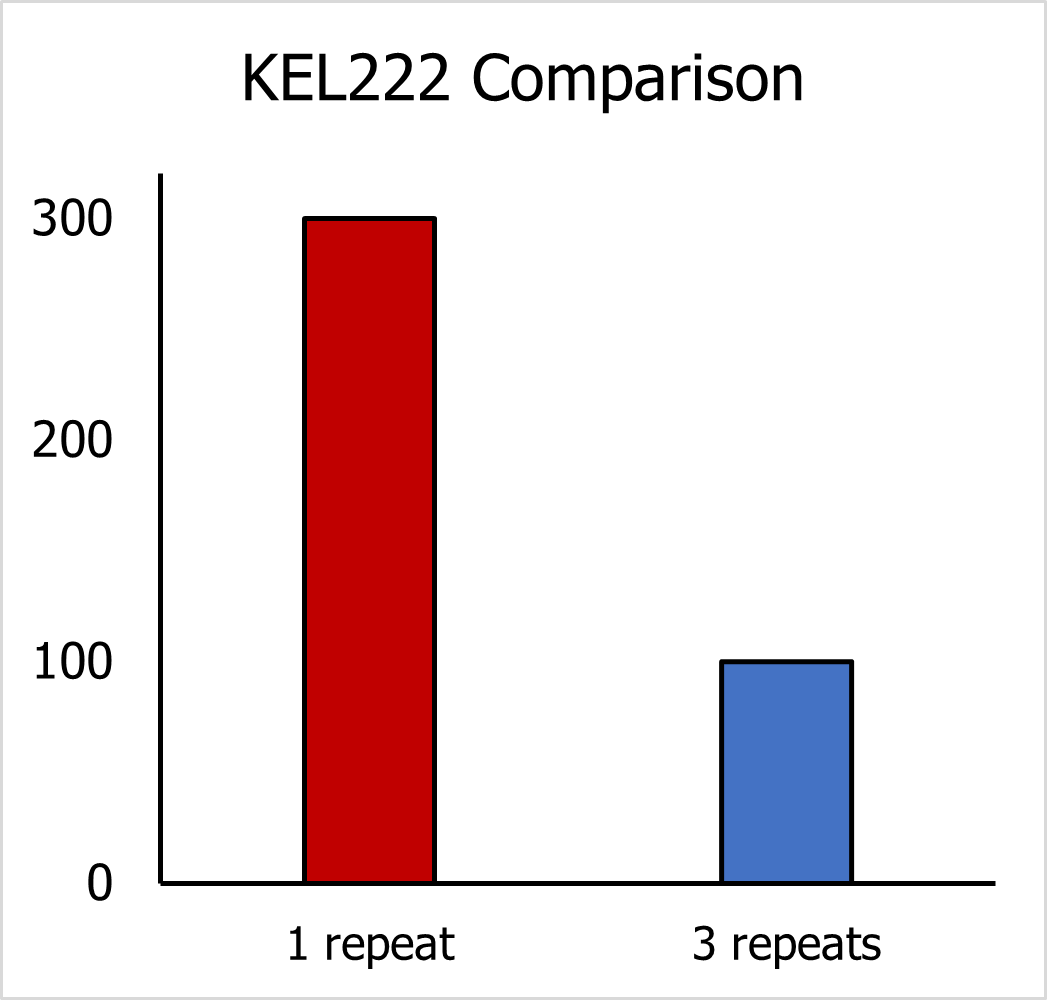
Figure 6.2. Comparison of KEL222 between 2 yeast strains.
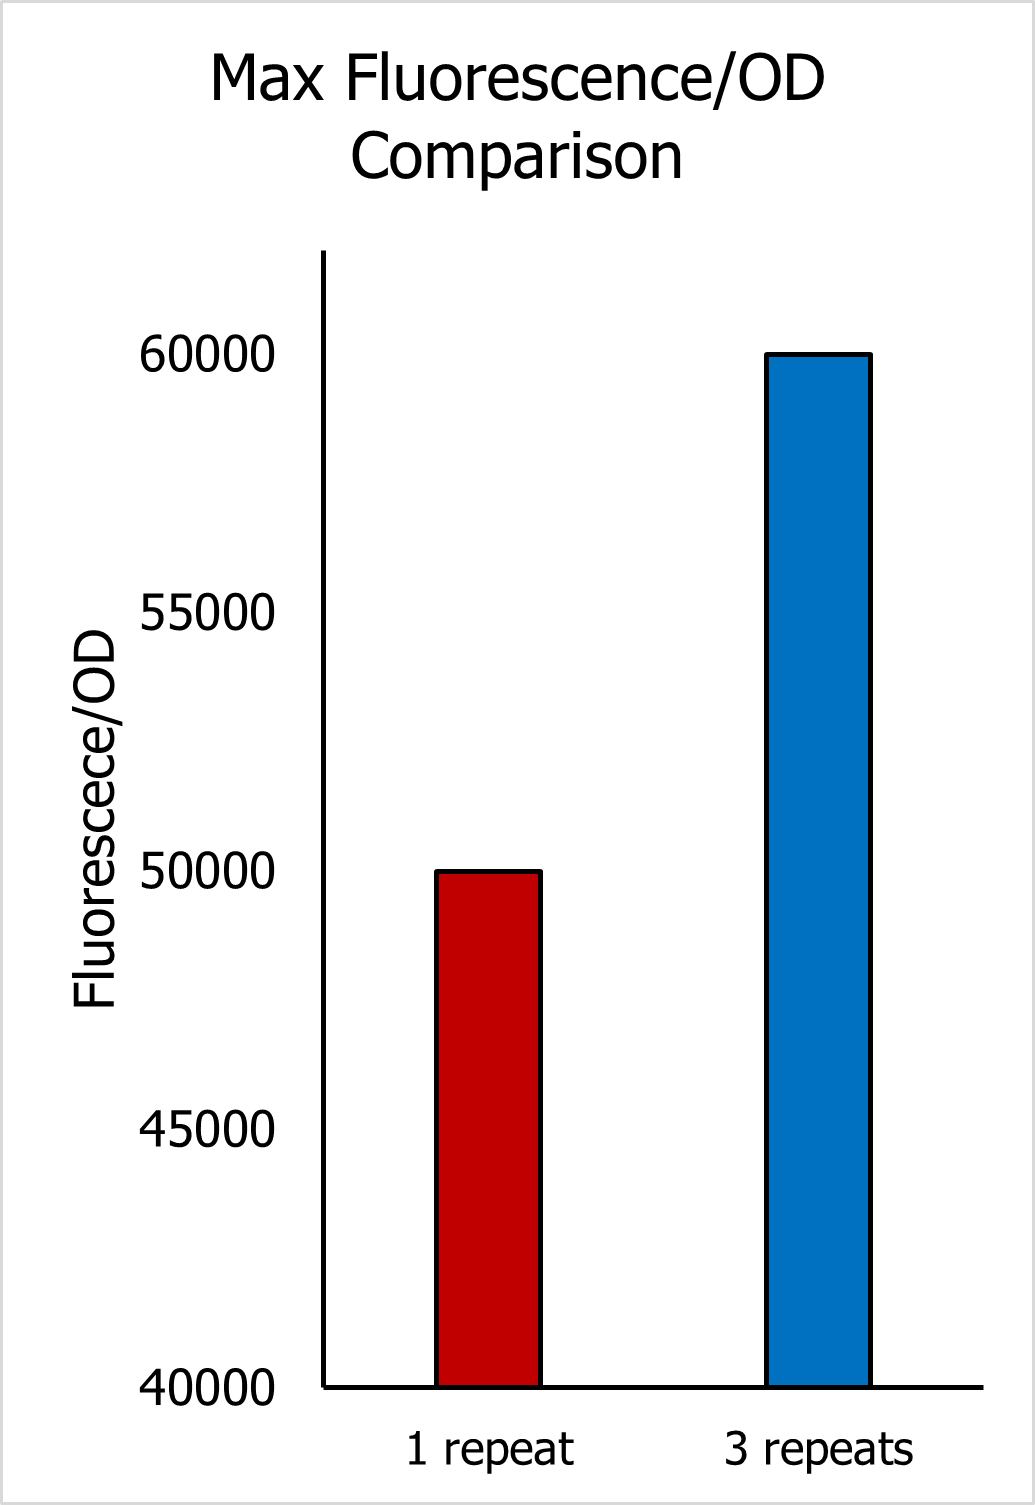
Figure 6.3. Comparison of Max Fluorescence/OD between 2 yeast strains.
Conclusion
The inducible systems can be modelled accurately using the nine mentioned parameters. The sensitivity results helped the wet lab to improve the expression induction by increasing the number of C120 repeats. Although the model exhibited a good fit, calibration of the protein concentration based on the fluorescence/OD data could have been performed. This would allow for the conversion of the units from fluorescence/OD to molar concentration and further allow us to validate our data by comparing it with other published results.
Reference
[1] D. Benzinger and M. Khammash, “Tuning gene expression variability and multi-gene regulation by dynamic transcription factor control,” 2018.
[2] P. Jayaraman, K. Devarajan, T. K. Chua, H. Zhang, E. Gunawan, and C. L. Poh, “Blue light-mediated transcriptional activation and repression of gene expression in bacteria,” Nucleic Acids Research, vol. 44, no. 14, pp. 6994–7005, 2016.
Model Development
Modelling flocculation is challenging! Flocculation is a complex dynamic process, where the cell surface properties, buoyancy of the cell, and physical agitation (shaking/stirring) play a significant role in determining the kinetics of the overall process. Three kinetic processes happen during flocculation:
- Perikinetic flocculation – Random Brownian motion of cell particles
- Orthokinetic flocculation – Power input due to external mixing
- Sedimentation due to gravitation
Most flocculation papers attempt to model the sequential forming and breaking of flocs of varying sizes, often resulting in a complex model with a vast number of differential equations and a high computational cost [1]. Furthermore, curve fitting for these models often requires an extensive amount of experimental data and expensive hardware, such as cell counting equipment. Other models approach this problem by differentially classifying flocculated and single cells and predicting their dynamics using simple exponential models [2]. This approach, although simplifies the flocculation models to a great extent, fails to capture the dynamics of floc of different sizes. Consequently, our goal for this iGEM was to establish a new model for flocculation that took the best of both worlds: A model that is not only computationally inexpensive but also easy to verify via OD measurement using only a spectrophotometer.
Our protocol to quantify flocculation was to measure the supernatant OD after 2 minutes of resting. Applying the Stokes law of sedimentation, we can calculate the distance that each floc size has travelled due to sedimentation:

Here ρ denotes density, μ is media viscosity, g is gravitational acceleration, di is the number of cells inside one floc (floc size).
We assumed that flocs have a spherical shape with their diameter being proportionate to the number of cells inside each floc. For media of height 1 cm, almost every floc above size 3 cells sank to the bottom of the flask after 2 minutes. A similar result was seen for flocs with a size 5 cells in 2 cm of media. Therefore, we hypothesize that in almost every case, the upper bound of the size of the flocs retained in the supernatant is 5 cells.
Since each floc size contributes differently to the overall OD, the OD of supernatant is a summation of multiple factors:

Here, N is the total number of cells/flocs inside the flask. Si is the ratio of the flocs of a size di, with the contribution to each floc size being proportional to its square. α is the conversion ratio. From the work of Hamersveld et al. (1997) [3], we can assume the floc size has a log-normal distribution. The cumulative distribution function (CDF) of log-normal distribution has the form:

Where μ is the mean floc size, σ is standard deviation, and erf() is the Gauss error function:

Therefore,

Thus, the change in OD due to growth and flocculation is:

where the change of cell numbers follows traditional Monod kinetics and depends on the concentration of carbon source [G].
Based on the definition of erf() function, the derivative of Si w.r.t mean floc size is:

Here, we assume that the mean floc size shifts from 1 cell to higher values due to flocculation, and the maximal floc size is limited due to breakage and cell loss. The increase in the mean size of flocs depends on the expression of FLO1 protein:

Therefore, the finalized equation for OD is:

Other equations in the system include the expression of FLO1 and the decrease of carbon source over time. The decrease of carbon source is dependent on the number of cells:

Our yeast expresses FLO1 under the control of a GAL promoter. Despite the metabolic flux complexity of galactose, and the sequential activation/inhibition of GAL promoter by many transcription factors, we decided to consider GAL promoter as a constitutive promoter, where the expression of mRNA reaches a quasi-steady state.

Method and Model
The supernatant OD data was taken from the Wet Lab Team. Post induction, and after 2 mins of resting to facilitate sedimentation, the OD of the supernatant was measured every hour. The model was fitted and analyzed using Python lmfit library.
The following factors were accounted for when modelling gal – induced flocculation:
- synFLO1 = The synthesis rate of FLO1 protein
- KG_FLO1 = The concentration of galactose at which half of maximum transcription rate is reached
- degFLO1 = The degradation rate of FLO1 protein
- c = Arbitrary constant, relating to the rate of carbon source consumption
- KG = The Monod constant
- m = Arbitrary constant, relating to the rate of increase of mean floc size
- r = The maximal growth rate in Monod’s model
- μmax = The maximal mean floc size
- σ = The standard deviation of floc size
The overall system of differential equations is:

The r-value for S. cerevisae can be found in published literature and was unchanged in our model[4]. Other parameters were allowed to vary during the curve fitting process. Since we are using molar concentration, the synthesis and degradation rate of the FLO1 gene can be compared to the literature reported average values of yeast proteins. Furthermore, we had to limit the maximal value of mean flow size to 25, to ensure our result does not exceed the maximum positive float value of Python.
Result
The model exhibited a good fit to the experimental data (Figure 7). The value of degFLO1 (0.65 hr-1) is comparable to the median half-life of yeast proteins (43 minutes) [5].
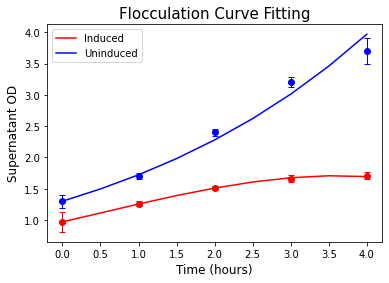
Figure 7. Curve fitting result for the flocculation induced by Galactose.
| Parameter | Optimized Value | Unit |
|---|---|---|
| synFLO1 | 0.96 | M hr-1 |
| KG_FLO1 | 14 | mM |
| degFLO1 | 0.65 | hr-1 |
| c | 0.075 | M-1 hr-1 |
| KG | 0.2 | mM |
| m | 0.342 | M-1 hr-1 |
| r | 0.31 [4] | hr-1 |
| μmax | 16.3 | |
| σ | 1.02 |
Next, we validated our model by performing the flocculation experiment from a high OD value solution with Yeast in the stationary phase. After culturing the yeast overnight, we changed the media from YPD to YPGR containing galactose to induce flocculation. The time scale of yeast re-growth was less than the time scale of flocculation. Therefore, in our model, we omitted the growth term of the OD equation. The result showed a good agreement between our simulation using fitted parameters and experimental data (Figure 8).
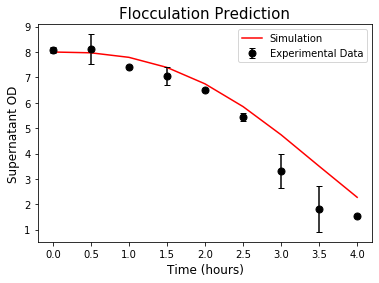
Figure 8. Prediction of flocculation induced by Galactose at high OD.
Reference
[1] D. Thomas, S. Judd, and N. Fawcett, “Flocculation modelling: a review,” Water Research, vol. 33, no. 7, pp. 1579–1592, 1999.
[2] R. Fekih-Salem, J. Harmand, C. Lobry, A. Rapaport, and T. Sari, “Extensions of the chemostat model with flocculation,” Journal of Mathematical Analysis and Applications, vol. 397, no. 1, pp. 292–306, 2013.
[3] E. H. V. Hamersveld, R. G. J. M. Van Der Lans, and K. C. A. M. Luyben, “Quantification of brewers yeast flocculation in a stirred tank: Effect of physical parameters on flocculation,” Biotechnology and Bioengineering, vol. 56, no. 2, pp. 190–200, 1997.
[4] K. Elbing, C. Larsson, R. M. Bill, E. Albers, J. L. Snoep, E. Boles, S. Hohmann, and L. Gustafsson, “Role of Hexose Transport in Control of Glycolytic Flux in Saccharomyces cerevisiae,” Applied and Environmental Microbiology, vol. 70, no. 9, pp. 5323–5330, 2004.
[5] A. Belle, A. Tanay, L. Bitincka, R. Shamir, and E. K. Oshea, “Quantification of protein half-lives in the budding yeast proteome,” Proceedings of the National Academy of Sciences, vol. 103, no. 35, pp. 13004–13009, 2006.
Having established the models for the blue light system and flocculation, we finalized our modelling by combining two systems of ODEs. Due to our assumption that the effect of FLO1 does not affect the intrinsic growth rate, we chose the experiment with the blue light on full-time to avoid the utilization of soft step-wise function:

It is worth noting that the units of the two systems are different, and they are linked by the FLO1 protein. Therefore, further curve fitting must be performed as:
- The transcription and the degradation rate of FLO1 mRNA, as well as the translation and the degradation rate of FLO1 protein are different from mKO. For simplicity, we assumed their transcription and mRNA degradation rates are comparable and only performed curve fitting to the translation and protein degradation rate.
- Adjustment to the value of parameter m must be made to convert the units of the first system to the second system.
The same protocol for flocculation quantification was used for the blue light-induced system. The model was then fitted and analyzed using Python lmfit library. The result showed a good fit to the experimental data, thus the model can be used easily for predicting flocculation time in our bioreactor.
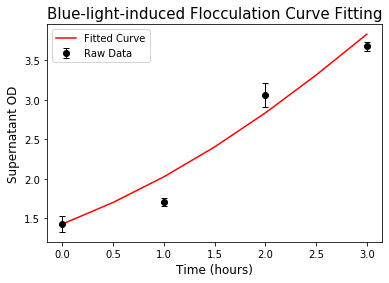
Figure 9. Curve fitting result for the flocculation induced by blue light.
| Parameter | Optimized Value | Unit |
|---|---|---|
| synFLO1 | 2.849 | hr-1 |
| degFLO1 | 0.21 | hr-1 |
| m | 0.012 | AU FU-1 hr-1 |
Application for Hardware
In our real application, flocculation happens at the late stationary phase after the desired biopesticide was produced. In this case, growth due to the remaining carbon source is negligible, thus we can omit the growth term in the system of ODEs and make predictions about the time it takes to flocculate 99% of the yeast. The result shows that, from initial OD = 10, the 99% flocculation takes around 9 hours for the strain with one C120 repeat (C120-CYCp) and 4 hours with three C120 repeats (3C120-CYCp).

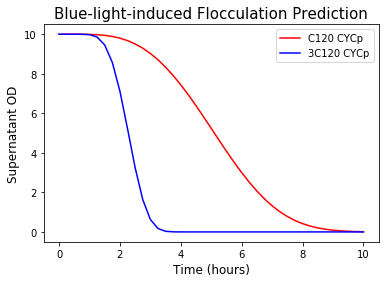
Figure 10. Prediction of supernatant OD during blue-light-induced flocculation.
This is our final goal! By working with the blue light system and flocculation separately then combining the models, we can give the users the estimated time of collection of the desired biopesticide after blue light is turned on in our HERO bioreactor. (See our Hardware page for more details) Therefore, this simulation can be incorporated into the coding of the device to give direct user advice for biopesticide collection time.