Team:IISER Bhopal/Results
Results
Wetlab Results
Due to Covid-19 restrictions, we had delayed lab access. We started our main lab work by the end of September 2021, when our ordered gene constructs arrived. So, we have only done the characterization of the Holin-Antiholin Kill Switch from the lab. Although we were successful in inserting other gene cassettes into E. Coli, we were unable to do its characterization and the cell line studies due to time limitations.
Preparation of Competent and & Ultracompetent E.Coli
Competent DH5-α & BL-21(DE3)-By Hanahan method (CaCl2)


Fig. 1:i) DH5-α competent cell efficiency check by transforming with pUC19 plasmid, plated in 100µl Ampicillin.
ii)Comparison of the pUC19 transformed bacteria ampicillin plates with no Antibiotic control.
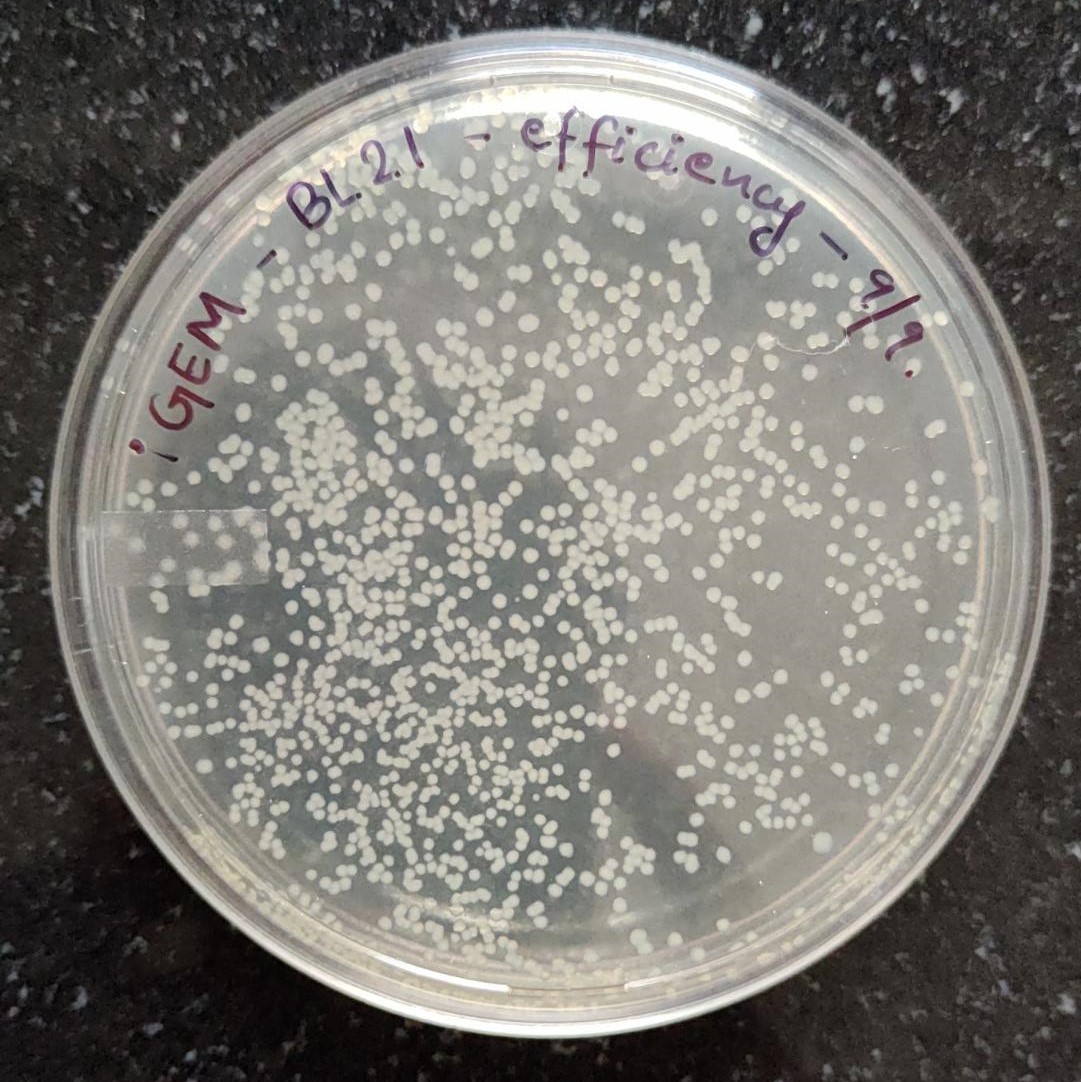
Fig. 2: i) BL-21(DE3) competent cells efficiency check by transformation with pUC19, plated in 100µg/mL Ampicillin.
Ultracompetent DH5-α by Inoue Method

Fig.3: Ultracompetent DH5-α check-i)Ultracompetent DH5𝛂 transformed with 100 ng pUC19, plated in 100 µg/ml Ampicillin Plates ii)Transformation with 100 pg pUC19, plated in 100µg/ml Ampicillin Plates iii)No Antibiotic Control (No pUC19).
PCR, RESTRICTION DIGESTION & LIGATION OF THE CONSTRUCTS
1) PCR Amplification of Constructs

Fig. 4:Gel Electrophoresis image of the PCR Amplified Gene constructs. From Right: i)1 kb ladder ii) TRAIL-Smac Fusion Construct iii)AND Gate Reporter iv)LldP
v)LldR vi)Antiholin construct vii)Holin viii)1 kb ladder
2) Restriction digestion of the Constructs

Fig. 5:Restriction digestion of each construct (From left to right)-i)pUC19 plasmid with pst1 and Xba 1 (2.6kb) ii)Trail-Smac fusion peptide with pst1 and xba1 (1.3kb) iii)LldP construct by Xba1 (1.7 kb) iv)AND Gate Reporter construct with pst1 and xba1 (1.3 kb)
v)LldR construct by Xba1 (0.9 kb) vi)Antiholin-Lamda Repressor construct by Pst1 (1.4kb) vii) Holin-Endolysin construct: by Pst1 (1.4 kb)
3) Ligation of each unit

Fig. 6:From left to right- i)TRAIL-Smac fusion protein:Ligation of TRAIL-Smac FP (1.3kb) into pUC 19 plasmid (2.6kb ) [D+pUC].3.9kb ligated band is visible. ii)AND Gate:Ligation of the AND gate reporter(1.3kb) into pUC19 plasmid (2.6kb ) [F+pUC]. 3.9kb ligated band is visible.
iii)LldP-R:Ligation of LldP (1.7kb ) with LldR (0.9kb)=2.6kb. This band was not visible. iv)Kill Switch unit: Ligation of Holin-Endolysin (1.4kb) with Antiholin-Lamda Repressor (1.4kb) = 2.8kb. The ligated band is visible.
Resuts
Ligation of TRAIL-Smac Fusion Protein+pUC, AND gate reporter +pUC and Kill Switch became successful. Ligation of LldP-R was not successful.


Fig. 7:i)LEFT:Re-ligation of LldP-LldR and Kill switch. We got the desired band (2.6kb for LldP-R and 2.8kb for Kill Switch). ii)RIGHT: Ligation of Kill Switch (2.8kb) into pMB1 (3kb) through Sal1 and Xho1 sites. We got the ligated Kill Switch +pMB1 (5.8kb band ) in well 1 & 2.
4) Transformation of TRAIL-Smac +pUC & AND Gate+pUC -Blue-White screening


Fig. 8:Blue White screening- i)DH5-α transformed with AND Gate Reporter (F+pUC ) & TRAIL-Smac FP (D+pUC) were plated in 100µg/mL Ampicillin plates with X-Gal & IPTG. Few White colonies were observed in each plate, along with blue colonies.
ii)No plasmid Control (white colonies) and pUC19 without insert Control (blue colonies).

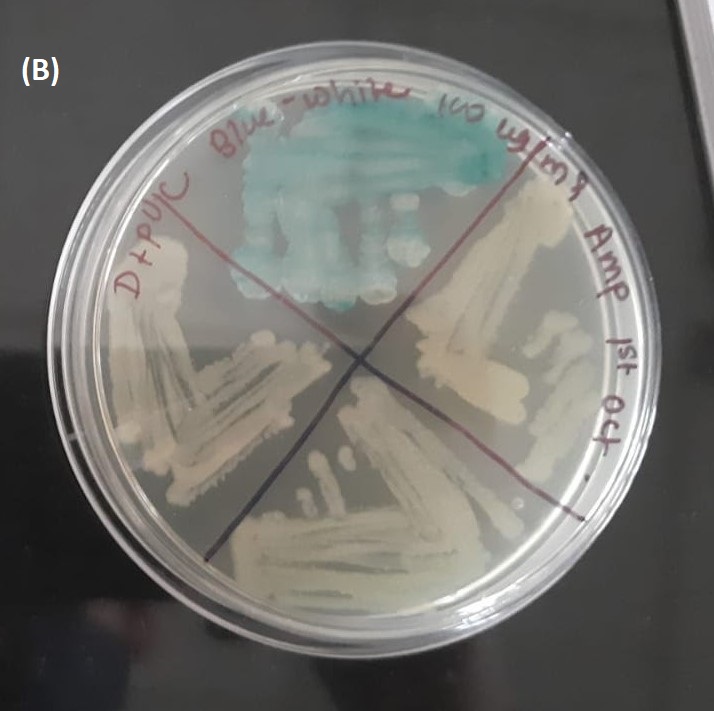
Fig. 9:After picking white colonies, the bacteria were re-plated on Ampicillin Plates with IPTG & X-Gal i)AND-Gate Reporter (F+pUC )- 100µg/mL Ampicillin
ii)TRAIL-Smac Fusion Protein (D+pUC).
Characterization of Kill Switch
Our Kill Switch is controlled by Lactate. It will kill bacteria under low lactate conditions and allow growth only if lactate concentration is more than 10 mM. As most solid tumors have a lactate concentration of approximately 10- 40mM, our kill switch will enable bacteria to live in the tumor microenvironment while not allowing them to live in normal tissues (lactate 1.3 to 3 mM). We successfully ligated the Kill Switch Components (Holin-Endolysin & Antiholin -Lamba Repressor) into pMB1 Plasmid.


Fig. 10: Transformation of E. coli DH5-𝛂 with the Kill Switch (Holin-Antiholin-pMB1) and Plating in :(A)40mM lactate, 50µg/mL Spectinomycin (B)0mM lactate , 50µg/mL Spectinomycin (C)Control -No plasmid (No antibiotic) (D)Control - pMB1 (50µg/mL Spectinomycin)
We could see a drastic difference in the growth of DH5-𝛂at 0mM Lactate and 40mM lactate plates. In 0mM lactate plates, the kill switch was operational, Holin and Endolysin were produced, killing the bacterium and preventing growth. Only one colony was observed in the 0mM lactate plate (could be an experimental error/ contamination). At 40mM concentrations of lactate, antiholin and lambda repressor were produced, which inhibited the holin and endolysin. Thus bacteria were able to survive and form many colonies.


Fig. 11: The growth of DH5-α transformed with Kill Switch+pMB1 at :(A)3mM lactate , 50µg/mL Spectinomycin (B)5mM lactate, 50µg/mL Spectinomycin (C)10mM lactate , 50µg/mL Spectinomycin (D)20mM lactate, 50µg/mL Spectinomycin
Small bacterial colony growth was observed in each plate, 3mM and 5mM lactate plates had fewer colonies, and 20 mM had a large number of colonies. We think there is a little bit of leakiness in the kill switch functioning. This leakiness could be the action of a lambda repressor, whose secretion is controlled by lactate. Lambda repressor will reduce Holin production by binding to the cL promoter. This allows us to deliver the bacteria via the intravenous route, as the lambda repressor will delay the action of the kill switch enough for bacteria to localize to the tumor region. But we could observe a considerable increase in the number of colonies at 20mM lactate. So our kill switch allows optimal bacterial growth from 10 to 40 mM lactate conditions, typically observed in solid tumors.
CFU per ml = (No. of colonies * Total dilution factor)/Vol. of culture plated in mL
Dilution Factor = 2
Vol. of culture plated in mL =0.1ml
| Sl.No | Lactate concentration in mM |
Number of colonies / Quarter of the plate (n) |
Total Colonies (t = n*4) |
CFU /mL ( t*2 /0.1 ml) |
|---|---|---|---|---|
| 1 | 0 | Nil | 1 (only 1 colony) | 20 |
| 2 | 3 | 4 | 16 | 3.2 *102 |
| 3 | 5 | 7 | 28 | 5.6*102 |
| 4 | 10 | 20 | 80 | 1.6 *103 |
| 5 | 20 | 242 | 968 | 1.93*104 |
| 6 | 40 | 285 | 1140 | 2.28*104 |
OD Measurement & Growth Curve of Bacteria with Kill Switch
| Time/Lactate concentration | 0 mM Lactate | 1.5 mM Lactate | 5mM Lactate | 10mM Lactate | 20mM Lactate | 40mM Lactate |
|---|---|---|---|---|---|---|
| 0.5 hr | 0.015 | 0.050 | 0.085 | 0.088 | 0.122 | 0.190 |
| 1 hr | 0.090 | 0.134 | 0.120 | 0.103 | 0.227 | 0.277 |
| 1.5 hr | 0.104 | 0.164 | 0.227 | 0.196 | 0.344 | 0.384 |
| 2 hr | 0.158 | 0.230 | 0.330 | 0.297 | 0.447 | 0.513 |
| 2.5 hr | 0.163 | 0.260 | 0.350 | 0.389 | 0.512 | 0.590 |
| 3 hr | 0.175 | 0.315 | 0.393 | 0.440 | 0.593 | 0.660 |
| 3.5 hr | 0.226 | 0.386 | 0.412 | 0.495 | 0.659 | 0.875 |
| 4 hr | 0.254 | 0.380 | 0.431 | 0.529 | 0.743 | 0.912 |
| 4.5 hr | 0.286 | 0.434 | 0.481 | 0.610 | 0.805 | 0.960 |
| 5 hr | 0.312 | 0.386 | 0.486 | 0.734 | 0.868 | 0.992 |
| 5.5 hr | 0.330 | 0.431 | 0.586 | 0.844 | 0.905 | 1.066 |
| 6 hr | 0.354 | 0.423 | 0.598 | 0.945 | 1.008 | 1.158 |
Table:1)OD measurement after inoculation 100 µL primary culture into 5mL fresh LB with 50µg/mL Spectinomycin and different lactate concentrations (0mM,1.5mM,5mM,10mM,20mM,40mM)

Fig. 12:Growth Curve of bacteria (DH5-α) with kill switch at different lactate concentrations.
Drylab Results
To get a holistic view of our project, we did a combination of mathematical, structural and simulation modelling. Here we compile our results from the various models and the questions that motivated us to build them.
Smac Internalization Kinetics
The rate of internalisation of Smac(n7)-R8 in the cancer cells plays an important role in inducing apoptosis. We used COPASI to build a mathematical model using Michaelis-Menten kinetics.
Molecular Dynamics Simulation of Smac Internalization
Due to delayed access to the wet lab, we wanted to check the internalization of the Smac-CPP (Cell-Penetrating Peptide) construct through the lipid bilayer. For this, we decided to run molecular dynamics simulations using GROMACS and CHARMM force fields on a high performance computing cluster.
Caspase Cascade Kinetics
This is a mathematical model made using COPASI that deals with the TRAIL-apoptosis machinery after fusion TRAIL binds with the death receptors present in the plasma membrane. This model shows an increase in the concentration of activated caspase3 after activation of death receptors.
Kill Switch Time Delay
A major question that we came across while designing our kill switch is the time it takes to get activated in the absence of lactate. For this, we mathematically modelled our system using COPASI and found that the system has a time delay of 20 minutes (considered as an underestimation).
Structural Modelling of TRAIL
Since our fusion construct is a polyprotein that gets cleaved to form Smac and TRAIL, we were motivated to check whether the linker residues impact the structure and thereby the function of TRAIL after cleavage. The structures of the native and fusion constructs were quite similar, hence we may conclude that there is a high chance that the active and functionally relevant domains in our fusion construct TRAIL will remain the same as that of native TRAIL.