Team:GXU-China/Model
<!DOCTYPE html>
Team:GXU China/Model
Model
Introduction
Molecular dynamics simulation
Predicting the protein structure, we obtained a relatively ideal protein structure. In order to further test whether the protein structure obtained previously is stable, we chose GROMACS, one of the mainstream molecular dynamics simulation software, to conduct molecular dynamics simulation of the protein obtained to verify whether the structure is stable. Besides, we also carried out direct docking of protein to protein, and the stability test of protein binding conformation obtained by docking also required molecular dynamics simulation by GROMACS.
Stability validation of protein prediction models
The principle of molecular dynamics simulation is to repeatedly solve the Newtonian equations of motion of atoms in protein molecules and solvent molecules by using various force field energies. The conformation of proteins will change during the simulation. According to the law of thermodynamics, the system tends to the state of its lowest free energy, which is the most stable state.
Based on the official GROMACS tutorial, we modified some of the files and generated Perl scripts that can run automatically on Linux servers and get the simulation result files.
The process of molecular dynamics simulation is roughly to generate the topology file of the protein and construct a simple solution system that is an aqueous solution box with specific ions. After energy minimization, we have a reasonable starting structure. We need to further balance the solvent and ions around the protein, divided into two parts, isothermal and isobaric, and then we can do the final simulation to get the required data files.
Materials and Methods
A. Target sequence acquisition
a. Obtaining the nucleotide sequence and amino acid sequence of SARS-COV-2 SRBD, E protein, N protein.
1. S antigen protein|SARS-CoV-2 (2019-nCoV) Spike RBD ORF (Codon Optimized)
>ORF SRBD
ATGTACTCATTCGTTTCGGAAGAGACAGGTACGTTAATAGTTAATAGCGTACTTCTTTTTCTTGCTTTCGTGGTATTCTTGCTAGTTACACTAGCCATCCTTACTGCGCTTCGATTGTGTGCGTACTGCTGCAATATTGTTAACGTGAGTCTTGTAAAACCTTCTTTTTACGTTTACTCTCGTGTTAAAAATCTGAATTCTTCTAGAGTTCCTGATCTTCTGGTCTAA
> Protein SRBD
MYSFVSEETGTLIVNSVLLFLAFVVFLLVTLAILTALRLCAYCCNIVNVSLVKPSFYVYSRVKNLNSSRVPDLLV
2. E antigen protein| SARS-CoV-2 Envelope small membrane protein
>ORF
ATGTACTCATTCGTTTCGGAAGAGACAGGTACGTTAATAGTTAATAGCGTACTTCTTTTTCTTGCTTTCGTGGTATTCTTGCTAGTTACACTAGCCATCCTTACTGCGCTTCGATTGTGTGCGTACTGCTGCAATATTGTTAACGTGAGTCTTGTAAAACCTTCTTTTTACGTTTACTCTCGTGTTAAAAATCTGAATTCTTCTAGAGTTCCTGATCTTCTGGTCTAA
> Protein
MYSFVSEETGTLIVNSVLLFLAFVVFLLVTLAILTALRLCAYCCNIVNVSLVKPSFYVYSRVKNLNSSRVPDLLV
3. N antigen protein| SARS-CoV-2 nucleocapsid phosphoprotein
>ORF
ATGAGTGACAATGGACCACAGAACCAGAGGAATGCCCCAAGGATTACCTTTGGAGGACCATCTGACAGCACAGGCAGCAACCAGAATGGAGAGAGGTCTGGAGCCAGGAGCAAGCAGAGGAGACCACAGGGACTGCCAAACAACACAGCCTCCTGGTTCACAGCCCTGACCCAACATGGCAAGGAGGACCTGAAGTTTCCAAGGGGACAAGGAGTGCCAATCAACACCAACTCCAGCCCTGATGACCAGATTGGCTACTACAGGAGGGCTACCAGGAGGATTAGGGGAGGAGATGGCAAGATGAAGGACCTGAGCCCAAGGTGGTATTTCTACTACCTGGGCACAGGACCTGAGGCTGGACTGCCATATGGAGCCAACAAGGATGGCATCATCTGGGTGGCTACAGAGGGAGCCCTGAACACACCAAAGGACCACATTGGCACCAGGAACCCTGCCAACAATGCTGCCATTGTGCTCCAACTTCCACAGGGCACCACCCTGCCAAAGGGCTTCTATGCTGAGGGCAGCAGGGGAGGCAGCCAGGCATCCAGCAGGTCCTCCAGCAGGAGCAGGAACTCCAGCAGGAACAGCACACCTGGCTCCAGCAGGGGCACCAGCCCTGCCAGGATGGCTGGCAATGGAGGAGATGCTGCCCTGGCTCTGCTGCTGCTGGACAGACTGAACCAACTTGAGAGCAAGATGAGTGGCAAGGGACAACAACAACAGGGACAAACAGTGACCAAGAAGTCTGCTGCTGAGGCAAGCAAGAAGCCAAGACAGAAGAGGACAGCCACCAAGGCTTACAATGTGACCCAGGCTTTTGGCAGGAGGGGACCTGAACAGACCCAGGGCAACTTTGGAGACCAGGAACTGATTAGACAGGGCACAGACTACAAACACTGGCCACAGATTGCCCAGTTTGCCCCATCTGCCTCTGCCTTCTTTGGGATGAGTAGGATTGGGATGGAGGTGACACCATCTGGCACCTGGCTGACCTACACAGCAGCCATCAAACTGGATGACA
> Protein
MSDNGPQNQRNAPRITFGGPSDSTGSNQNGERSGARSKQRRPQGLPNNTASWFTALTQHGKEDLKFPRGQGVPINTNSSPDDQIGYYRRATRRIRGGDGKMKDLSPRWYFYYLGTGPEAGLPYGANKDGIIWVATEGALNTPKDHIGTRNPANNAAIVLQLPQGTTLPKGFYAEGSRGGSQASSRSSSRSRNSSRNSTPGSSRGTSPARMAGNGGDAALALLLLDRLNQLESKMSGKGQQQQGQTVTKKSAAEASKKPRQKRTATKAYNVTQAFGRRGPEQTQGNFGDQELIRQGTDYKHWPQIAQFAPSASAFFGMSRIGMEVTPSGTWLTYTAAIKLDDKDPNFKDQVILLNKHIDAYKTFPPTEPKKDKKKKADETQALPQRQKKQQTVTLLPAADLDDFSKQLQQSMSSADSTQA -
b. Obtaining the Mycolicibacterium J1 phage capsid protein sequence.
The amino acid sequence of the Mycolicibacterium J1 phage capsid protein was downloaded from the NCBI database and saved as a FASTA format file.
Mycolicibacterium J1 phage capsid protein
>QXN67724.1 capsid protein [Mycolicibacterium phage J1]
MSNIQTGAERMPHDLSHLGFLAGQIGRLITISTTPVIAGDSFEMDAVGALRLSPLRRGLAIDSTVDIFTFYVPHRHVYGEQWIKFMKDGVNATPLPTVNTTGYIDHAAFLGTINPDTNKIPKHLFQGYLNIYNNYFKAPWMPDRTEANPNELNQDDARYGFRCCHLKNIWTAPLPPETELSRQMTTSTTSIDIMGLQAAYANLHTDQERDYFMQRYHDVISSFGGKTSYDADNRPLLVMRSNLWASGYDVDGTDQTSLGQFSGRVQQTYKHSVPRFFVPEHGTMFTLALVRFPPTATKEIQYLNAKGALTYTDIAGDPVLYGNLPPREISMKDVFRSGDSSKKFKIAEGQWYRYAPSYVSPAYHLLEGFPFIQEPPSGDLQERVLIRHHDYDQCFQSVQLLQWNSQVKFNVTVYRNLPTTRDSIMTS
B. Protein modeling
The quality of the model is a key factor affecting the reliability and validity of the experimental results, so the model should be strictly controlled. The criteria for judging the quality of the model in this study are: the quality of the results obtained from the modeling was checked by five software programs on the SAVES website(https://saves.mbi.ucla.edu/):
ERRAT[1],VERIFY[2],PROVE[3],WHATCHECK[4],PROCHECK[5], and the quality of the model was considered qualified only when the results of three of the software programs considered the quality of the model to be qualified, and the model with the best assessment was considered qualified and was used for further research.
In this study, the modeling was performed with Alphafold2[6] and SIWSS MODEL[7] and the modeling results were submitted to the SAVES platform for quality assessment.
a. Modeling of the S-antigen protein(SARS-CoV-2 (2019-nCoV) Spike RBD)
1.SWISS MODEL homology modeling
The obtained SARS-COV-2 SRBD amino acid sequences were submitted to SWISS MODEL, the templates were searched for, and the template with the highest coverage was selected for homology modeling. Information on the SWISS MODEL modeling results and the results obtained from modeling using Open Source Pymol[8] in Unbuntu 20.04 OS The display is shown in Figure 1.
2.Alphafold2 modeling
The amino acid sequence of SARS-COV-2 SRBD was submitted for modeling using the online version of Alphafold2.
The OpenSource Pymol display of the results of the modeling is shown in Figure2.

b. Modeling of the E antigen protein SARS-CoV-2 Envelope small membrane protein
1.SWISS MODEL
The amino acid sequence of the E protein was submitted on the SWISS MODEL tool web page, the template was searched, and modeling was performed, and the modeling results are shown in Figure3.

2.Alphafold2
The E protein was modeled using the online version of Alphafold2 and the results obtained are shown in Figure 4.

c. Modeling of the N antigen protein(SARS-CoV-2 nucleocapsid phosphoprotein)
d. Modeling of the Mycolicibacterium J1 phage capsid protein
1.SWISS MODEL
2.Alphafold2

C. Quality assessment of modelling results
| Software | Result |
|---|---|
| ERRAT | 88.205 |
| VERIFY | 86.16% |
| PROVE | ERROR |
| WHATCHECK | PASS |
| PROCHECK | PASS |
| Software | Result |
|---|---|
| ERRAT | 73.039 |
| VERIFY | 78.57% |
| PROVE | ERROR |
| WHATCHECK | PASS |
| PROCHECK | ERROR |
| Software | Result |
|---|---|
| ERRAT | 75.758 |
| VERIFY | 0% |
| PROVE | PASS |
| WHATCHECK | PASS |
| PROCHECK | PASS |
| Software | Result |
|---|---|
| ERRAT | 68 |
| VERIFY | 0% |
| PROVE | ERROR |
| WHATCHECK | PASS |
| PROCHECK | PASS |
| Software | Result |
|---|---|
| ERRAT | 77.597 |
| VERIFY | 63.25% |
| PROVE | ERROR |
| WHATCHECK | ERROR |
| PROCHECK | ERROR |
| Software | Result |
|---|---|
| ERRAT | 91.241 |
| VERIFY | 90.38% |
| PROVE | WARNING |
| WHATCHECK | PASS |
| PROCHECK | PASS |
| Software | Result |
|---|---|
| ERRAT | 76.06 |
| VERIFY | 70.96% |
| PROVE | ERROR |
| WHATCHECK | PASS |
| PROCHECK | ERROR |
The modeling results were evaluated using the modeling software in SAVES6.
From the assessment results, it can be seen that the ERRAT software showed a score of 88.205, which is around 91, and therefore considered to pass the quality check of this software; the VERIFY software showed 86.1% of the amino acids scored above 0.2, which is greater than 80%, and therefore considered to pass the assessment of this software; the results of WHATCHECK showed that most of the items assessed were PASS and warning, only 5 items showed ERROR, therefore considered to pass the check of this software; the result of PROCHECK for amino acid residue dihedral angle showed that 84% of amino acids were located in the credible region, 16% in the complementary allowed region, no amino acid residues were located in the uncredible region, only the result of PROVE assessment showed ERROR, therefore considered The SWISS MODEL modeling results of SRBD are qualified and can be used for further experimental studies.
The Alphafold2 modelling result for E protein passed the quality checks of PROVE, WHATCHECK as well as PROCHEK, therefore the model is considered to be of good quality and can be used for further experimental studies.The SWISS MODEL modelling results for E protein, only passed the WHATCHECK and PROCHECK assessments, the other three software showed that the software was not of satisfactory quality, therefore the model was considered to be of poor quality and could not be used for further research analysis.
The model obtained from N protein modelling was of poor quality and failed the quality assessment and could not be used for further experimental studies.
The ERRAT score of 70.087 for the J1 phage capsid protein predicted by Alphafold2 was well below 91 and was considered to have failed that assessment; the VERIFY assessment showed that only 70.96% of amino acid residues scored above 0.2, less than 80%, and were considered to have failed; the PROVE score also fell outside the confidence interval and was considered to have failed. Six of the WHATCHECK assessments showed ERROR and were considered to pass the assessment; the PROCHECK assessment results results showed that 1.6% of amino acid residues had dihedral angles located in the wrong region. The results of PROCHECK showed that 1.6% of amino acid residues were in the wrong region. The quality of the model is poor and it does not pass the quality assessment.
It can be seen that the ERRAT score of Mycolicibacterium J1 phage capsid protein obtained from SWISS MODEL modeling is 91.241, which is higher than 91 and is considered to pass; the evaluation result of VERIFY shows that 90.38% of amino acid residues are scored above 0.2 and pass this evaluation; the evaluation result of WHATCHECK has seven reported errors, more Warning is therefore considered to fail this evaluation; the score of PROVE lies outside the confidence interval and is therefore considered to fail; PROCHECK assessment results show that 91.6% of amino acid dihedral angles lie in the reasonable region and there are no amino acid residues with wrong dihedral angles, and a comprehensive analysis of the above assessment results concludes that this structure is more reliable.
D. Molecular dynamics simulation of modeling results
Molecular dynamics simulation was performed with GROMACS(v5.1.4).[9] The required codes and documents are as follows. The RMSD plot of the modelling results shows that the RMSD of the model exceeds 3Å when stability is reached, therefore it is considered that there is instability in the model and the RMDF plot of the simulation process is plotted for a further view of the variation of each atom in the structure.
a. Molecular dynamics simulation of SRBD modeling results


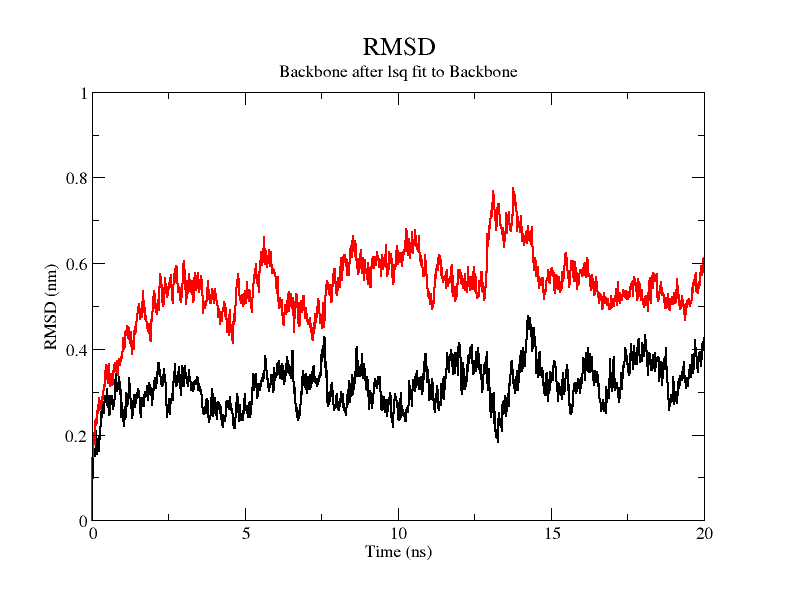
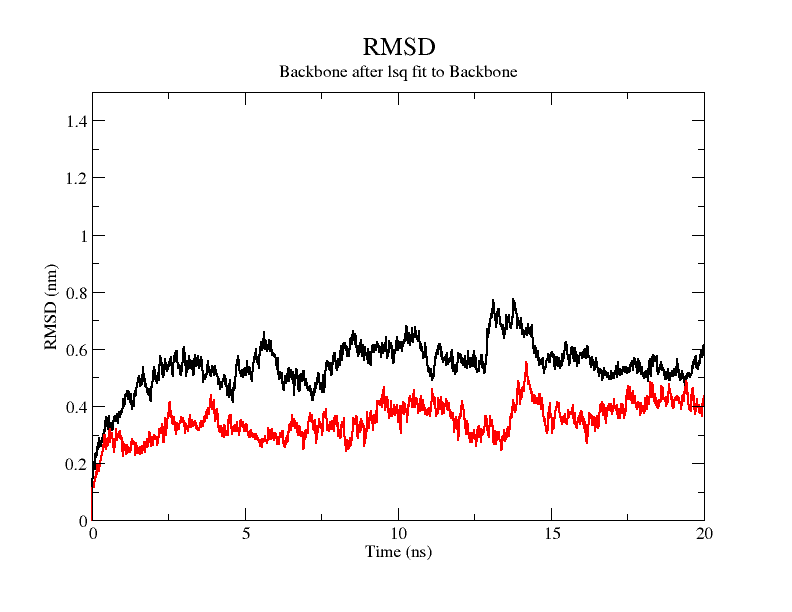
From the figure, it can be seen that the RMSD of the structure obtained from SWISS MODEL modeling is around 3 Å during molecular dynamics simulation, while the RMSD of the result obtained from Alphafold2 modeling is around 5 Å, which is significantly higher than that of the structure obtained from SWISS MODEL modeling, indicating that the SWISS MODEL modeling result is more stable and of higher quality, which is consistent with the SAVES in software's evaluation results are consistent.
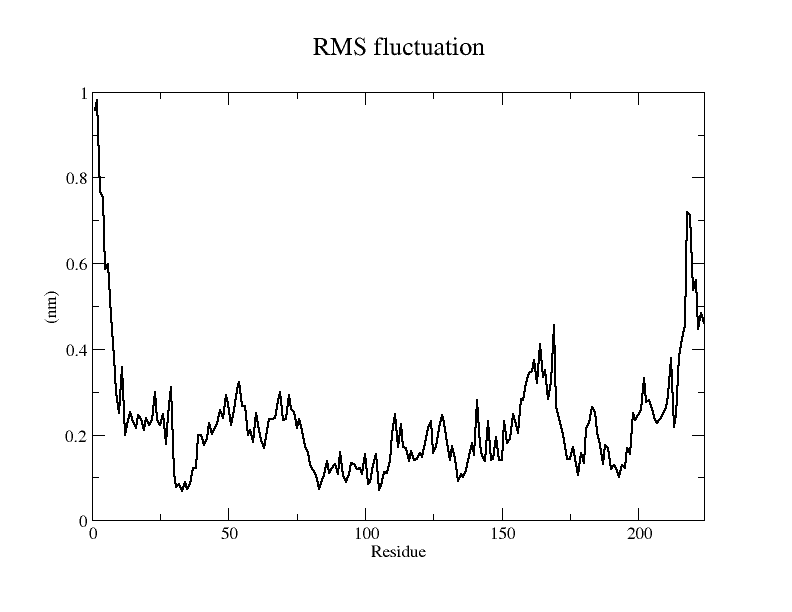
Viewing the motion of the model during the model, a more visual inspection of the stability of the model by analyzing the RMSF values of each amino acid residue during the simulation and using OpenSouce Pymol to color the model according to the b-factor shows that the main unstable regions of the model are located in the irregular curl at the ends and in the largest loop region, which is consistent with the the low quality region results given by the software in SAVES are generally consistent.
b. Molecular dynamics simulation of the results of N protein modeling
1. Molecular dynamics simulations of the modeled structure of the N protein Alphafold2


From the results of molecular dynamics simulations, the N protein model obtained from Alphafold2 modeling is very unstable, with an RMSD of 15 Å, indicating that the protein structure undergoes drastic conformational changes during the simulation, which, from the results obtained from the simulation, is mainly caused by the large number of longer loop regions in the structure see, according to the RMSF of each amino acid residue and according to the b factor coloring of the model confirms this speculation.
The RMSD=14.039Å for the model comparison before and after the simulation indicates that the model underwent drastic conformational changes during the simulation, and the post-simulation conformation may be more reasonable and stable.
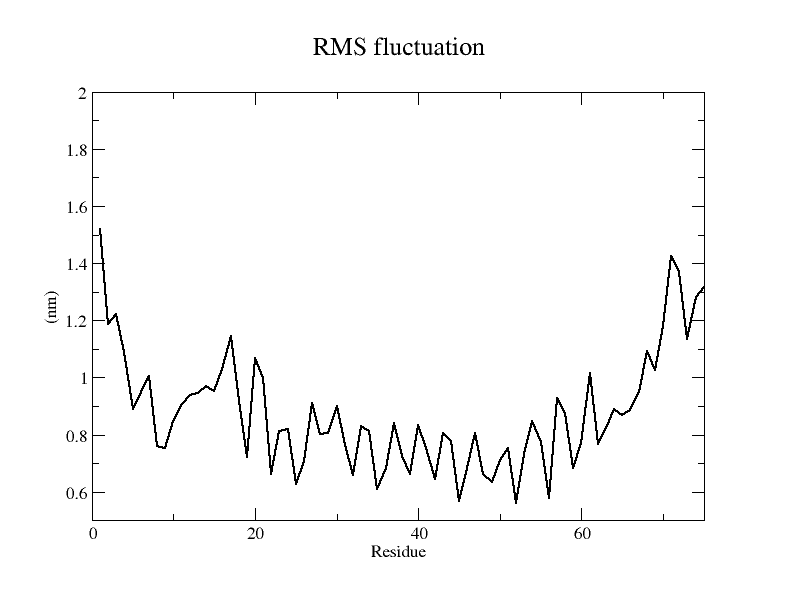
c. Molecular dynamics simulation of E protein modeling results
1. Molecular dynamics simulation of E protein SWISS MODEL modeling results


From the simulation results, the resulting model underwent drastic conformational changes during the simulation and the final RMSD was maintained at around 15 Å. From the RMSF of each amino acid residue and the b-factor coloring model, it can be seen that the RMSF of almost all amino acid residues is around 5 Å. Therefore, the model stability is considered to be poor.
2. Alphafold2 modeling results for E proteins


Because the E protein is small, it is difficult to reach a steady state during the simulation and its conformational changes are more intense, as seen in the RMSD plot, which has reached 15 Å and is still rising, and the animated display of the simulation process allows us to visualize this process more.
It is also evident from the RMSF plots as well as from the models colored according to b-factor that the E protein has more regions of instability and therefore the model is considered less stable.
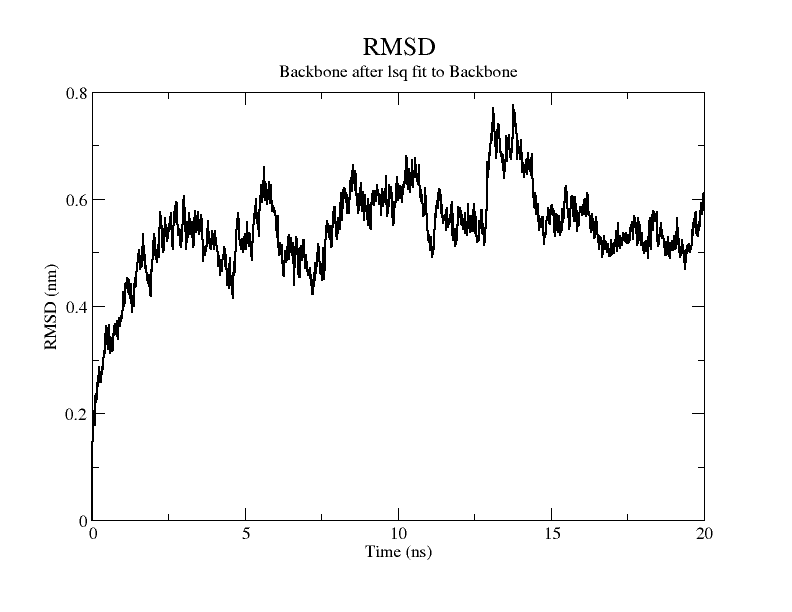
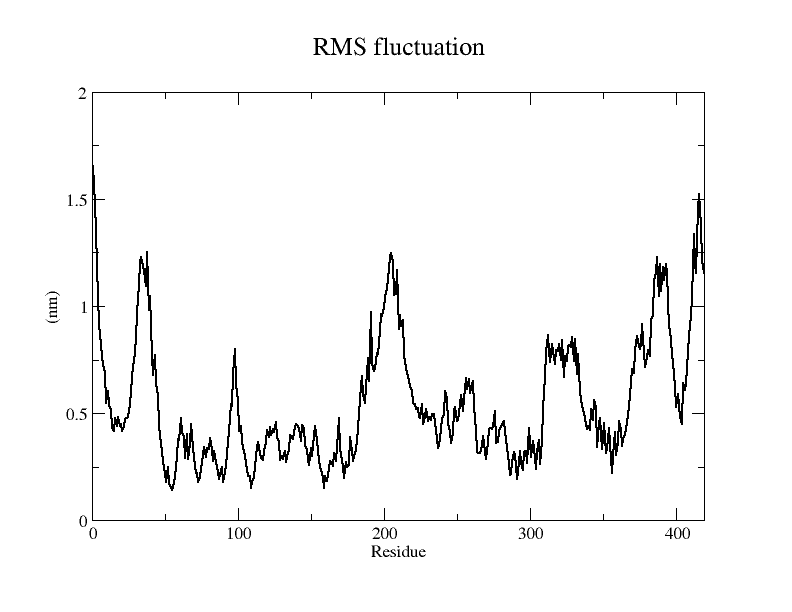
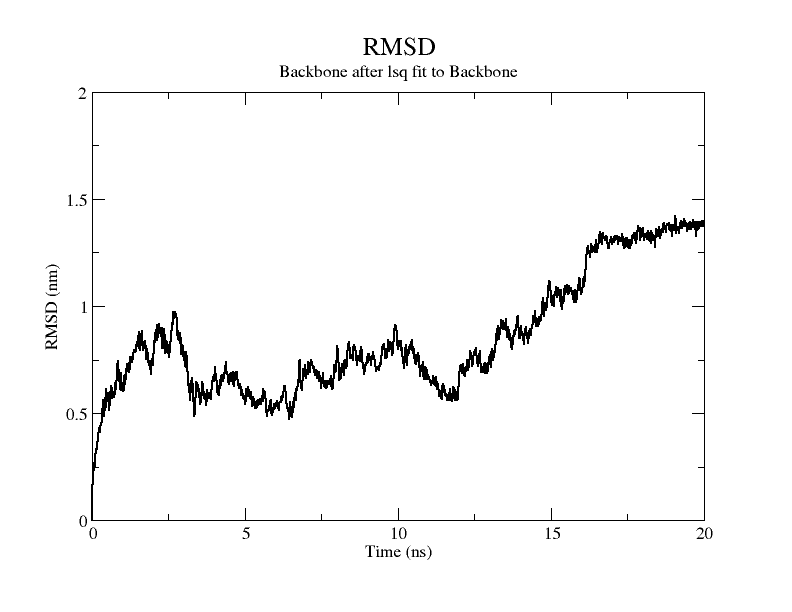
d. Molecular dynamics simulation of modeling results for the Mycolicibacterium J1 phage capsid protein
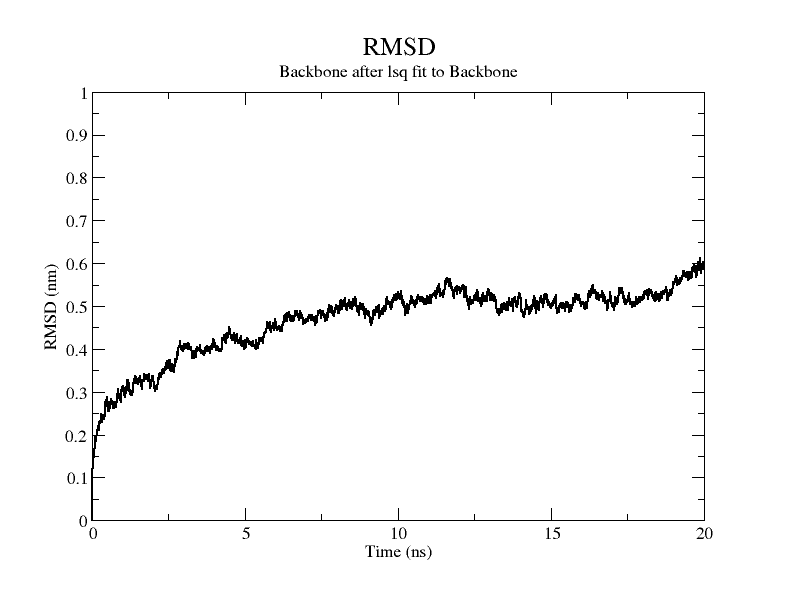
1. Molecular dynamics simulations of modeling results for the Mycolicibacterium J1 phage capsid protein predicted by Alphafold2


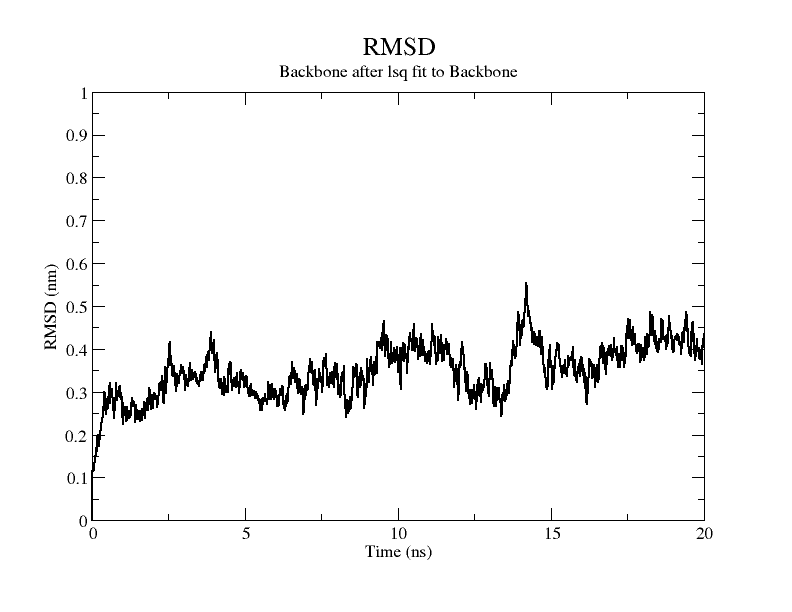
From the molecular dynamics simulations, firstly, the RMSD of the model stays around 3.5 Å for 1-10 ns, gradually rises to 0.6 Å for 10-15 ns, then decreases and seems to reach a plateau at close to 20 ns, staying around 5 ns. As a model, its stability is still within acceptable limits.
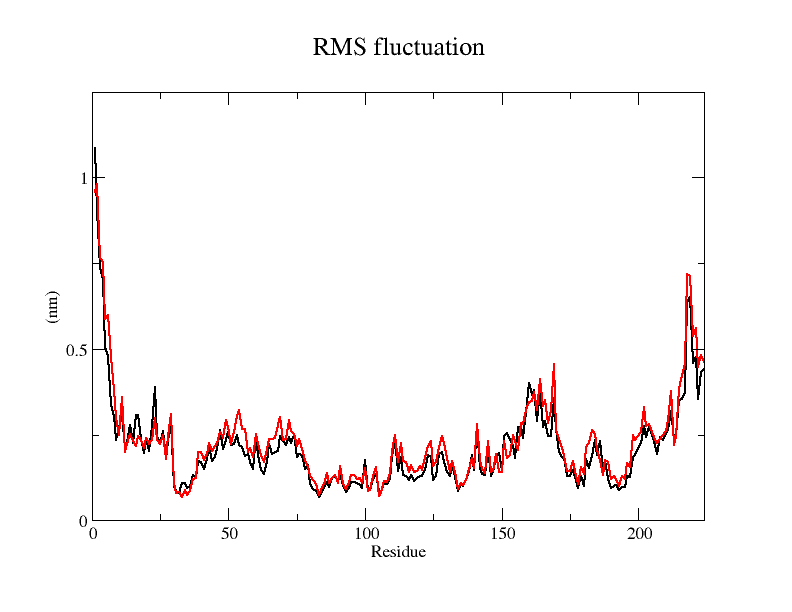
From the RMSF of the simulation results as well as the b-factor coloring model, it can be seen that the main unstable region is around amino acid residues 150-250, the light blue α-helix region shown in Fig.14(d).
Fig.14(e) shows the structure comparison before and after performing molecular dynamics simulations with RMSD of 1.652 Å. It is believed that no drastic changes in the molecular conformation of the protein occurred before and after, and the model is considered to be able to have good stability.
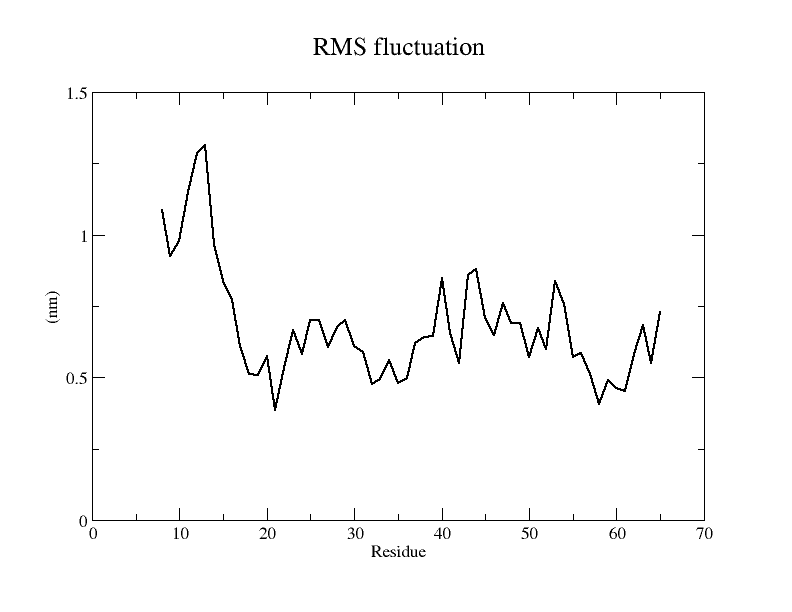
2. Molecular dynamics simulations of the Mycolicibacterium J1 phage capsid protein predicted by SWISS MODLE


The results of the molecular dynamics simulations show that the RMSD of the model in reaching 20ns is around 6Å, but does not reach a plateau and may require longer simulations. The RMSF plot shows that the RMSF values of amino acid residues at other sites lie under 5Å, except for amino acids at the ends and around 175-200, which are more stable, and this result is also visualized in the model colored according to the b-factor.
E. Single Point mutation prediction of S proteins
a. pmut-scan
Single Point mutation prediction was performed on the modeling results obtained from SWISS MODEL using pmut-scan in Rosetta_src_2019.47.61047_bundle, and the results obtained are shown in Tab.1, and the top ten mutations in terms of ddg were taken for further validation (ddg = energy after mutation - energy before mutation, if it is negative values indicate lower energy and more stable structure after mutation).
| Software | Result | ddg |
|---|---|---|
| 1 | T161N | -9.688 |
| 2 | L73A | -8.074 |
| 3 | L73D | -7.876 |
| 4 | L73N | -7.628 |
| 5 | T161D | -7.554 |
| 6 | L73S | -7.503 |
| 7 | T161S | -7.457 |
| 8 | T161K | -6.859 |
| 9 | T161E | -6.351 |
| 10 | L73Q | -6.334 |

b. Molecular dynamics simulations of the post-mutation structure


The results from the molecular dynamics simulation show that the stability of individual amino acid residues before and after the mutation is slightly elevated, in addition to some amino acid RMSFs that are instead elevated, but the overall RMSD values show that the structure is more stable after the mutation than before the mutation. The coloring of the overall structure based on stability also shows that the overall structure is more stable except for the N-terminal and C-terminal.
F. Analysis of the interaction between dual-acting vaccines and ACE2Molecular by molecular docking and molecular dynamics simulation
The CAPIR ( Critical Assessment of Predicted Interactions) certified protein-protein docking software ClusPro2.0 (https://cluspro.org/)[10],[11] was chosen to be used for docking of the receptor SRBD to ACE2, and since the presence of 610th amino acid to the end of the peptide which interferes with docking, and since this peptide is encapsulated in the inner ACE2 receptor protein and is not in contact with the outside environment, the peptide was truncated during docking and reattached to the peptide when the results were presented to facilitate the determination of the binding status. The interaction between two docked protein was performed with Ligplot+(v2.2.4)[12].
a. Docking of SRBD to ACE2 receptor
Crystal structures of ACE2 receptors were downloaded from the RSCB PDB database and individual subunits (chainD) were isolated for docking with SRBD.
The best binding conformation obtained after ClusPro's global docking is shown in the following figures.


The top-5 docking conformations were found to be both C-terminal and N-terminal in binding to the ACE2 subunit, and most of the binding sites were not on the surface of the receptor. A comprehensive analysis of the rationality of the binding conformation, the number of hydrogen bonds formed, and the software scoring ranking concluded that the third ranked binding conformation was the best conformation, and its stability was further examined by molecular dynamics simulations.


The results of the molecular dynamics simulations show that the RMSD during the simulation is about 5-6 Å. Since the SRBD is the structure obtained from the modeling and there are two protein structures in the system, and since the loop region is very unstable as seen in the animated display of the molecular dynamics simulations, the RMSD could be even lower if the interference of this non-binding region is not taken into account, this binding conformation is considered very stable indeed and is likely likely to be the case for binding to the ACE2 receptor when SRBD is expressed alone as an antigen. From this we suggest that ACE2 when expressed alone may have its antigenic activity compromised and fail to activate the immune response, leading to a decrease in vaccine efficacy.
Therefore, we concluded that the strategy of expressing the two proteins separately was not feasible. Meanwhile, during the docking process, it was found that the J1 phage protein could partially bind to the ACE2 receptor, so we tried to link the two proteins to construct a fusion protein by linking the C-terminus of SRBD with 6x(GS) linker to the J1 phage capsid protein, which could attenuate the attachment of the terminal inactive peptide to the ACE2 receptor, thus allowing the antigenically active region of SRBD to interacts more with ACE2.


Alphafold2 was used to construct the fusion protein, and the resulting fusion protein model is shown in Fig. The SRBD portion of the fusion protein was compared to the SRBD model obtained from SWISS MODEL modeling, and the result was RMSD = 2.356 Å. The J1 phage capsid protein obtained from SWISS MODEL modeling was compared to the J1 phage region of the fusion protein, and the result was RMSD = 1.427 Å; both comparisons were less than 3 Å. The fusion protein model was therefore considered to be very similar to the The fusion protein model was therefore considered very similar to the model used for previous docking and could be used for docking comparisons.
The resulting fusion protein model was docked to ACE2 and the top five results obtained are shown in following figures.


Considering the reasonableness of the binding conformation, the score ranking, and the number of interacting Hbonds, the third ranked conformation was finally considered as the best binding conformation, and its stability was further evaluated by molecular dynamics simulations.

The results of the molecular dynamics simulations showed an RMSD of about 5-6 Å. Since the system is a three-protein structure and the fusion protein used to construct the fusion protein is a flexible linker, the binding of the fusion protein to ACE2 is considered stable and may even be more stable than when SRBD is bound alone.
At the same time, the terminal peptide fragment that was removed from the inner side of the receptor before docking was added and the binding site of the fusion protein to the ACE2 receptor was observed and it was found that the antigenically active region of the SRBD in the fusion protein was better bound to the face of the ACE2 receptor and could exert its antigenic activity. The interaction surface of the fusion protein with the ACE2 receptor was analyzed, where the amino acid residues of SRBD that interact with ACE2 are listed in Tab.9.
| No. (Chain) | Amino Acid Name (Type) |
|---|---|
| 135(A) | LEU (Hydrophobic) |
| 153(A) | THR (Hbond) |
| 154(A) | GLU (Hbond) |
| 38(A) | ARG (Hbond) |
| 37(A) | ASN (Hbond) |
| 105(A) | ASN (Hbond) |
| 147(A) | PHE (Hbond) |
| 149(A) | ARG (Hbond) |
| 35(A) | ALA (Hydrophobic) |
| 34(A) | TYR (Hydrophobic) |
| 29(A) | ARG (Hbond) |
| 151(A) | ILE (Hydrophobic) |
| 42(A) | SER (Hbond) |
| 40(A) | ARG (Hbond) |
| 79(A) | TYR (Hbond) |
Taken together, these results suggest that expression of SRBD with J1 phage capsid protein in the form of a constructed fusion protein is more conducive to its antigenic activity, and that expression of SRBD alone may affect the effectiveness of the vaccine.
Conclusion
In this study, several SARS-COV2 protein models were constructed using SWISS MODEL and Alphafold2, and the stability of the models was further validated using molecular dynamics simulations, and it was finally concluded that the SRBD model constructed by SWISS MODEL, the E protein model constructed by Alphafold2 and the Mycolicibacterium bifidum J1 constructed by SWISS MODEL phage capsid protein amounts are better and can be used with experimental analysis.
We also obtained a more stable single point mutation structure than the original structure of SRBD, and molecular dynamics simulations further confirmed that the mutant structure is more stable, and it is believed that the stability of the structure of SRBD is most improved when only single point mutations are considered, and the Thr mutation at position 161 to Asn of SRBD is the best.
Using fusion protein modeling, molecular docking and molecular dynamics simulations, we analyzed the interaction between the antigenic moleculars of dual-acting vaccine and ACE2, and concluded that the antigenically active substance of the vaccine should be the SRBD-Mycolicibacterium J1 phage capsid protein fusion protein, and that separate expression of the two proteins would be detrimental to the antigenic activity of SRBD and thus to the effectiveness of the vaccine.
References
- Colovos C, Yeates TO. Verification of protein structures: patterns of nonbonded atomic interactions. Protein Sci. 1993;2(9):1511-1519. doi:10.1002/pro.5560020916
- Bowie JU, Lüthy R, Eisenberg D. A method to identify protein sequences that fold into a known three-dimensional structure. Science. 1991;253(5016):164-170. doi:10.1126/science.1853201
- Pontius J, Richelle J, Wodak SJ. Deviations from standard atomic volumes as a quality measure for protein crystal structures. J Mol Biol. 1996;264(1):121-136. doi:10.1006/jmbi.1996.0628
- Hooft RW, Vriend G, Sander C, Abola EE. Errors in protein structures. Nature. 1996;381(6580):272. doi:10.1038/381272a0
- Laskowski RA, Rullmannn JA, MacArthur MW, Kaptein R, Thornton JM. AQUA and PROCHECK-NMR: programs for checking the quality of protein structures solved by NMR. J Biomol NMR. 1996;8(4):477-486. doi:10.1007/BF00228148
- Mooers BHM. Shortcuts for faster image creation in PyMOL. Protein Sci. 2020;29(1):268-276. doi:10.1002/pro.3781
- Waterhouse A, Bertoni M, Bienert S, et al. SWISS-MODEL: homology modelling of protein structures and complexes. Nucleic Acids Res. 2018;46(W1):W296-W303. doi:10.1093/nar/gky427
- Cramer P. AlphaFold2 and the future of structural biology. Nat Struct Mol Biol. 2021;28(9):704-705. doi:10.1038/s41594-021-00650-1
- Van Der Spoel D, Lindahl E, Hess B, Groenhof G, Mark AE, Berendsen HJ. GROMACS: fast, flexible, and free. J Comput Chem. 2005 Dec;26(16):1701-18. doi: 10.1002/jcc.20291. PMID: 16211538.
- Kozakov D, Hall DR, Xia B, et al. The ClusPro web server for protein-protein docking. Nat Protoc. 2017;12(2):255-278. doi:10.1038/nprot.2016.169
- Alekseenko A, Ignatov M, Jones G, Sabitova M, Kozakov D. Protein-Protein and Protein-Peptide Docking with ClusPro Server. Methods Mol Biol. 2020;2165:157-174. doi:10.1007/978-1-0716-0708-4_9
- Laskowski RA, Swindells MB. LigPlot+: multiple ligand-protein interaction diagrams for drug discovery. J Chem Inf Model. 2011;51(10):2778-2786. doi:10.1021/ci200227u