
Modeling
In order to determine the optimal duration of induction of our engineered yeast, we culture them with β -galactose induced and measured OD600. There were two duplicated samples measured in order to eliminate the error and the initial data was given below:
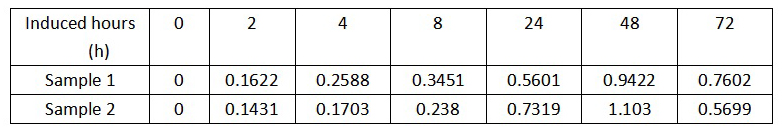
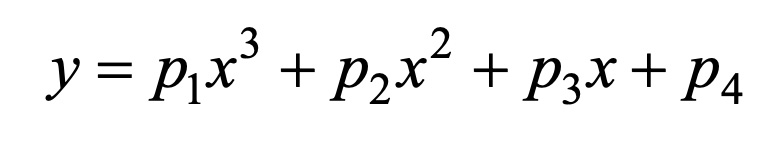
We chose to analyze the relationship between the OD600 value of the engineered yeast and its induced hours. By seeing the scatter-plots, we used the cubic polynomial equation to fit the trends:
Coding
The coding we used to build the models by MATLAB is given below:
clear;clc;
t0=[0 2 4 8 24 48 72];%时间
od_1=[0	0.1622 0.2588 0.3451 0.5601	0.9422 0.7602];%样本1数据
od_2=[0	0.1431 0.1703 0.238	0.7319 1.103 0.5699];%样本2数据
p1=polyfit(t0,od_1,3);%拟合样本1多项式系数
p2=polyfit(t0,od_2,3);%拟合样本2多项式系数
t=[0:0.5:72];%每间隔0.5小时取一个点
od600_1=polyval(p1,t);%计算样本1函数值
od600_2=polyval(p2,t);%计算样本2函数值
od_1max=max(od600_1)
od_2max=max(od600_2)
i1=find(od600_1==max(od600_1));
t1=t(i1)
i2=find(od600_2==max(od600_2))
t2=t(i2)
plot(t,od600_1,'b',t,od600_2,'r','LineWidth',2)
hold on
plot(t1,od_1max,'*','LineWidth',2)
plot(t2,od_2max,'*','LineWidth',2)
hold off
Model Results
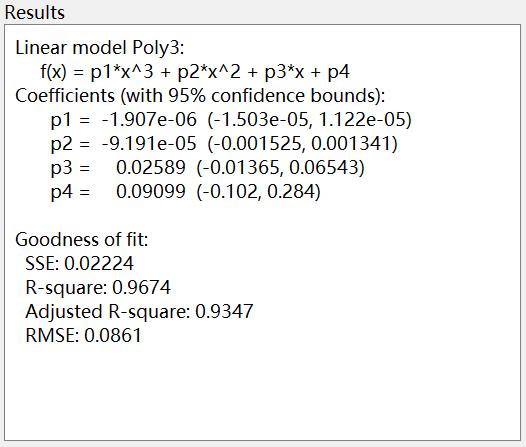 Figure 1. Model result of Sample 1
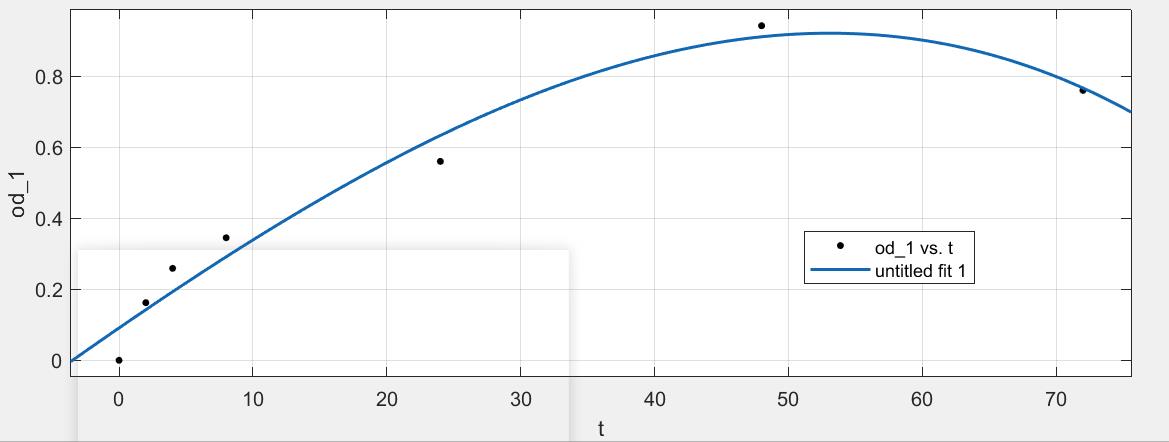 Figure 2. Fitting curve of the model of Sample 1
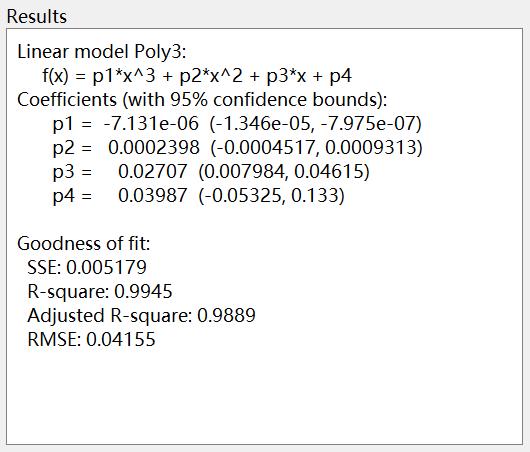 Figure 3. Model result of Sample 2
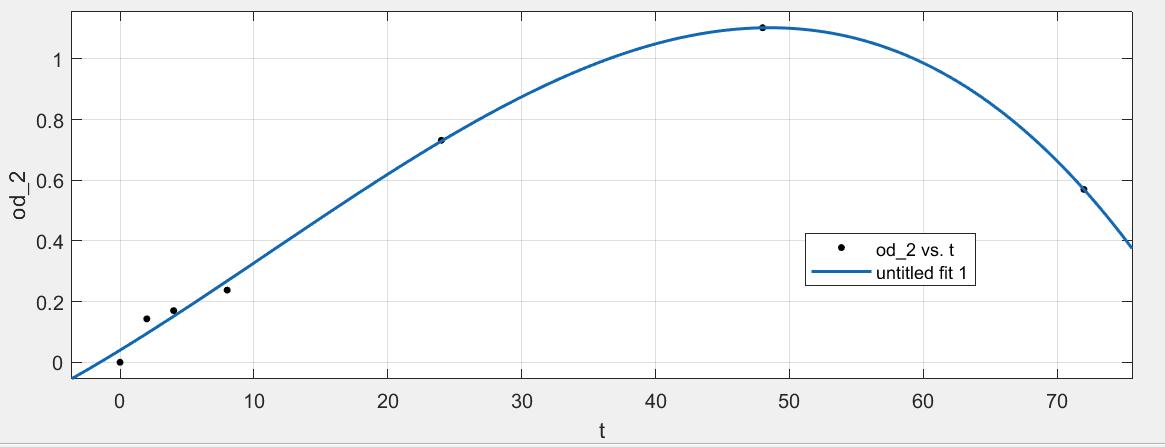 Figure 4. Fitting curve of the model of Sample 2
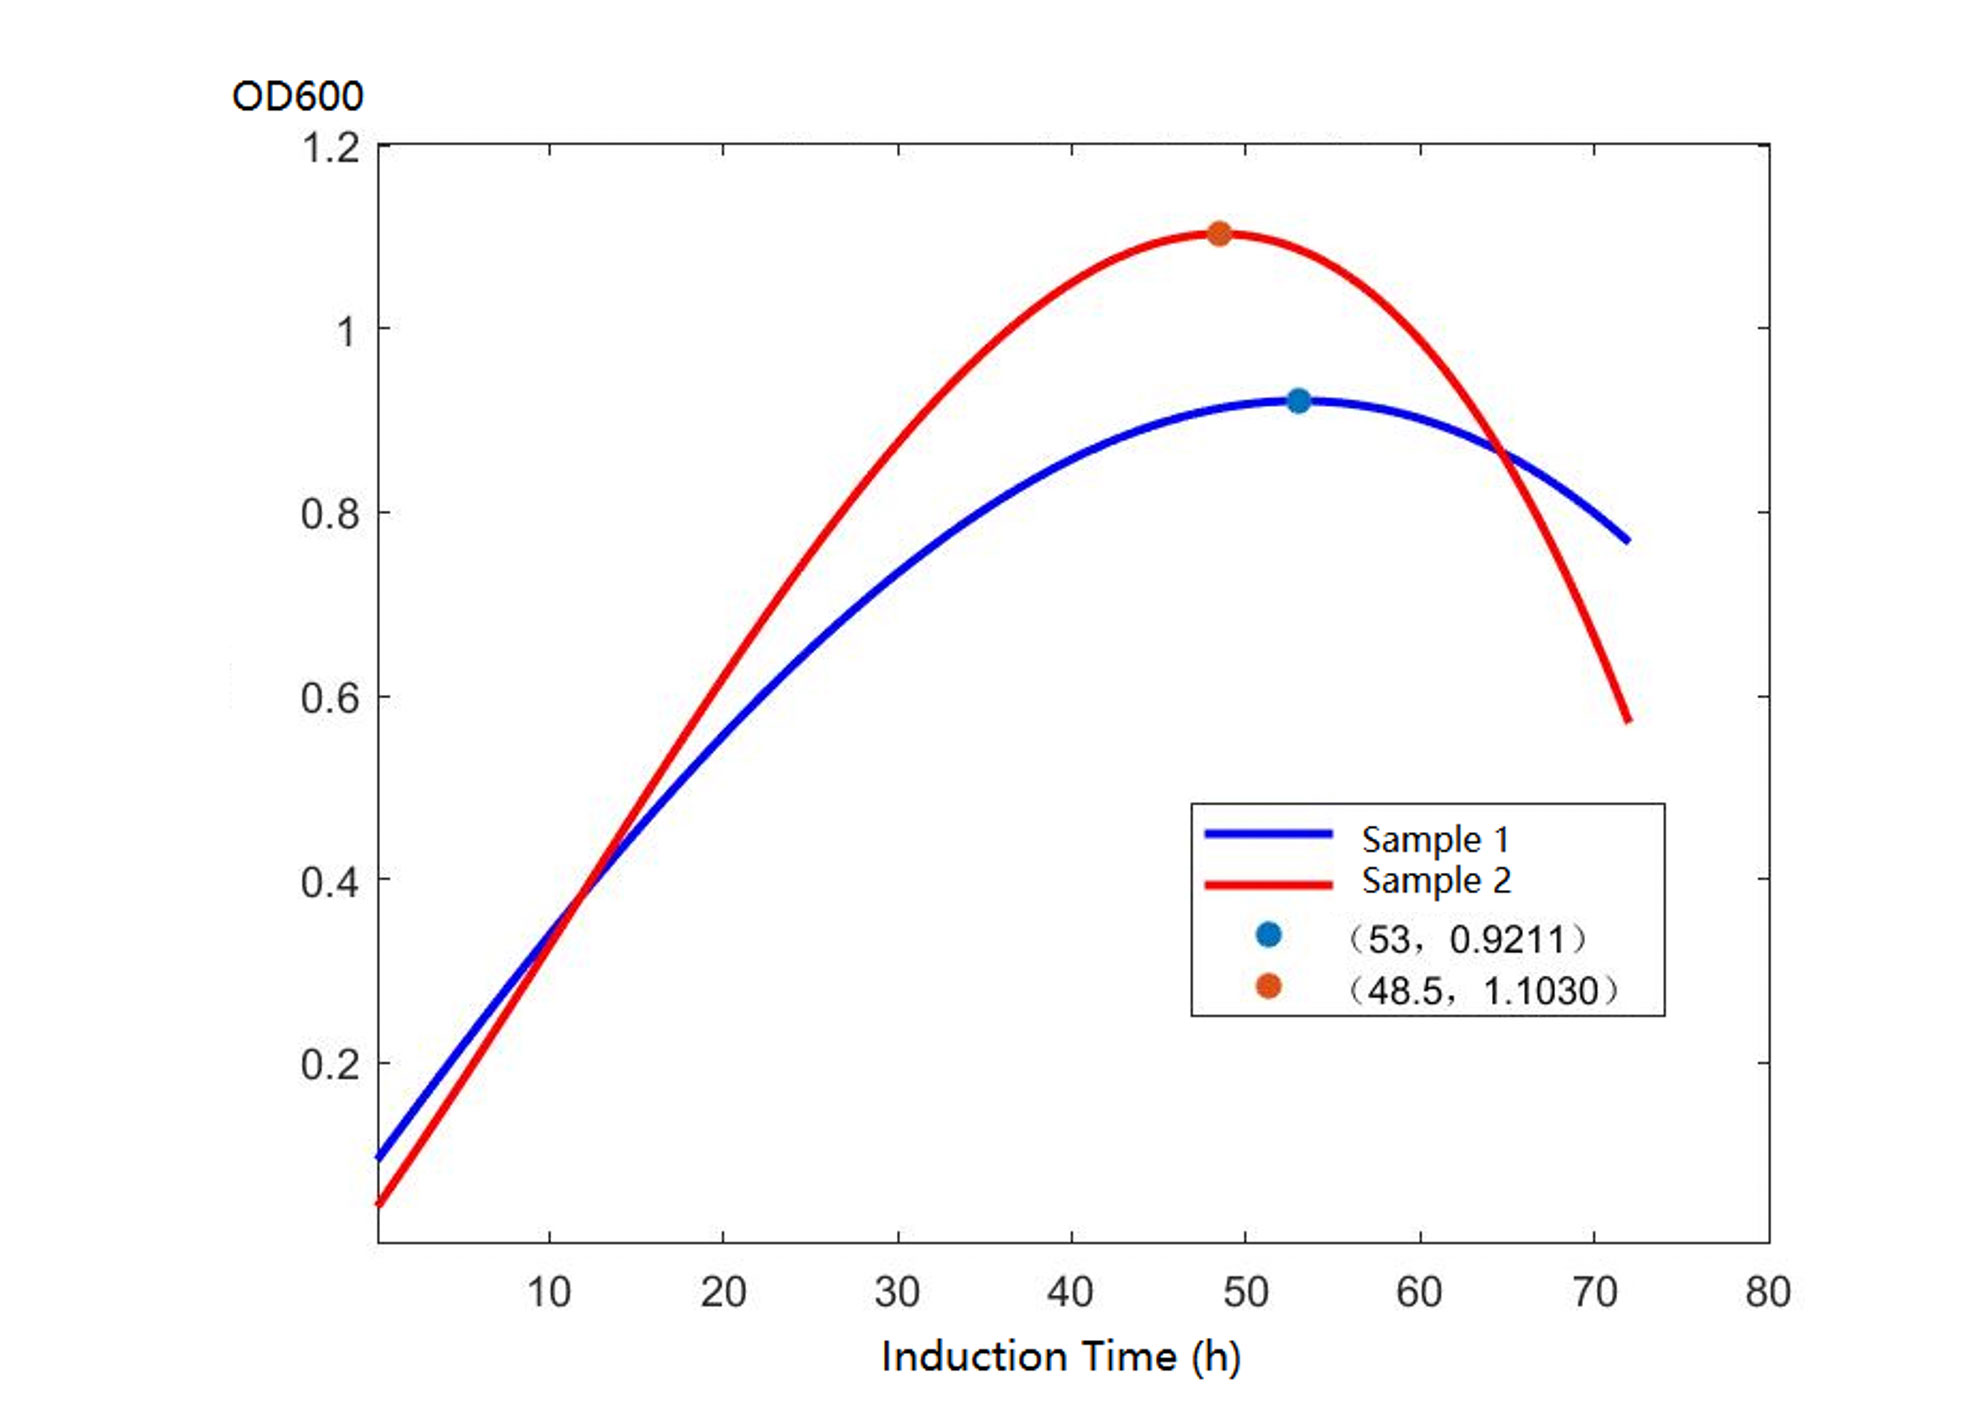 Figure 5. Comparison graph of the fitting curves of sample 1 and sample 2
Conclusion
Based on the model results (Fig. 1 & Fig. 3), these models fit the trends well with the fitting degrees higher than 0.96 thus it indicates that these two model equations could be used to predict the optimal induction time of our engineered yeast which would be also served as a reference for future fermentation experiments.
In figure 5, we can see that the top points of the two fitting curves fall down to t=48.5 and t=53. Therefore, it indicates that the optimal induction time range would be 48.5~53 hours.
Contact Info
