Team:William and Mary/Results
Results
Overview
- Overview of Results & Successful Proof of Concept
- Results of Mathematical Model Using Simulated Data
- Results of Mathematical Model Using Our Actual Data
- Mechanistic Model
- Data-Driven Model
- Results of Individual Circuits
- Confirmation of Test Circuit Functionality
- Sensor Circuit Results
1. Overview of Results & Successful Proof of Concept
The goal of our project was to develop an accessible toolkit to assess the orthogonality of genetic circuits to the host. This toolkit consists of [1] a system of sensor circuits designed to measure aspects of orthogonality and [2] models into which measurements from our circuits can be inputted to provide an assessment of a circuit’s overall orthogonality. Our models include: [a] a mechanistic model of ODEs coupling classical models of metabolic burden in E. coli and markers of orthogonality derived from analyzing RNA-sequencing data; this model incorporated additional markers of burden including post- translational modifications; and [b] a purely data-driven model developed from RNA-seq datasets which outputs a quantitative evaluation of orthogonality that goes beyond burden using inputs from our circuits. We were able to develop this system, take measurements from our sensor circuits, input the values into our model, and provide an assessment of the orthogonality of a genetic circuit, thus providing successful proof of concept.
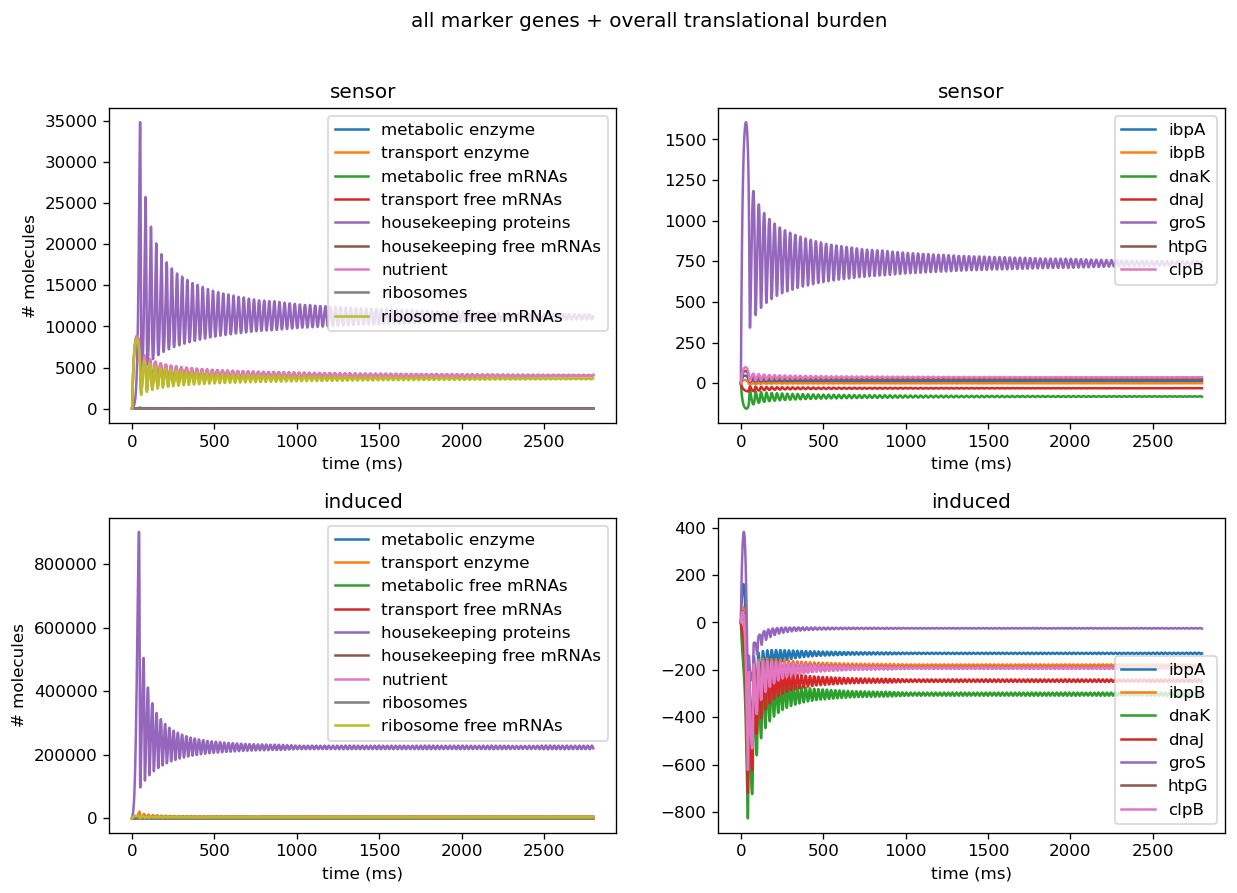
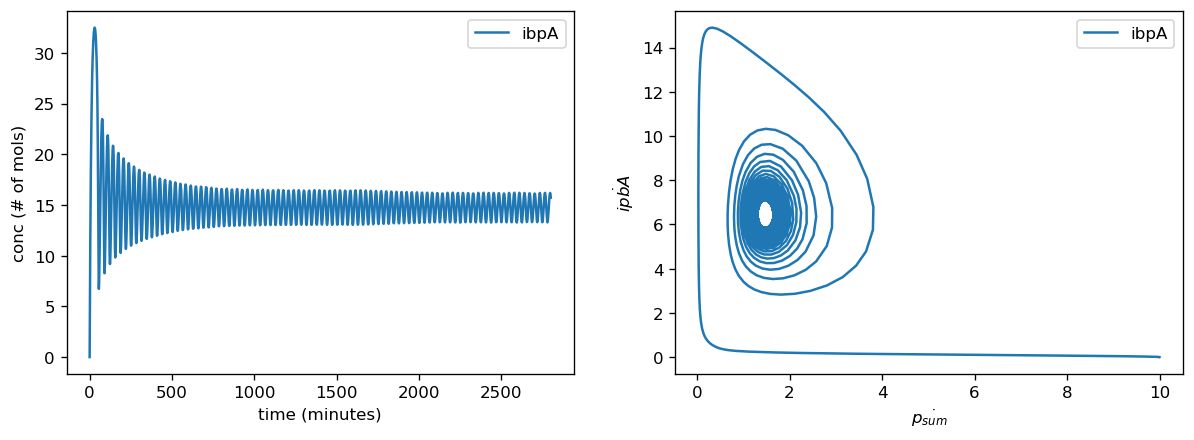
To test our system, we used the pBbB8k-csg-amylase “test” circuit. We obtained fluorescent measurements from each of our circuits, converted them to the number of molecules, and input the measurements from our sensor circuits into the mechanistic/metabolic model. After the data from our sensor circuits was put into the model, we ran the model and obtained the following results.
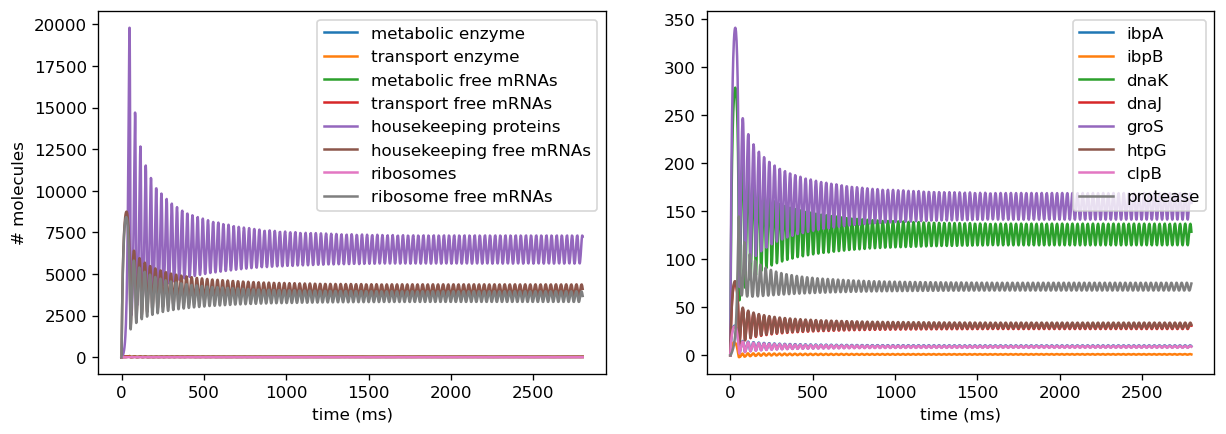
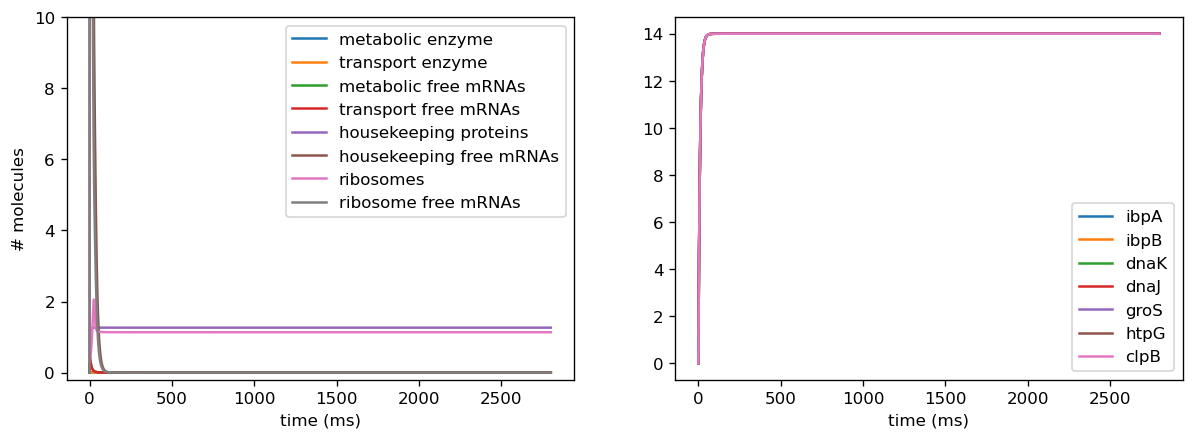
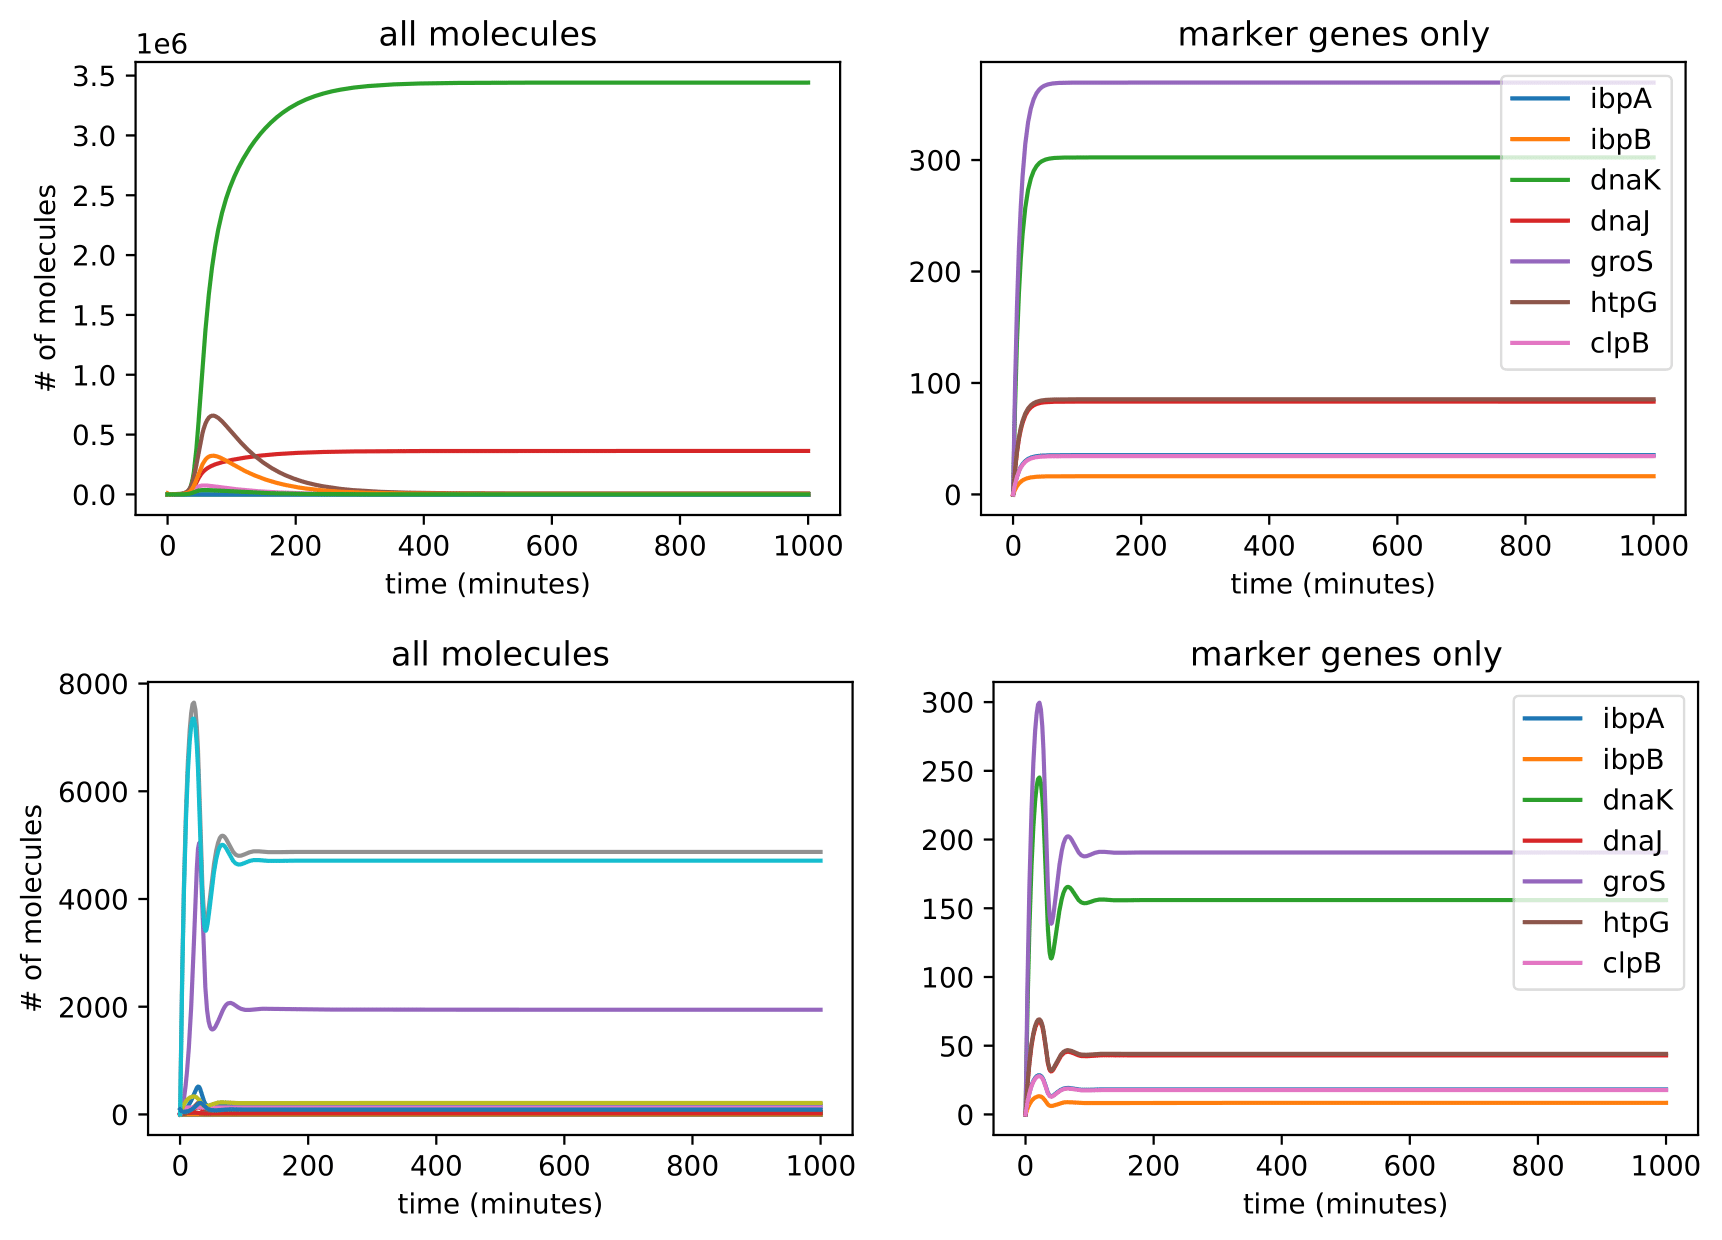
The model predicts that after 6 hours, mRNA transcripts encoding the following major protein groups were upregulated in response to circuit induction: metabolic proteins, housekeeping proteins, transport proteins, and ribosomes. In addition, our transcriptional aptamer circuit shows upregulation in response to circuit induction. These data suggest that the cells did not experience significant burden at the transcriptional level.
Our model also predicted that, on the translational level, after 12 hours, most metabolic proteins, transport proteins, and ribosomes were predicted to be downregulated while housekeeping proteins were predicted to be upregulated. This suggests significant translational burden on the cell. Finally, the model predicted that on the level of post-translational modifications (as assayed by protease activity) remains relatively stable.
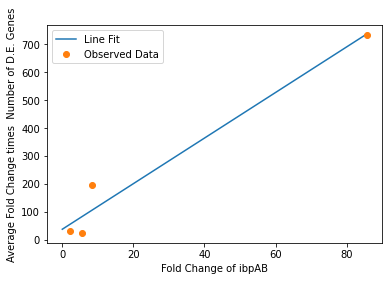
We also used our circuit measurements as input for the second data driven (from RNA-seq data) model which outputs a quantitative evaluation of orthogonality that goes beyond burden. Basically we developed an equation that assigned an orthogonality score between 0 (orthogonal) and 1 (non-orthogonal) from the weighted values of the input from the genes in our circuits. To determine the weight of each gene, we used RNA-seq data. We plotted the fold change of the marker gene for a given circuit versus the product of the average fold change of all the differentially expressed genes and the number of DE (differentially expressed) genes in that particular RNA-seq experiment. A function was generated to fit the data and was used to determine the gene’s weight for the equation to determine the orthogonality score.
After inputting our values from our circuits, we obtained an orthogonality score of 0.18 suggesting that, while translational burden played a significant role in overall non-orthogonality, the pBbB8k-csg-amylase circuit did demonstrate some degree of non-orthogonality due to factors beyond classic burden.
The summary data for these conclusions and proof of concept are shown below.
Model A: a mechanistic model of ODEs coupling classical models of metabolic burden in E. coli and markers of orthogonality derived from analyzing RNA-sequencing data; this model incorporated additional markers of burden including post- translational modifications.

Model B: a purely data-driven model developed from RNA-seq datasets which outputs a quantitative evaluation of orthogonality that goes beyond burden using inputs from our circuits
Future Directions:
- Test a wider range of circuits using our sensor system to improve our model’s accuracy and to gather comparative data
- Incorporate additional RNA-seq data sets into the model to increase the robustness of the gene weights (and gene selection) for the “beyond burden” model
2. Results of Mathematical Model Using Simulated Data
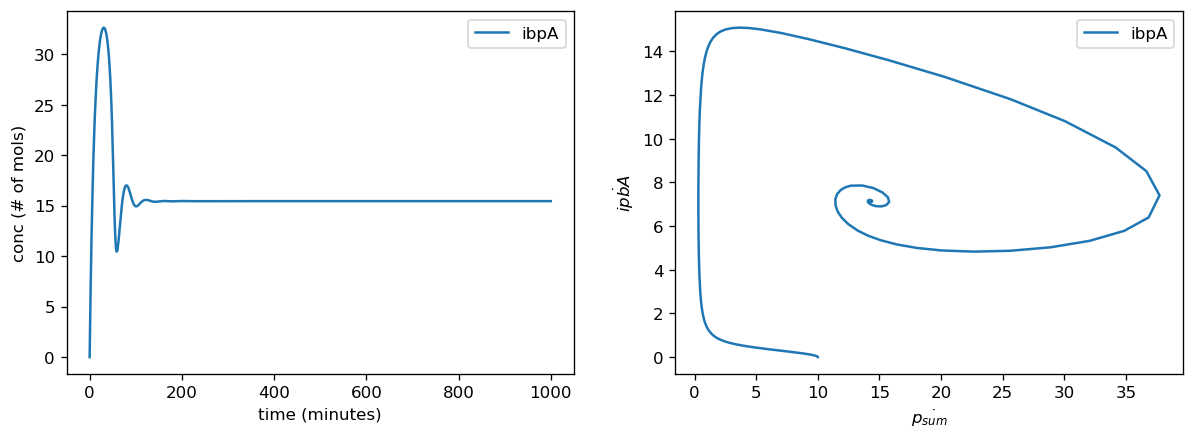
The model was calibrated by sampling simulated data points from within a range of Weiße’s empirically derived parameters for the repressilator circuit (Weiße et. al., 2015), on the assumption that induction of other arbitrary circuits would create burden within the same order of magnitude. The sampled simulated data points served as via scaling factors for translation rates we found from the literature for each marker gene and overall translation rates for the proteome as a whole (affecting the ribosome, metabolic, transport, and housekeeping protein sectors). In the simulations, we found that setting the scaling factor too high with a dynamic translation rate compounds the extreme values, creating a stiff system requiring extremely small step sizes to simulate accurately, or creating discontinuities in the numerical methods due to being pushed too far in an unstable state.
We also introduced a noise term into ribosome binding rates, as Weiße's empirical data indicated that ribosome binding rates decrease upon induction of a burdensome circuit. We observed that this captured a fairly broad range of behaviors as we varied these from higher to lower rates due to binding rates being factored into growth rate, which affects almost every concentration in our model. Since measurements from our sensor circuit collate the effects of translational and transcriptional burden by examining final fluorescence outputs, we assumed that these changes were reflected in our fitted parameters from the data and thus did not introduce similar changes to ribosome binding rates in our empirically-based model.
Introducing proteases at the right rate introduces oscillatory behavior in overall protein concentration and marker genes. To avoid non-physical negative protease concentrations, we establish a lower bound of 0 for protease production rates. Proteases scale with the amount of total protein within the cell and are thus are a dynamic source of degradation for each concentration of protein, including both the general proteome and the marker genes. At low translation rates, initially small amounts of protein are produced and trigger small amounts of protease production, which degrades proteins at a lower rate than translation produces them. This leads to the amount of protein concentration increasing fairly rapidly, which in turn triggers more production of proteases. This higher amount of protease will then degrade the existing amounts of protein, and in doing so slow its own production. Thus, protein concentrations decrease but will again increase as protease production slows. This leads to oscillations in protein concentration since the rate of degradation due to proteases is dynamic and will never reach a fixed ratio with translation rate where they exactly cancel each other out, which would lead to a steady state. However, when translation rate is significantly higher than the protease production rate, the effect of degradation from proteases is negligibly small, and thus protein concentration will be almost solely determined by translation rate and the natural protein degradation rate, which is not nonlinearly dynamic and thus will achieve a steady state.
3. Results of Mathematical Model Using Our Actual Data
3a. Model A
To test our system, we used the pBbB8k-csg-amylase “test” circuit. We obtained fluorescent measurements from each of our circuits, converted them to the number of molecules ("Quantitation of Green Fluorescent Protein," 2006), and input the measurements from our sensor circuits into the mechanistic/metabolic model. After the data from our sensor circuits was put into the model, we ran the model and obtained the following results.
The model predicts that after 6 hours, mRNA transcripts encoding the following major protein groups were upregulated in response to circuit induction: metabolic proteins, housekeeping proteins, transport proteins, and ribosomes. In addition, our transcriptional aptamer circuit shows upregulation in response to circuit induction. These data suggest that the cells did not experience significant burden at the transcriptional level.
Our model also predicted that, on the translational level, after 12 hours, most metabolic proteins, transport proteins, and ribosomes were predicted to be downregulated while housekeeping proteins were predicted to be upregulated. This suggests significant translational burden on the cell. Finally, the model predicted that on the level of post-translational modifications (as assayed by protease activity) remains relatively stable.
The summary data for these conclusions and proof of concept are shown below.
Model A: a mechanistic model of ODEs coupling classical models of metabolic burden in E. coli and markers of orthogonality derived from analyzing RNA-sequencing data; this model incorporated additional markers of burden including post- translational modifications.
To convert fluorescence of the 3WJ Broccoli circuit to a relative number of fluorescent aptamers, we adapted the formula y = 623.5x − 1580 from Figure 1 of the source “Quantitation of Green Fluorescent Protein in Microplates Using the FL600” and scaled to the molecular weight of the dye DFHBI-1T, which binds to the 3WJ Broccoli aptamer. We then normalized the relative number of fluorescent aptamers to the approximate number of cells per sample.
3b. Model B
While a mechanistic model of certain known cell processes is useful to characterize burden, moving from burden to orthogonality requires a way to reliably characterize unknown processes in the circuit-host complex. A burdensome process, by definition, draws from the resource pool of a cell, and thus makes quantification of burden caused by a circuit relatively straightforward; it is the change in the resource pool of a cell due to a circuit. However, orthogonality asks for all of the unintended interactions in the host cell, including those that are not rooted in the metabolic processes of the cell. As a result, properly considering orthogonality requires finding a way to move beyond burden. For our project, we chose to look at the fundamental processes of the cell in order to quantify orthogonality by looking at transcriptomics data, specifically RNA-seq.
RNA-Seq Analysis
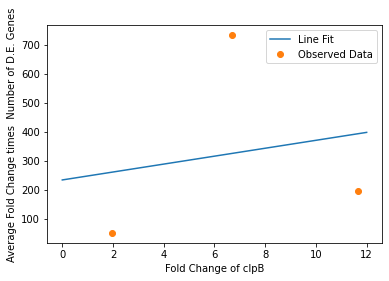
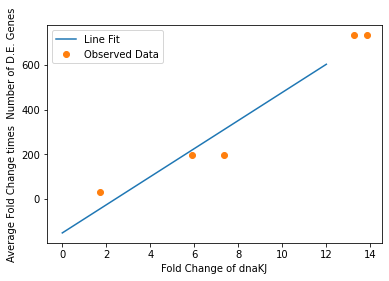
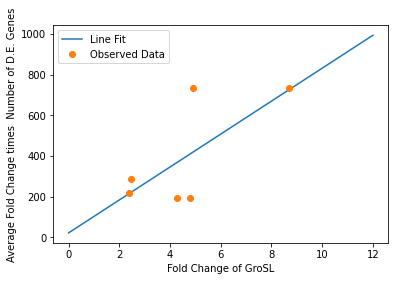
In our analysis of consistently DE genes correlated with induction of a circuit, we identified several patterns of differentially expressed genes. Investigating these particular genes provides us with the necessary basis to investigate the correlation between individual gene expression and overall differential expression. Unfortunately, RNA-seq datasets that reported the complete spread of everything are not prevalent, but the data from our analysis allowed us to plot the efficacy of these select ’marker genes’ as a measurement for overall differential expression. We plotted the product of the average absolute fold change and the total number of differentially expressed genes as a measure of orthogonality for all of our marker genes and calculated the correlation coefficients, as shown in Fig. 12-15. Due to the limited size of our data set, in many cases we were unable to see an overarching functional form. As a result, we fit all of our data points to a linear model to generate fit parameters for assessing the overall orthogonality, giving us the total equation
\[O=\frac{1}{5}\frac{1}{733.5} (\left(\textrm{groSL FC}\right)\cdot A+B+\left(\textrm{clpB FC}\right)\cdot C+D+F\left(\textrm{dnaKJ FC}\right)+G+H\left(\textrm{ibpAB FC}\right)+I)\]
Where FC refers to fold change and O is orthogonality and A,B,C,D,F,G and H are the fit parameters \(A=81.1,B=21.4,C=13.7, D=234.23,F=62.9,G=0,H=8.17*ibpAB+38.0\). H is set to 0 as the fit predicts a non-physical negative intercept for dnaKJ. The \(\frac{1}{5}\) term arises from the fact that this is the average of 5 marker genes and the \(\frac{1}{733.5}\) is a scaling term designed to provide a reasonable limit to non-orthogonality, as derived from our analysis of the literature on RNA-seq. This equation provides the framework and the general idea for calculating orthogonality from the fold change of a select genes, but the relatively small size of the data points available means it is highly sensitive to outliers and non-physical results had to be abstracted away from the fit in order to produce an equation. Nevertheless, as the available data increases this model is simple to implement by refitting to multiple points.
After inputting our values from our circuits, we obtained an orthogonality score of 0.18 suggesting that, while translational burden played a significant role in overall non-orthogonality, the pBbB8k-csg-amylase circuit did demonstrate some degree of non-orthogonality due to factors beyond classic burden.
Model B: a purely data-driven model developed from RNA-seq datasets which outputs a quantitative evaluation of orthogonality that goes beyond burden using inputs from our circuits
Future Directions:
- Test a wider range of circuits using our sensor system to improve our model’s accuracy and to gather comparative data
- Incorporate additional RNA-seq data sets into the model to increase the robustness of the gene weights (and gene selection) for the “beyond burden” model
4. Results of Individual Circuits
4a. Confirmation of Test Circuit Functionality
We confirmed the functionality of test circuit pBbB8k-csg-amylase using the Congo Red spin-down assay protocol from Harvard iGEM 2017 (Protocols). We found that in E. coli DH5-alpha, curli fibers were produced after 48 hours of incubation (37°C, 250 RPM), as the uninduced samples bound less Congo Red dye than the induced samples after 48 hours of incubation. Normalization of these values was done by subtracting the absorbance at 490 nm of a control (1X PBS and Congo Red dye).
The results of our Congo Red spin-down assay can be found below:

4b. Sensor Circuit Results
Burden Sensor Circuits
Transcriptional Burden Sensor Circuit
Hypothesis:
For the transcriptional burden sensor circuit 3WJ Broccoli (Alam et al., 2017), we hypothesized that the sensor circuit transformed individually in the host would produce higher levels of fluorescence than the sensor and test circuit cotransformed, and that the induced samples would have lower levels of fluorescence than the uninduced samples, as we hypothesized that since induction of the circuit would lead to curli fiber formation, it would inflict a significant amount of transcriptional burden upon the host cell, resulting in a decrease in fluorescence.
Actual Results:
For the transcriptional burden sensor circuit, the fluorescence levels of the uninduced samples were slightly higher than the induced samples (cotransformed with both our sensor and test circuits) 24 hours after induction. The fluorescence of the sensor circuit individually is higher than the induced and uninduced samples at most time points, but decreases to a level lower than induced and uninduced samples at 48 hours after induction. The difference in fluorescence between uninduced and induced samples are not statistically significant at any time point, likely due to the fact that only three replicates of this experiment were performed. However, before making subcultures using the overnight cultures (T-1) and 12 hours after induction, there was a statistically significant (p-value < 0.05) difference in fluorescence between induced and untransformed samples. The fluorescence of the induced samples was higher than the fluorescence of the untransformed samples at this time point. In addition, 6 hours after induction as well as 12 hours after induction, there was a statistically significant (p-value < 0.05) difference in fluorescence between induced samples and samples transformed with the sensor circuit individually. This is likely due to the test circuit placing a load on the host transcriptional resources and creating transcriptional burden, which is causing the induced samples to have lower fluorescence than the samples containing the sensor alone. Therefore, we can conclude that this sensor circuit is functional and that the test circuit is moderately burdensome at the transcriptional level, as induced samples were less fluorescent than uninduced samples and both uninduced and induced samples were less fluorescent than samples containing the sensor circuit alone at most time points. P-values found after conducting an unpaired t-test comparing all three replicates of this experiment can be found in the table below.
In summary:
- Fluorescence of the sensor circuit alone is higher than the induced and uninduced samples at most time points
- Difference in fluorescence between uninduced and induced samples are not statistically significant at any time point
- We can conclude that this sensor circuit is functional and that the test circuit is moderately burdensome at the transcriptional level

Please check the experience tab of this circuit’s parts page for graphical representation of the data. Raw fluorescence data for this circuit can be found here.
Translational Burden Sensor Circuits
Hypothesis:
For the translational burden sensor circuits, we hypothesized that the sensor circuit transformed individually in the host would produce higher levels of fluorescence than the sensor and test circuit cotransformed for both the induced and uninduced samples. We also hypothesized that the samples in which the test circuit was induced with arabinose would produce higher fluorescence than the uninduced samples, as we hypothesized that since induction of the circuit would lead to curli fiber formation, it would inflict a significant amount of translational burden upon the host cell, resulting in a decrease in fluorescence.
Translational Burden Sensor (WM21_016) - Designed by Ceroni et al. (2015)
Actual Results:
For the translational burden sensor circuit designed by Ceroni et al. (2015), the uninduced test circuit cotransformed with the sensor circuit produces higher fluorescence than the induced test circuit cotransformed with the sensor circuit at most time points, consistently for all three replicates of the experiment. In addition, for most time points across all three replicates of the experiment, the sensor circuit transformed individually in the host produced higher fluorescence than the cotransformed host (both induced and uninduced). The level of fluorescence produced by our untransformed cells was consistently much lower than that of all transformed cells, remaining at around 5,000 to 8,000 RFU throughout the 48 hour time period. Therefore, we can conclude that this translational burden sensor circuit is functional and that our hypothesis has been supported. P-values found after conducting an unpaired t-test comparing all three replicates of this experiment can be found in the table below.
In summary:- Uninduced test circuit cotransformed with the sensor circuit produces higher fluorescence than the induced test circuit cotransformed with the sensor circuit at most time points
- The level of fluorescence produced by our untransformed cells was consistently much lower than that of all transformed cells
- Uninduced test circuit cotransformed with the sensor circuit produces higher fluorescence than the induced test circuit cotransformed with the sensor circuit at most time points
- We can conclude that this translational burden sensor circuit is functional and that our hypothesis has been supported

Please check the experience tab of this circuit’s parts page for graphical representation of the data. Raw fluorescence data for this circuit can be found here.
Translational Burden Sensor - Alternate Design (WM21_013)
Actual Results:
Host cells cotransformed with both the sensor and test circuits that were induced with arabinose had consistently low levels of fluorescence that were very similar to the fluorescence levels of the uninduced samples. From the point right before induction (T0) up to 12 hours after induction (T12), the difference in fluorescence produced between induced and uninduced samples is not statistically significant, although it is statistically significant (p-value < 0.05) 24 hours after induction (T24). The difference in fluorescence produced between the induced cells and the cells containing the sensor circuit individually is not statistically significant from the point right before induction (T0) to 24 hours after induction (T24). However, the difference in fluorescence produced between the induced cells and cells containing only our sensor were only statistically significant (p-value < 0.05) 48 hours after induction (T48). For the difference in fluorescence produced by our induced samples and our untransformed samples, it was only statistically significant 24 hours and 48 hours after induction (T24 and T48)
Although host cells transformed with our sensor circuits individually had slightly higher levels of fluorescence than the induced and uninduced cells, the level of fluorescence produced by the circuit itself is very low. This indicates that our design of the translational sensor circuit is not functional . Therefore, our hypothesis was refuted. P-values found after conducting an unpaired t-test comparing all three replicates of this experiment can be found in the table below.
In summary:- From the point right before induction (T0) up to 12 hours after induction (T12), the difference in fluorescence produced between induced and uninduced samples is not statistically significant
- The difference in fluorescence produced between the induced cells and cells containing only our sensor were only statistically significant (p-value < 0.05) 48 hours after induction (T48).
- The level of fluorescence produced by the circuit itself is very low.
- Our design of the translational sensor circuit is not functional.
P-values for Translational Burden Sensor Circuit (WM21_013)

Please check the experience tab of this circuit’s parts page for graphical representation of the data. Raw fluorescence data for this circuit can be found here.
Post-Translational Burden Sensor Circuits
Phosphorylation Sensor
WM21_015 (our phosphorylation sensor) is based on the EnvZ/OmpR system. This system responds to changes in osmolarity of the environment by phosphorylation of the OmpR protein which then triggers production of either OmpC in high molarity states or OmpF in low osmolarity states. This circuit utilizes the ompC promoter to drive production of sfGFP. Therefore, this fluorescence output is indicative of phosphorylation rates.
Our team expected that our phosphorylation sensor would decrease in fluorescence output when an additional circuit was added to the host due to the additional burden caused by the results. The results we received were not exactly as predicted. This circuit actually produced more fluorescence when induced than when uninduced; however, there were no statistically significant differences between these values over time.
Due to the increase in fluorescence in the induced vs the uninduced, the osmolarity of the system must have increased. Given that the circuit our team used as our test plasmid was a biofilm producing plasmid, our team hypothesizes that biofilm production created an increase in the osmolarity of the surrounding environment. This increase in osmolarity triggered the EnvZ/OmpR system to increase phosphorylation rates. Overall, there was no significant difference in the amount of fluorescence output between our sensor circuit with an additional plasmid, induced or uninduced.
In Summary:- Our team received unexpected results for our phosphorylation sensor
- There was no statistically significant difference between expression between the induced and uninduced sensors
- The level of fluorescence produced by the circuit itself is very low.
- This circuit produced more fluorescence when induced than when uninduced
P-values for Phosphorylation Sensor Circuit (WM21_015)

Please check the experience tab of this circuit’s parts page for graphical representation of the data. Raw fluorescence data for this circuit can be found here.
”Beyond Burden” Sensor Circuits
WM21_017 (clpB sensor, original design)
Our analysis of differentially expressed genes told us that clpB was frequently upregulated upon introduction of a heterologous circuit. As a result, our first prediction was that when transformed into cells alongside another circuit such as pBbB8k-csg-amylase, the clpB sensor circuit would fluoresce more than when it was transformed into cells alone. Additionally, our second prediction was that the clpB sensor would produce increasing fluorescence over time, especially in cotransformed cells, as we believed pBbB8k-csg-amylase would become more productive and thereby cause more effects on the cell over time. Third, we predicted that cotransformed cells would fluoresce more when induced than otherwise. This is because we expected pBbB8k-csg-amylase, which is inducible by arabinose, to have more effects on regular cell functions if its expression levels were increased.
Our cultures in fact appeared to fluoresce more on average when only the clpB sensor was present than when it was alongside pBbB8k-csg-amylase, refuting our first prediction. On average, all of our cultures that were transformed with the sensor circuit alone did increase in fluorescence over time, confirming the first half of our second prediction; however, our cotransformed cultures did not increase faster than those containing the clpB sensor alone, indicating that the circuit was not fluorescing more due to to the presence of pBbB8k-csg-amylase. Finally, of our cotransformed cultures, induced cells were more often higher in fluorescence than uninduced cells. This somewhat confirms our third prediction, although the difference was small, inconsistent across replicates, and not evident after converting raw fluorescence values to number of sfGFP molecules per cell.
It is important to note that these results are not statistically significant (p-value>0.05), however, largely because we were only able to obtain three replicates of data. We performed a t-test to evaluate the difference between: A) uninduced versus induced, cotransformed cells; B) induced cells versus untransformed cells, the negative control; and C) induced, cotransformed cells versus cells containing only the sensor circuit. Only B was consistently statistically significant (p-value<0.05) across time points. Although not statistically significant, we were able to observe the aforementioned, suggested trends, which might become clearer with more testing.
Because the average fluorescence of cotransformed cells both was lower than and increased slower than the average fluorescence of cells containing the sensor circuit alone, we conclude that the circuit does not successfully report an increase in PclpB expression when a second circuit is present. Additionally, it appears that pBbB8k-csg-amylase is so burdensome to the expression of the clpB sensor that rather than causing its promoter to be upregulated as intended, it uses up cellular resources needed to produce sfGFP. One explanation is that this version of the clpB sensor simply does not produce enough fluorescence to compete with pBbB8k-csg-amylase. We notice that WM21_018, which appeared four times as fluorescent as WM21_017 during functional confirmation, does show greater fluorescence when cotransformed alongside pBbB8k-csg-amylase than otherwise. It may be that circuits that produce a low level of sfGFP are more easily outcompeted by pBbB8k-csg-amylase.
In summary:- Unexpectedly, cotransformations fluoresced less than sensor-alone cells
- Transformed cells expectedly increased in fluorescence over time
- Induced cotransformations may have fluoresced more than uninduced cotransformations, which would be expected
- We conclude that this circuit is not a successful reporter of differential expression of clpB; it is likely burdened by and unable to compete with pBbB8k-csg-amylase for cell resources
P-values for clpB Sensor Circuit, original design (WM21_017)

Please check the experience tab of this circuit’s parts page for graphical representation of the data. Raw fluorescence data for this circuit can be found here.
WM21_018 (clpB sensor, improved design)
We had the same expectations for WM21_018 as we had had for the earlier version of it, WM21_017. First, we expected this new version of the clpB sensor to fluoresce more in cotransformed cells than cells with the sensor alone. Second, we predicted that fluorescence of all transformed cells would increase over time, and that the fluorescence of cotransformed cells would increase faster than that of those with the sensor alone. Finally, we expected cotransformed cells to fluoresce most after being induced.
Uninduced, cotransformed cells did generally appear to fluoresce more on average than cells containing the sensor circuit alone, supporting the first prediction. Induced, cotransformed cells appeared to have a similar result only after converting fluorescence to number of sfGFP molecules per cell. This is likely because induced cells took longer to grow in Replicates 1 and 2, according to our OD600 measurements at each time point. It may be that with more replicates, this issue would be resolved, but it is likely that the burden imposed on an induced, cotransformed cell places limitations on growth rate. The low average fluorescence of induced cells contradicts our third prediction. Average fluorescence of all transformed cells did increase over time, fulfilling our second prediction, although fluorescence of induced cells increased slower than that of other cells, likely due to the previously mentioned reasons. Fluorescence later decreased on average for uninduced cells and cells with the sensor circuit alone; these cells were likely unable to sustain a high production of sfGFP over such a long period of time, especially with the presence of two circuits.
As with the earlier version of this circuit, it is important to note that many of the differences between fluorescence measurements were not statistically significant (p-value>0.05) according to a t-test. Once again, only the comparison between induced versus untransformed cells returned a p-value of less than 0.05 for multiple time points. If we were able to perform more replicates, the aforementioned trends suggested by the data might become more clear.
Because cotransformed cells produced more sfGFP over time than WM21_018 alone, we concluded that WM21_018 is an improved version of WM21_017, and could plausibly be used to report the unintended interactions occurring between a secondary circuit and the host cell. This success, while limited by our number of replicates, is likely due to the high fluorescence of WM21_018, which was shown to fluoresce about four times as much as WM21_017 during functional confirmation. This allows us to measure the upregulation of the clpB promoter when a circuit such as pBbB8k-csg-amylase is present.
In summary:- Only uninduced cotransformations clearly fluoresced more than sensor-only cells
- Transformed cells expectedly increased in fluorescence over time
- Induced cotransformations unexpectedly fluoresced less than uninduced cotransformations
- We conclude that this circuit is a successful reporter of differential expression of clpB; although induced cells grow slower and therefore fluoresce less, this is an improvement upon WM21_017
P-values for clpB Sensor Circuit, improved design (WM21_018)

Please check the experience tab of this circuit’s parts page for graphical representation of the data. Raw fluorescence data for this circuit can be found here.
WM21_023 (lon sensor)
Our analysis of differentially expressed genes told us that lon was frequently upregulated upon introduction of a heterologous circuit. As a result, we expected that when transformed into cells alongside another circuit such as pBbB8k-csg-amylase, WM21_023 would fluoresce more than when it was transformed into cells alone. Second, we expected the lon sensor to produce increasing fluorescence over time, especially in cotransformed cells, as we believed pBbB8k-csg-amylase would become more productive and thereby cause more effects on the cell over time. Third, we predicted that cotransformed cells would fluoresce more when induced than otherwise. This is because we expected pBbB8k-csg-amylase, which is inducible by arabinose, to have more effects on regular cell functions if its expression levels were increased.
On average, our cultures in fact appeared to fluoresce far more, and increase in fluorescence far faster, when only the lon sensor was present than when it was alongside pBbB8k-csg-amylase. This contradicts our first prediction. While average fluorescence appeared to increase over time for all transformed cells, supporting our second prediction, when converted to number of sfGFP molecules per cell, this was not the case; average sfGFP increased for the sensor circuit alone and from about 6 to 12 hours after induction for induced cells, but average fluorescence decreased until 48 hours for uninduced cells. Finally, of our cotransformed cultures, induced cells were on average consistently higher in both fluorescence and number of sfGFP molecules per cell than uninduced cells after 6 hours. This confirms our third prediction.
It is important to note that these results are not totally statistically significant, however, largely because we were only able to obtain three replicates of data. We performed a t-test to evaluate the difference in fluorescence between: A) uninduced versus induced, cotransformed cells; B) induced cells versus untransformed cells, the negative control; and C) induced, cotransformed cells versus cells containing only the lon sensor. Only B and C were consistently statistically significant (p-value<0.05), and only after one or six hours, respectively, when fluorescence values diverged most strongly. Although not fully statistically significant, we were able to observe the aforementioned, suggested trends, which might become clearer with more testing.
Because the average fluorescence of cotransformed cells both was lower than and increased slower than the fluorescence of cells containing the lon sensor alone, we conclude that the circuit does not successfully report an increase in Plon expression when a second circuit is present. pBbB8k-csg-amylase may be so burdensome to the expression of the sensor circuit that rather than causing its promoter to be upregulated as intended, it uses up cellular resources needed to produce sfGFP. The lon sensor circuit showed only about half as much fluorescence as WM21_018 during functional confirmation, so it may be that the lon sensor simply does not produce enough fluorescence to compete with pBbB8k-csg-amylase. However, as time passed, the fluorescence for the lon sensor alone here reached even higher values (above two million RFU) than those obtained for WM21_018 alone. Therefore, there may be some other factor at play that prevents the lon sensor circuit from maintaining access to cell resources. However, induced cells are clearly more fluorescent than uninduced cells, suggesting that this circuit may be able to report increased lon expression caused only by induction of a circuit.
In summary:- The cotransformations unexpectedly fluoresced less than sensor-alone cells
- Transformed cells expectedly increased in fluorescence over time
- Induced cotransformations expectedly fluoresced more than uninduced cotransformations.
- We conclude that this circuit is a successful reporter of differential expression of clpB when comparing induced to uninduced cells, but not when comparing induced cells to those containing only the sensor
P-values for lon Sensor Circuit (WM21_023)

Please check the experience tab of this circuit’s parts page for graphical representation of the data. Raw fluorescence data for this circuit can be found here.
WM21_024 (hslVU sensor)
Our DE gene analysis revealed that hslVU would be upregulated in response to the presence of an orthogonal circuit within the cell. We predicted that the pBbB8k-csg-amylase circuit would decrease the orthogonality of the cell, and the cotransformation of both the pBbB8k-csg-amylase circuit plasmid and our sensor circuit plasmid into a cell would have lower orthogonality than the insertion of the sensor circuit by itself, leading to higher average fluorescence values. Our second prediction was that we would observe higher average fluorescence in the transformed and cotransformed cells, as compared to the untransformed cells that did not contain the sfGFP coding region. Our final prediction was that average fluorescence values in the transformed and cotransformed cells would increase over time, as the pBbB8k-csg-amylase circuit imposed greater and greater strain on the host circuit functions.
For our statistical analysis, we performed three sets of unpaired t-tests at each time point we measured. These three comparisons were: induced vs. uninduced, induced vs. untransformed, and induced vs. the sensor alone. We were unable to demonstrate statistical significance between the uninduced and induced cells, indicating that induction does not make much of a difference in the orthogonality of this circuit, as measured by this sensor. The induced cotransformed cells had statistically significant average fluorescence values from the untransformed cells at certain time points (p-value<0.05). However, whether the uninduced cells fluoresced more than the cells containing only the sensor circuit varied from replicate to replicate. We were also unable to find statistical significance between the induced contransformed cells and the cells containing only our sensor circuit.
It was difficult to achieve statistical significance in our data due to a low number of trials, however we observed several interesting trends. The untransformed NEB5-alpha cells stayed at a consistently low fluorescence given their lack of a fluorescence gene, establishing them as a good negative control for our experiment. We also generally observed an increase in fluorescence at a decreasing rate over time after subculturing at t0.
We likely obtained these results because the marginal strain imposed on the host cell by the pBbB8k-csg-amylase circuit was not higher than the strain already imposed by our sensor circuit. The high average fluorescence values in transformed and cotransformed cells indicate that our sensor circuit was functional, but we would have to conduct additional trials to determine whether or not our sensor circuit was truly able to sense the difference in orthogonality due to the circuit of interest. Further trials would also elucidate whether the temporal differences in significance persist when comparing induced vs. untransformed cells.
In summary:- The hslVU sensor circuit cotransformed with the induced pBbB8k circuit was expected to have increased fluorescence over time, with greater fluorescence than the culture of hslVU with uninduced pBbB8k and the culture of hslVU alone
- The average fluorescence of the induced cotransformed cells was significantly higher than that of the untransformed negative control
- Average fluorescence for all cells containing the hslVU sensor circuit generally increased over time
- We were unable to statistically determine whether there was a difference in average fluorescence between the transformed and cotransformed cells, regardless of the state of induction
- These results suggest that the pBbB8k-csg-amylase circuit may not have a more detrimental effect on the cell than that imposed by the hslVU sensor circuit by itself.
P-values for hslVU Sensor Circuit (WM21_024)

Please check the experience tab of this circuit’s parts page for graphical representation of the data. Raw fluorescence data for this circuit can be found here.
WM21_021 (dnaKJ Sensor)
Our analysis of the differentially expressed genes informed us that heat-shock response genes dnaK and dnaJ were highly upregulated upon introduction of a heterologous circuit. Our first prediction was that if the sensor circuit was functional, meaning the dnaKJ operon promoter is expressed to produce sfGFP, we expected to observe an increase in average fluorescence in both co-transformed and single-transformed cells when compared to untransformed cells. Our second prediction was that having an additional plasmid, pBbB8k-csg-amylase, would yield higher average fluorescence results in the co-transformed cells (both induced and uninduced) when compared to cells transformed only with the dnaKJ sensor. Lastly, our third prediction was that induction of pBbB8k-csg-amylase would lead to higher average fluorescence values in cells compared to uninduced ones as Birnbaum et al. (2021) had previously characterized the induction-dependent activity of pBbB8k-csg-amylase. With the activated plasmid, we would expect a higher degree of interaction between the host cell and the circuit, which could potentially induce the dnaKJ operon promoter more, indicating that the cells are under stress conditions due to heterologous gene expression.
Looking at the results of our flask experiments, the average fluorescence is higher at every time point for the induced and uninduced co-transformed, and single-transformed cell samples compared to the untransformed NEB5-alpha cells. This supports our first prediction that the dnaKJ sensor is indeed functional in cells after transformation and leads to an increased fluorescence production.
When comparing the average fluorescence values from cells transformed only with the dnaKJ sensor and those co-transformed with the dnaKJ sensor and pBbB8k-csg-amylase (induced and uninduced), the cells with only our sensor circuit had significantly higher average fluorescence at the 6 hour mark compared to the induced pBbB8k-csg-amylase and the sensor circuit containing cells (p-value<0.05). Although a statistical significance was not found at other time points for this comparison, the graph of our fluorescence data shows consistently higher fluorescence for cells with the sensor circuit alone at the 1, 6, 12, and 48 hour marks as well. These results do not support our second prediction that the co-transformed cells would exhibit a higher average fluorescence overall.
Interestingly, we saw that the co-transformed cells with induced and uninduced pBbB8k-csg-amylase had a higher average fluorescence than the cells with the dnaKJ sensor alone at the 24 hour time point. This led us to consider the growth dynamics of induced and uninduced cells for explaining the possible delay in sfGFP accumulation. Looking at our OD600 data, we observed a higher growth rate for the cells with only the dnaKJ sensor, between hours 1 and 48, compared to both induced and uninduced co-transformed cells for all samples. This could explain the high average fluorescence values for cells with the dnaKJ sensor alone at most time points as those cells are expected to reach the log phase for growth earlier than the co-transformed cells, which could lead to an earlier onset of stress-response at the dnaKJ operon due to unwanted interactions between the host cell and the sensor circuit.
Lastly, evaluating the effect of inducing pBbB8k-csg-amylase on the dnaKJ operon promoter, our results indicated that, only at 24 hours post-induction, the induced cells had a significantly higher average fluorescence compared to uninduced cells (p-value<0.05). At other time points, the average fluorescence of the uninduced cells were consistently higher than those of induced. These results do not support our third prediction that the induction of pBbB8k-csg-amylase would lead to higher expression of the dnaKJ operon promoter than the uninduced samples which would have led to higher fluorescence values.
Overall, these results confirm the functionality of the dnaKJ sensor in both single-transformed and co-transformed cells. Although our results do not support that cells with plasmids co-transformed induce higher levels of expression at the dnaKJ operon promoter compared to cells with only the sensor circuit transformed, we could explain this difference by inferring temporal variance of the degree of circuit-host cell interactions based on the different growth rates of samples. Additionally, our observation that the uninduced cells led to dnaKJ operon promoter expression at higher levels than the induced cells did not support our prediction of active transcription of a circuit imposing a higher stress, thus higher dnaKJ operon promoter activity. We would have to conduct further experiments with a larger sample size to fully understand the behavior of the dnaKJ sensor in response to co-transformation of two plasmids.
In summary:- Our design for the dnaKJ sensor (WM21_021) was confirmed to be functional in responding to an addition of a plasmid which in our design was co-transformation with pBbB8k-csg-amylase into NEB5-alpha cells
- The sensor detected dnaKJ operon promoter expression levels that were higher in cells with only the dnaKJ sensor alone compared to both the induced and uninduced co-transformed cells
- Induced co-transformed cells overall exhibited less expression at the dnaKJ operon promoter compared to the uninduced cells.
P-values for dnaKJ Sensor Circuit

Please check the experience tab of this circuit’s parts page for graphical representation of the data. Raw fluorescence data for this circuit can be found here.
ibpAB-GFP Sensor [by Ceroni et al. (2018)]
Our analysis of the differentially expressed genes informed us that heat-shock response genes ibpA and ibpB were highly upregulated upon introduction of a heterologous circuit. Our first prediction was that if the sensor circuit was functional which would be in support for results from Ceroni et al. (2018), meaning the ibpAB operon promoter is expressed to produce sfGFP, we expected to observe an increase in average fluorescence in both co-transformed and single-transformed cells when compared to untransformed cells. Our second prediction was that having an additional plasmid, pBbB8k-csg-amylase, would yield higher average fluorescence results in the co-transformed cells (both induced and uninduced) when compared to cells transformed only with the ibpAB-GFP sensor. Lastly, our third prediction was that induction of pBbB8k-csg-amylase would lead to higher average fluorescence values in cells compared to uninduced ones as Birnbaum et al. (2021) had previously characterized the induction-dependent activity of pBbB8k-csg-amylase. With the activated plasmid, we would expect a higher degree of interaction between the host cell and the circuit, which could potentially induce the ibpAB operon promoter more, indicating that the cells are under stress conditions due to heterologous gene expression.
Looking at the results of our flask experiments, the average fluorescence is higher at every time point for the induced and uninduced co-transformed, and ibpAB-GFP sensor single-transformed cell samples compared to the untransformed NEB5-alpha cells. This supports our first prediction that the ibpAB-GFP sensor is indeed functional in cells after transformation and leads to an increased fluorescence production.
Comparing the induced co-transformed cells and the single-transformed cells, there was significantly higher average fluorescence at time points 12 and 24 for the induced co-transformed samples. Although not significant, from time points 6 to 48, the induced cells consistently seem to have the highest average fluorescence values, with the uninduced cells having the second highest average fluorescence values and the cells with only the ibpAB-GFP sensor having the lowest average fluorescence in comparison. These results support our second prediction that having an additional plasmid with our sensor circuit would induce higher expression at the ibpAB operon promoter due to heat-shock response resulting from increased load of host-circuit interactions.
Lastly, when comparing the induced and uninduced cells co-transformed with pBbB8k-csg-amylase and the ibpAB-GFP sensor, our results indicate that only at time point 12, the average fluorescence of the induced cells were higher than those of uninduced. At other time points, though not statistically significant, the average fluorescence values for the induced cells were consistently higher than the uninduced cells between time points 12 to 48. Although these time points are past the healthy log-phase growth for E. coli cells, the overall comparison could potentially indicate a greater accumulation of sfGFP in the induced cells, which is also supported by our number of sfGFP molecules per cell data, by the end of the log-phase growth. Overall, these results support our third prediction that induction of the pBbB8k-csg-amylase in cells would increase potential interactions between the circuit and the cell more than the uninduced cells, thus leading to higher expression levels at the ibpAB operon promoter as indicated by sfGFP production.
Overall, these results functionally confirm the ibpAB-GFP sensor plasmid which was designed and previously tested by Ceroni et al. (2018). Our results further confirm the functionality of this sensor when it is co-transformed with the pBbB8k-csg-amylase plasmid. When comparing the cells with only the ibpAB-GFP sensor to those with both induced and uninduced co-transformed cells, our data showed that both the induced and uninduced cells exhibited higher fluorescence than the cells with the sensor alone which indicated that the presence of a second circuit induced ibpAB-GFP sensor expression. Lastly, the highest fluorescence was observed in the induced cells which supported that induced and actively expressed plasmid were leading to higher levels of ibpAB operon promoter expression than when they were not induced. Together, these results suggest that the ibpAB-GFP construct designed by Ceroni et al. (2018) has potential to be used as a sensor of ibpAB operon, containing genes ibpA and ibpB, expression which was a highly common DE gene from our RNA-seq analysis.
In summary:- The ibpAB-GFP sensor construct (Ceroni et al., 2018) was confirmed to be functional in responding to an addition of a plasmid which in our design was co-transformation with pBbB8k-csg-amylase into NEB5-alpha cells
- The sensor detected ibpAB operon promoter expression levels that were higher in cells with both the induced and uninduced co-transformed cells compared to only the ibpAB-GFP sensor alone
- Induced co-transformed cells overall exhibited higher expression at the ibpAB operon promoter compared to the uninduced cells
P-values for ibpAB-GFP Sensor Circuit

Please check the experience tab of this circuit’s parts page for graphical representation of the data. Raw fluorescence data for this circuit can be found here.
groSL-sfGFP Sensor [by Ceroni et al. (2018)]
Our analysis of differential expression of groS, a heat-shock gene, showed that it was another gene that is upregulated when introduced to a heterologous circuit. Therefore, the expected trend in fluorescence was that the co-transformation of groSL and our test circuit pBbB8k-csg-amylase would display increasing fluorescence over time. It was also expected that the sample of groSL transformed with induced pBbB8k would fluoresce at a higher level than the groSL transformed with uninduced pBbB8k. This is because the arabinose-induced pBbB8k circuit would be promoting curli fiber production in the bacteria more than the uninduced circuit would, and this increased cell activity could cause a higher stress response in the host cells. Additionally, we expected the co-transformed cells to show greater fluorescence than the sensor circuit alone, due to the data suggesting that groS is upregulated in the presence of another circuit, which should promote the translation of more sfGFP in this circuit.
The fluorescence data does illustrate an increase in fluorescence over time in the induced co-transformed sample, where the fluorescence generally stayed low and more constant for the first 12 hours after induction, then increased steadily after that 12 hour point. This trend was consistent with our prediction of increasing fluorescence in the induced co-transformed sample, and was observed through all 3 test replicates. The uninduced co-transformed sample also shows an increasing trend, but different from our hypothesis, had a higher fluorescence than the transformed sample from 6 to 48 hours, and across all of our replicates. Again different from our hypothesis, through all replicates the culture of the groSL sensor circuit alone had greater fluorescence than the induced cotransformation, but approached or dropped below the level of fluorescence of the uninduced co-transformation over time. The groSL circuit alone sample increased at the greatest rate from the 6 to 12 hour time points, but for there is an average slight decrease in fluorescence at 12 hours, after which the trend is not consistent between replicates, but remains at a similar fluorescence to the uninduced cotransformation.
Although not all differences between sample fluorescence are statistically significant, much of this insignificance can likely be attributed to our N of only 3, and conducting more replicates may have differentiated more clearly between the fluorescence of samples. Evaluated through t-tests, based on the average fluorescence values between replicates at each time point, the differences between the fluorescence of the induced and uninduced co-transformations were only significant at the time T=12h, and the difference between the induced cotransformation and groSL circuit alone only significant at T=6h and T=12h (p-value<0.05). The difference between the induced co-transformation and the untranslated NEB5-alpha cells had more consistently significant results, at T=-1h, 1h, 12h, and 48h (p-value<0.05).
While these results were unexpected, the conversions of molecules of sfGFP, which used the optical density (OD) measurements to find the number of molecules per cell, helps to explain the trends. The induced and uninduced co-transformations showed very similar counts of molecules for T=-1 and T=0. However, from T=1, the first measurement point after induction, to T=6, the induced cells have a greater magnitude of sfGFP molecules, which follows with the expected behavior of the groSL circuit. This suggests that the individual cells of the induced co-transformation fluoresced more, but a lower density of cells produced less overall fluorescence in the sample. This also fits with the OD data, which indicates that the growth across all replicates of the induced co-transformation was lower than all other samples, and nearly constant, until after the 12 hour time point. Through all time points, the molecule amounts of the groSL circuit alone in NEB5-alpha were very similar to the molecule amounts of groSL transformed with uninduced pBbB8k. This again can be understood with the OD data, which shows that the groSL circuit alone experiences a greater rate of growth than the induced or uninduced co-transformation in only the first 24 hours of the measurement, which could explain why this sensor circuit alone fluoresced more in the first 24 hours of measurement, but varied against the fluorescence of the induced and uninduced samples from 24 to 48 hours. Although the molecule conversion data suggests that the groSL circuit may have fluoresced as expected, the discrepancy in the fluorescence data also suggests that the groSL circuit’s functionality is inhibited by the limits it places on cell growth after cotransformation with a heterologous circuit, displaying decreased orthogonality.
In summary:- The groSL sensor circuit cotransformed with the induced pBbB8k circuit was expected to increased fluorescence over time, with greater fluorescence than the culture of groSL with uninduced pBbB8k and the culture of groSL alone
- GroSL with induced pBbB8k experienced increasing fluorescence over time, but less fluorescence than either groSL with uninduced pBbB8k or groSL alone
- The molecule conversions of sfGFP per cell suggest that groSL with induced pBbB8k had greater fluorescence than the uninduced and groSL samples in certain time frames, but the overall fluorescence measured was decreased by less culture growth
- These results suggest that the groSL circuit functions as intended on the cell level, but its reduction in orthogonality within a cotransformation prevents effective measurement as intended
P-values for groSL-sfGFP Sensor Circuit

Please check the experience tab of this circuit’s parts page for graphical representation of the data. Raw fluorescence data for this circuit can be found here.
References
Alam, K. K., Tawiah, K. D., Lichte, M. F., Porciani, D., & Burke, D. H. (2017). A Fluorescent Split Aptamer for Visualizing RNA-RNA Assembly In Vivo. ACS synthetic biology, 6(9), 1710–1721. https://doi.org/10.1021/acssynbio.7b00059
Birnbaum, D., Manjula-Basavanna, A., Kan, A., Tardy, B., & Joshi, N. (2021). Hybrid Living Capsules Autonomously Produced by Engineered Bacteria. Advanced Science. 8(11), https://doi.org/10.1002/advs.202004699
Ceroni, F., Algar, R., Stan, G., & Ellis, T. (2015). Quantifying cellular capacity identifies gene expression designs with reduced burden. Nature Methods, 12(5):415-418. Doi: 10.1038/nmeth.3339
Ceroni, F., Furini, S., Gorochowski, T.E., Boo, A., Borkowski, O., Ladak, Y., Awan, A.R., Gilbert, C., Stan, G.V., & Ellis, T. (2018). Burden-driven feedback control of gene expression. Nat Methods, 15, 387–393. https://doi.org/10.1038/nmeth.4635
Protocols. Harvard OPTI POLY.https://2017.igem.org/Team:Harvard/Protocols.
Quantitation of Green Fluorescent Protein in Microplates using the FL600. (2006). Retrieved October 18, 2021, from www.biotek.com/resources/docs/FL600_Quantitation_of_Grn_Fluorescent_Proteins_in_Microplates.pdf
Weiße, A. Y., Oyarzún, D. A., Danos, V., & Swain, P. S. (2015). Mechanistic links between cellular trade-offs, gene expression, and growth. Proceedings of the National Academy of Sciences, 112(9).