Team:William and Mary/Proof Of Concept
Proof of Concept
The goal of our project was to develop an accessible toolkit to assess the orthogonality of genetic circuits to the host. This toolkit consists of [1] a system of sensor circuits designed to measure aspects of orthogonality and [2] models into which measurements from our circuits can be inputted to provide an assessment of a circuit’s overall orthogonality. Our models include: [a] a mechanistic model of ODEs coupling classical models of metabolic burden in E. coli and markers of orthogonality derived from analyzing RNA-sequencing data; this model incorporated additional markers of burden including post- translational modifications; and [b] a purely data-driven model developed from RNA-seq datasets which outputs a quantitative evaluation of orthogonality that goes beyond burden using inputs from our circuits. We were able to develop this system, take measurements from our sensor circuits, input the values into our model, and provide an assessment of the orthogonality of a genetic circuit, thus providing successful proof of concept.
To test our system, we used the pBbB8k-csg-amylase “test” circuit. We obtained fluorescent measurements from each of our circuits, converted them to the number of molecules ("Quantitation of Green Fluorescent Protein," 2006), and input the measurements from our sensor circuits into the mechanistic/metabolic model. After the data from our sensor circuits was put into the model, we ran the model and obtained the following results.
The model predicts that after 6 hours, mRNA transcripts encoding the following major protein groups were upregulated in response to circuit induction: metabolic proteins, housekeeping proteins, transport proteins, and ribosomes. In addition, our transcriptional aptamer circuit shows upregulation in response to circuit induction. These data suggest that the cells did not experience significant burden at the transcriptional level.
Our model also predicted that, on the translational level, after 12 hours, most metabolic proteins, transport proteins, and ribosomes were predicted to be downregulated while housekeeping proteins were predicted to be upregulated. This suggests significant translational burden on the cell. Finally, the model predicted that on the level of post-translational modifications (as assayed by protease activity) remains relatively stable.
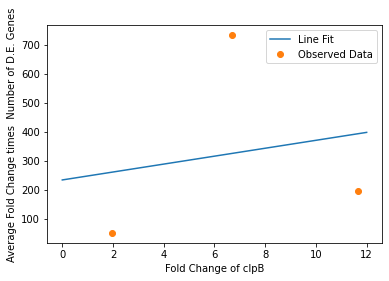
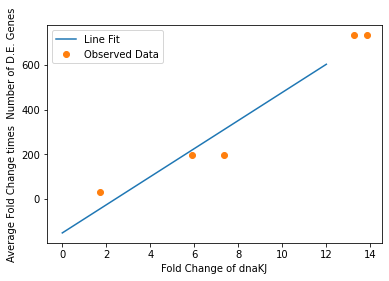
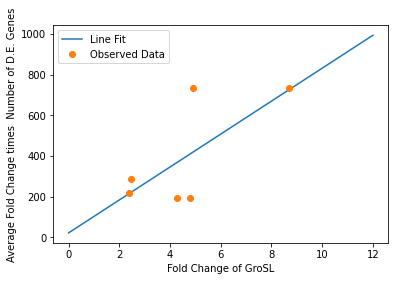
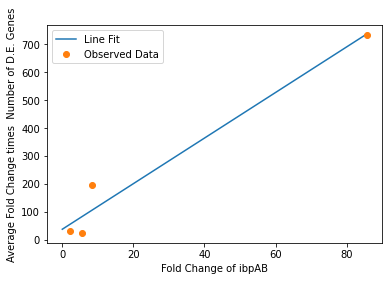
We also used our circuit measurements as input for the second data driven (from RNA-seq data) model which outputs a quantitative evaluation of orthogonality that goes beyond burden. Basically we developed an equation that assigned an orthogonality score between 0 (orthogonal) and 1 (non-orthogonal) from the weighted values of the input from the genes in our circuits. To determine the weight of each gene, we used RNA-seq data. We plotted the fold change of the marker gene for a given circuit versus the product of the average fold change of all the differentially expressed genes and the number of DE (differentially expressed) genes in that particular RNA-seq experiment. A function was generated to fit the data and was used to determine the gene’s weight for the equation to determine the orthogonality score.
Due to the limited size of our data set, in many cases we were unable to see an overarching functional form. As a result, we fit all of our data points to a linear model to generate fit parameters for assessing the overall orthogonality, giving us the total equation
\[O=\frac{1}{5}\frac{1}{733.5} (\left(\textrm{groSL FC}\right)\cdot A+B+\left(\textrm{clpB FC}\right)\cdot C+D+F\left(\textrm{dnaKJ FC}\right)+G+H\left(\textrm{ibpAB FC}\right)+I)\]
Where FC refers to fold change and O is orthogonality and A,B,C,D,F,G and H are the fit parameters \(A=81.1,B=21.4,C=13.7, D=234.23,F=62.9,G=0,H=8.17*ibpAB+38.0\). H is set to 0 as the fit predicts a non-physical negative intercept for dnaKJ. The \(\frac{1}{5}\) term arises from the fact that this is the average of 5 marker genes and the \(\frac{1}{733.5}\) is a scaling term designed to provide a reasonable limit to non-orthogonality, as derived from our analysis of the literature on RNA-seq. This equation provides the framework and the general idea for calculating orthogonality from the fold change of a select genes, but the relatively small size of the data points available means it is highly sensitive to outliers and non-physical results had to be abstracted away from the fit in order to produce an equation. Nevertheless, as the available data increases this model is simple to implement by refitting to multiple points.
After inputting our values from our circuits, we obtained an orthogonality score of 0.18 suggesting that, while translational burden played a significant role in overall non-orthogonality, the pBbB8k-csg-amylase circuit did demonstrate some degree of non-orthogonality due to factors beyond classic burden.
The summary data for these conclusions and proof of concept are shown below.
Model A: a mechanistic model of ODEs coupling classical models of metabolic burden in E. coli and markers of orthogonality derived from analyzing RNA-sequencing data; this model incorporated additional markers of burden including post- translational modifications.
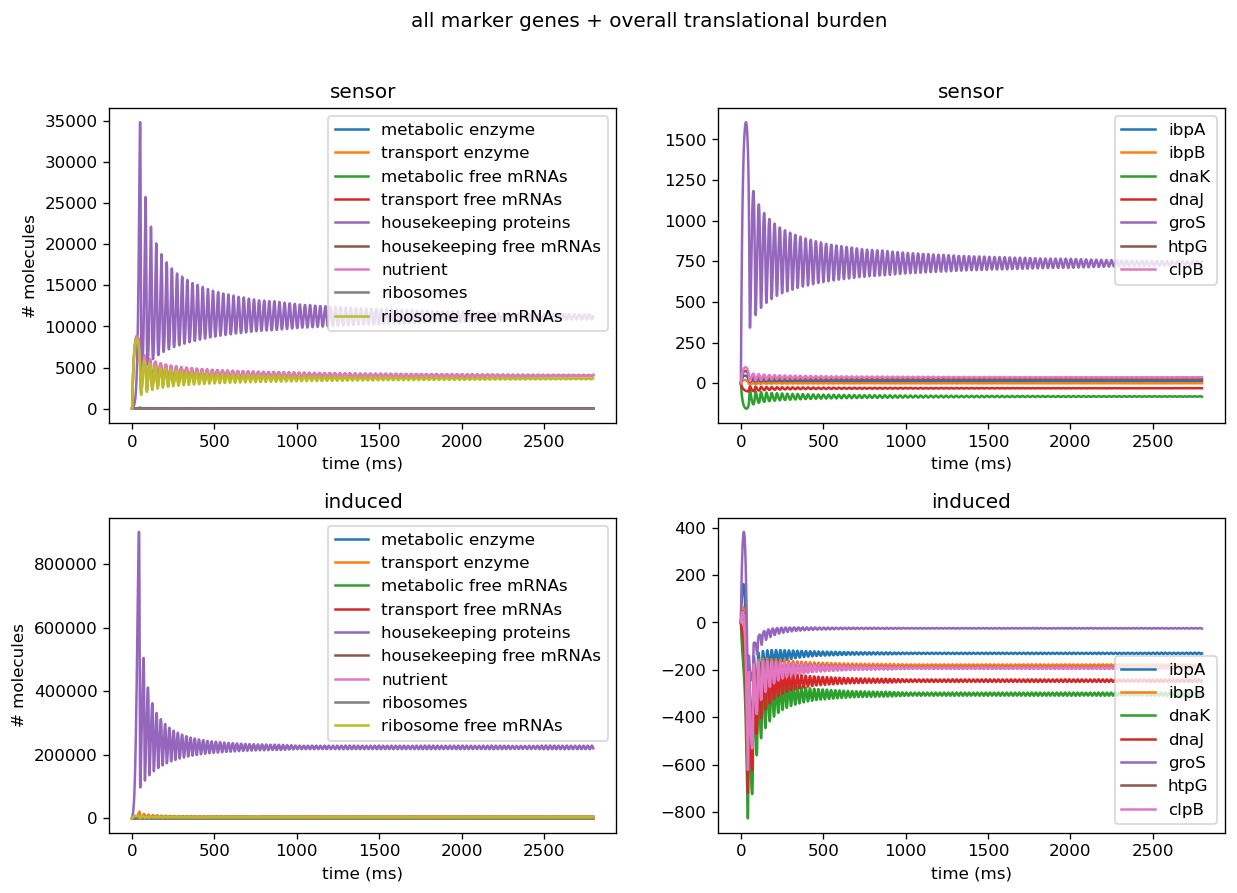
Figure 1: Left: number of proteins, transcripts, mRNAs, and mRNA-protein complexes for various proteins, proteases in the cell for cell with sensor alone (top) and cell cotransformed with sensor and induced test circuit (bottom) based on parameters from the literature. Right: number of markers in cell with sensor alone (top) and cell cotransformed with sensor and induced test circuit (bottom) based on measurements from our circuits.

Figure 2: This figure shows the relative number of fluorescent aptamers (y axis) over time (x axis) for the 3WJ Broccoli circuit alone (sensor), untransformed BL21(DE3) cells in addition to the 3WJ Broccoli circuit (untransformed+sensor), and the 3WJ Broccoli circuit cotransformed with the induced test circuit (sensor+induced).
To convert fluorescence of the 3WJ Broccoli circuit to a relative number of fluorescent aptamers, we adapted the formula y = 623.5x − 1580 from Figure 1 of the source “Quantitation of Green Fluorescent Protein in Microplates Using the FL600” and scaled to the molecular weight of the dye DFHBI-1T, which binds to the 3WJ Broccoli aptamer (Alam et al., 2017). We then normalized the relative number of fluorescent aptamers to the approximate number of cells per sample.
Model B: a purely data-driven model developed from RNA-seq datasets which outputs a quantitative evaluation of orthogonality that goes beyond burden using inputs from our circuits
Future Directions:
References
Alam, K. K., Tawiah, K. D., Lichte, M. F., Porciani, D., & Burke, D. H. (2017). A Fluorescent Split Aptamer for Visualizing RNA-RNA Assembly In Vivo. ACS synthetic biology, 6(9), 1710–1721. https://doi.org/10.1021/acssynbio.7b00059
Quantitation of Green Fluorescent Protein in
Microplates using the FL600. (2006). Retrieved October 18, 2021, from www.biotek.com/resources/docs/FL600_Quantitation_of_Grn_Fluorescent_Proteins_in_Microplates.pdf