Team:The Webb Schools/Model
Model
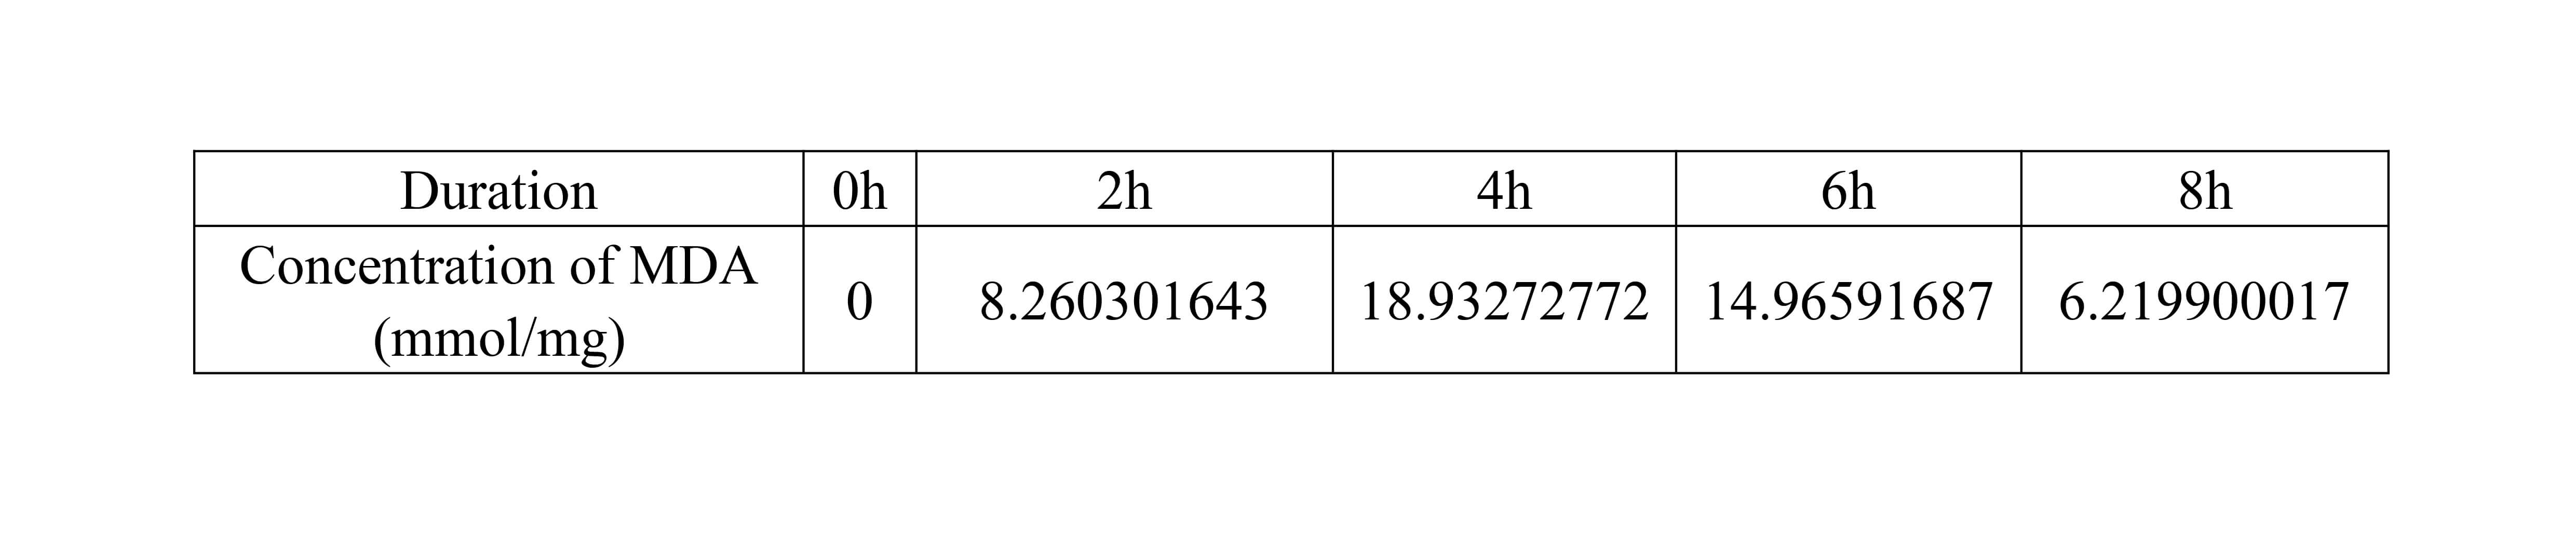
In order to further monitor the performance of our
engineered strains, we measured the concentration of MDA in bacteria C (efeB-amilGFP) system during 8 hours
where the initial concentration of H2O2 was 2.5mM.
Table 1. the concentration of MDA in bacteria C system
For quantifying the relationship between the concentration
of MDA and the hours in bacteria C system, we firstly attempted to use the quadratic function y =
at2 + bt + c which is
usually applied in the kinetic models of chemical reactions to fit our data. However, the fitting degree of
the quadratic function is only 0.95 which is quite lower than our expectation as showing in the figure 1.
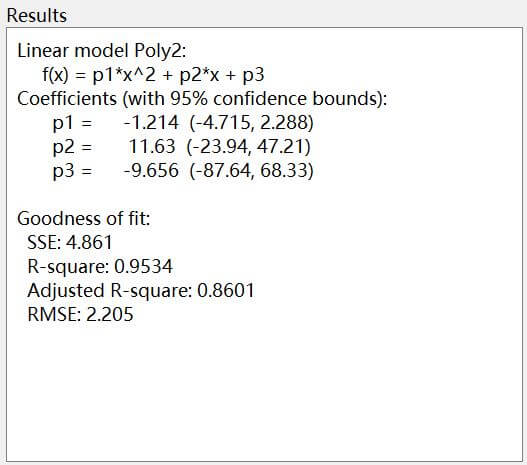 Figure 1. Modeling results of y =
at2 + bt + c
Figure 1. Modeling results of y =
at2 + bt + c
Therefor, we decided to adopt our data to the cubic
function:
y = at3 + bt2 + ct + d
Following are the modeling results with a surprising
fitting degree, 1 which could indicate the relationship between the MDA level and the time duration is more
likely tending to the cubic function model.
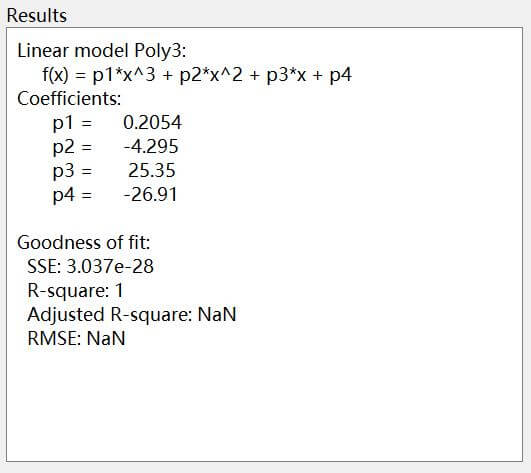 Figure 2. Modeling results of y = at3 + bt2 + ct + d
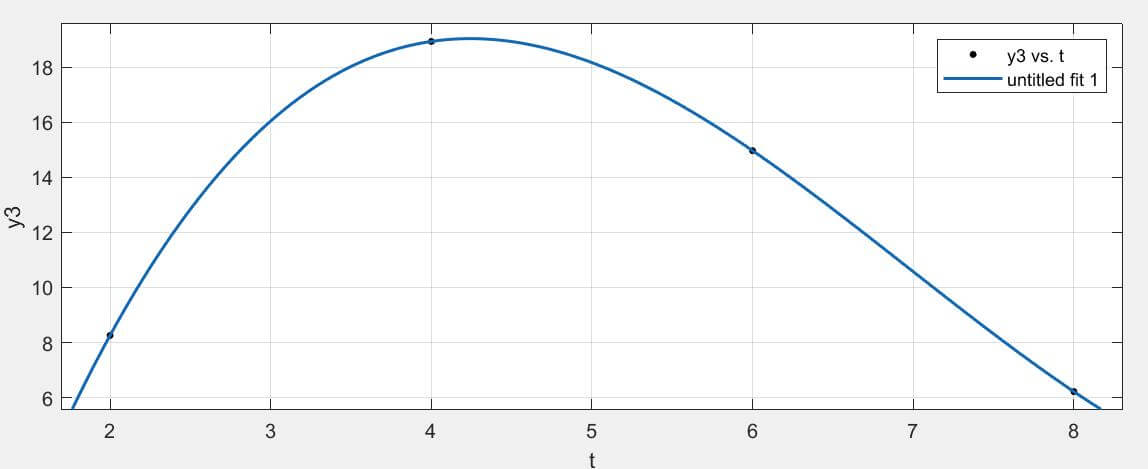 Figure 3. The curve of y = at3 + bt2 + ct + d model
According to the function that we solved to fit the
relationship model between the concentration of MDA and the hours in bacteria C system, we could see that
the MDA level starts to decrease in 4 hours around after the strain enters into the system. In that moment,
the inhibition capacity of our engineered strain which could secret efeB enzyme exceeded the generative
capacity of MDA. Once we collect more data regarding various concentration of H2O2, we could adjust them to
this model to further determine the hours as a reference that our product would take effects in human body
with different levels of depression (oxidation).