Team:NJU-China/Model
Models
Plasmid and mcDNA intracellular degradation time model
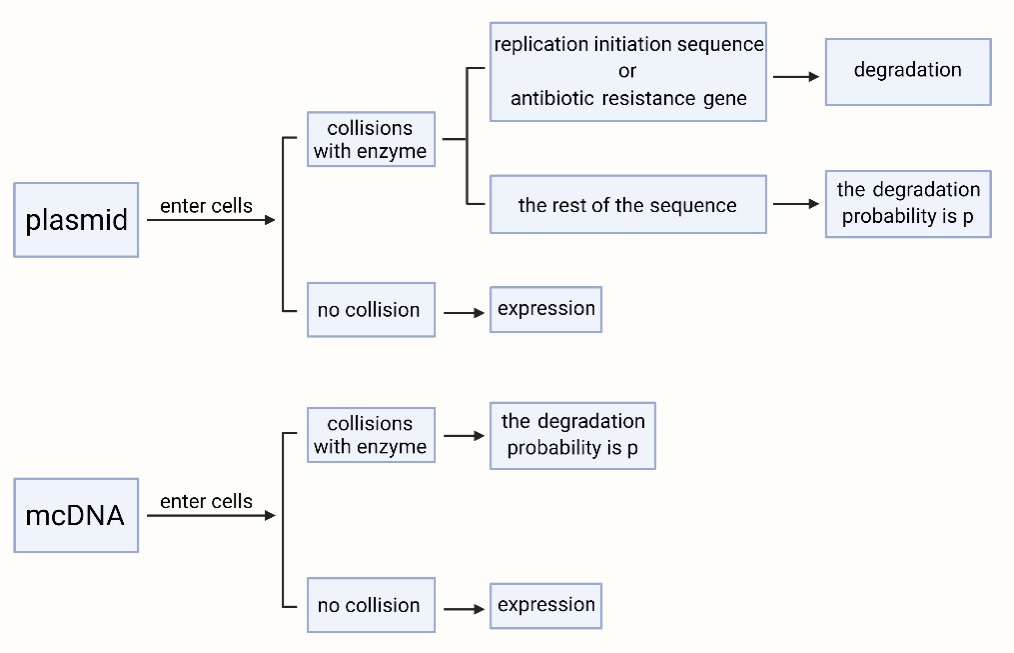
It is known that the plasmid is a larger circular DNA with a replication initiation sequence and an antibiotic resistance gene, while the mcDNA is smaller without these two sequences.
Hypothesis: After the plasmid or mcDNA enters the cell, it collides with the enzyme randomly, and the enzyme has no loss. If the collision site is a common sequence, the DNA has a 50% probability of degradation. If the collision site is the replication initiation sequence of the plasmid and the antibiotic resistance genes, the plasmid is recognized as a foreign substance and must be degraded.
Assuming that these molecules are doing Brownian movement, that the velocity satisfies the MB distribution, and that these molecules can be regarded as spheres.
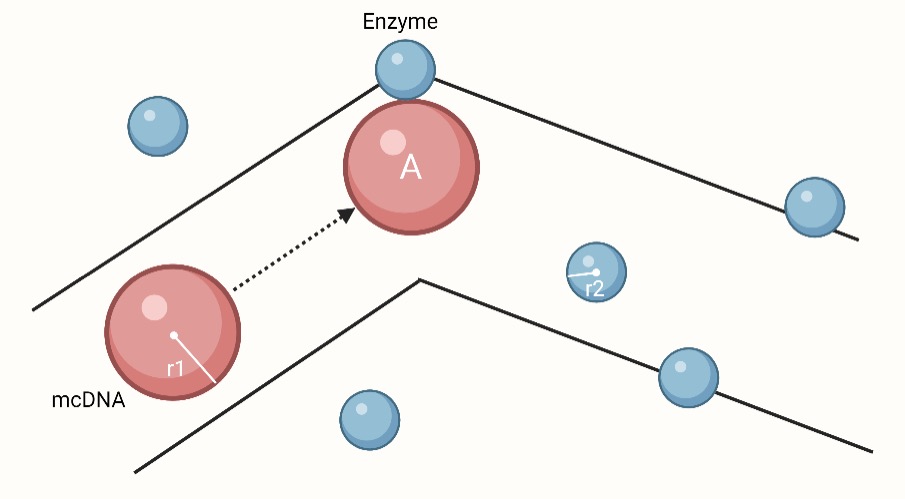
Take mcDNA as an example:
Suppose the size of mcDNA is $s$, the radius is $r_1$, the mass is $m_1$, the mean-square speed is $v_1^2$, the numerical density is $n_1$, the radius of the enzyme is $r_2$, the mass is , and the mean-square speed is $m_2$, the numerical density is $v_2^2$, the probability of collision for degradation is $p$, the cell volume is $V$, and the collision distance is $r_1+r_2$.
Based on Brownian movement:
$$E_k=\frac{1}{2}m_1v_1^2=\frac{2}{3}kT$$ $$v_1^2=\frac{3kT}{m_1}$$
Similarly, $v_2^2$ also can be proved.
Then, $v_1^2+v_2^2$ is the mean square speed of relative motion, $\sqrt{v_1^2+v_2^2}$ is the root-mean-square speed of relative motion. Set $\sqrt{v_1^2+v_2^2}$ as $v$, which is the average relative velocity.
Imagine tracking how many enzymes one mcDNA molecule A can collide with during the $t$ time period. We think that other molecules are stationary, and molecule A moves at an average relative velocity $v$. During the movement of molecule A, only enzyme molecules whose center and the center of A have a distance which is less than or equal to $r_1+r_2$ can collide with A. Drawing a distorted cylinder whose axis is the trajectory of the moving molecule A’s center with a radius of $r1 + r2$, all the enzyme molecules whose center is within the range of the cylinder would clash with molecule A, and the rest of the enzyme molecules will not collide with A. The cross-sectional area of the cylinder is $\sigma =\pi(r_1+r_2)^2$, which is the collision area between mcDNA and enzyme. The distance traveled by molecule A in $t$ is $vt$, the volume of the corresponding cylinder is $\sigma vt$, and the number of enzymes in the cylinder is $n_2\sigma vt$.
Thus, one mcDNA can collide with the enzyme $n_2\pi(r_1+r_2)^2 vt$ times in the time period $t$.
When $n_2\pi(r_1+r_2)^2 vt=1$, $t=\dfrac{1}{n_2\pi(r_1+r_2)^2 v}$, which is the average time for a collision between one mcDNA and one enzyme. And the time for all mcDNAs in the cell to collide once with enzymes is $t'$, $t'=\dfrac{1}{n_1Vn_2\pi(r_1+r_2)^2 v}$. The DNA concentration gradually decreases with time, and the collision time also changes.
The initial numerical density of mcDNA is $n_{10}$.
$$ \begin{aligned} -V\cdot dn_1 &= \frac{dt}{t'}=pn_1n_2V\cdot \pi(r_1+r_2)^2v\cdot dt \\ n_1 &= n_{10} \exp\big(-p\pi n_2(r_1+r_2)^2vt\big) \end{aligned} $$
Similar with the plasmid.
syms n1 n2 p r12 v t;
parNam = [n2 r12 p v];
parVal_plasmid = [2.5*10^7 3042*10^(-10) 0.68 1.28];
parVal_mcDNA = [2.5*10^7 1412*10^(-10) 0.5 1.87];
coe = n2 * (r12^2) * p * v * 3.1415926 * 3600 * 24;
n_plasmid_coe = eval(subs(coe,parNam,parVal_plasmid));
n_mcDNA_coe = eval(subs(coe,parNam,parVal_mcDNA));

n_plasmid = 1*exp(-n_plasmid_coe*t);
n_mcDNA = 2*exp(-n_mcDNA_coe*t);
figure(1);
fplot(n_plasmid,[0 20]);
hold on;
fplot(n_mcDNA,[0 20]);
grid on;
xlabel('Time');
ylabel('Relative Quantity');
text(20,0,'Days');
legend('plasmid','mcDNA');
title('The Duration of mcDNA and Plasmid');
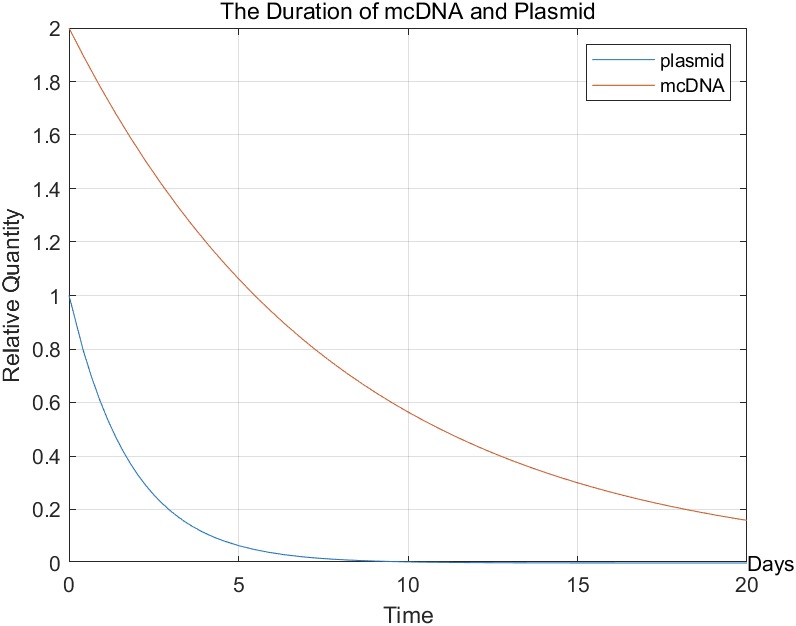
We can see that mcDNA can stay in the cell longer than plasmids. Therefore, we chose mcDNA instead of plasmid as the carrier, which could theoretically prolong the treatment time.
| Parameter | Plasmid | mcDNA |
|---|---|---|
| $n_{10}$ | $2\times 10^{32}/m^3$ | $4\times 10^{32}/m^3$ |
| $s$ | $7327 bp$ | $3325bp$ |
| $r_1$ | $2985Å$ | $1355Å$ |
| $m_1$ | $8.27\times10^{-21}kg$ | $3.75\times10^{-21}kg$ |
| $v_1^2$ | $1.55m^2/s^2$ | $3.42m^2/s^2$ |
| $n_2$ | $2.5\times 10^7 /m^3$ | $2.5\times 10^7 /m^3$ |
| $r_2$ | $5.7Å$ | $5.7Å$ |
| $m_2$ | $1.6\times10^{-19}kg$ | $1.6\times10^{-19}kg$ |
| $v_2^2$ | $0.08m^2/s^2$ | $0.08m^2/s^2$ |
| $v$ | $1.28m/s$ | $1.87m/s$ |
| $p$ | $68%$% | $50%$ |
| $k$ | $1.380649\times 10^{-23}J/K$ | $1.380649\times 10^{-23}J/K$ |
| $T$ | $310K$ | $310K$ |
mcDNA transcription and interference model
This article establishes a mathematical model of mcDna entering cells and transcribing, in which degradation of mcDNA and transcriptional siRNA by intracellular environment are taken into consideration.
Hypothesis
- During the simulation, cells did not undergo mitosis or death.
- No other drugs are given during this stimulation.
Description of the process
Phase One: mcDNA enters cells
Hypothesis:
- The cell membrane surface is large enough relative to a certain number of circular DNA that receiving equipment is adequate. Therefore, each acceptance process does not interfere with each other, meaning that they are independence of each other.
- Ignore the probability and time of the process of circular DNA from the external environment to the cell surface.
Assuming that success rate of each entry process is a (0<a) and the average entry time is $t_0$.[1] As each process of entry is independent, It can be assumed that the time consumption of any entry process accords with probability distribution of any entry process. In this article, uniform distribution ranging $0~2t_0$ is applied.
For the number of circular DNA is n, the mathematical expectation of the number of DNA that enters the cells is $E(N1)=a\times n$, while the mathematical expectation of the time consumption is $E(T1)=t_0$.
Phase Two:
summary:
When the transcription to produce siRNA has started, the total number of circular DNA as well as the concentration of siRNA produced by transcription degraded by the internal environment at the same time. Assuming that the transcription process is the result of the collision of transcription components with circular DNA, the reaction rate is directly proportional to the current concentration.
Suppose the time is t, started from 0, and the number of mcDNA in the internal environment is $N_1$.
In unit time, the degradation rate of $N_1$ is proportional to its concentration.
$$\frac{dN_1}{dt} = -A\times N_1(1)$$
Where A is a constant related to the degradation rate.[2]
According to the formula above:
$$N_1(t)=N_1(0)\times\exp(-A\times t)$$
Assuming that the number of siRNA in the internal environment is $N_2$, $N_2$ is affected by two factors, the production of $N_1$ and the degradation of $N_2$.
$$\frac{dN_2}{N_t}=N_1\times B - N_2\times C$$
Where $B$ is the rate parameter of siRNA production by transcription. $C$ is the rate parameter of siRNA degradation.
It is known that there are no transcripts at zero time, so $N_2(t=0)=0$.
We have
$N_2(t)=N_1(0)\times \frac{B}{C-A}\times(e^{-A\times t} - e^{-C\times t})$
The formula above is the expression of siRNA at any time $t$ after mcDNA enters the cell.
Code:
n = 1;
a = 0.35;
A = 0.0069;
B = 3.5/60;
C = 0.0499;
t = 0:0.5:50;
N10 = n*a;
N2 = N10*B/(C-A)*(exp(1).^(-A*t)-exp(1).^(-C*t));
figure
plot(t,N2);
title('The Expression of mcDNA');
xlabel('Time(min)');
ylabel('siRNA Quantity(\mumol)');
grid on
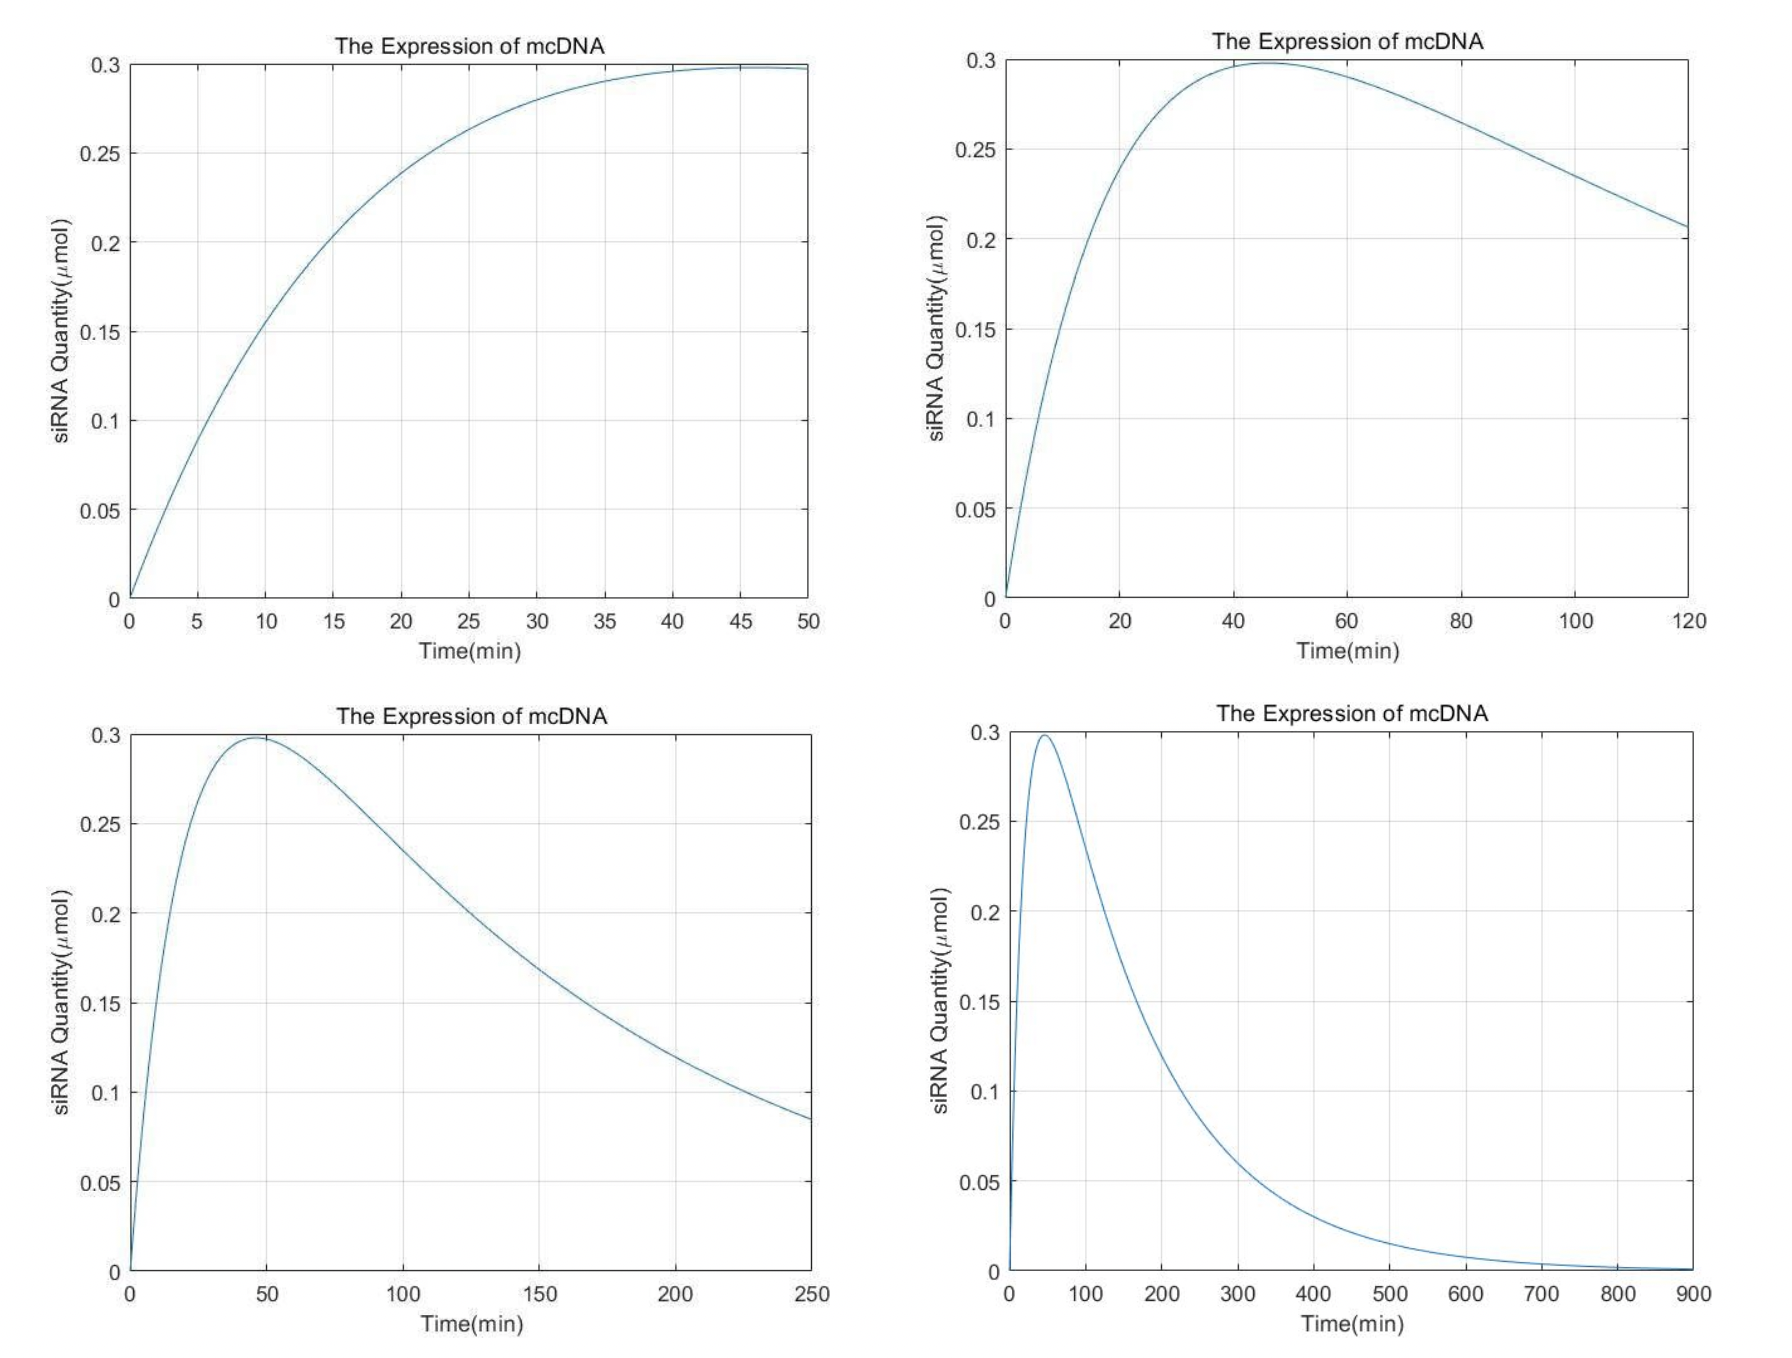
It can be seen that the content of siRNA reaches the peak within one hour. Then it slowly decreased. After 15h almost all of it was cleared by metabolism.
Parameters:
| $n$ | $1\mu\text{mol}$ |
|---|---|
| $a$ | $35%$ |
| $A$ | $0.0069\min^{-1}$ |
| $B$ | $3.5s^{-1}$ |
| $C$ | $0.0499\min^{-1}$ |
reference:
[1]Rim Yeri Alice,Nam Yoojun,Park Narae,Ju Ji Hyeon. Minicircles for Investigating and Treating Arthritic Diseases.[J]. Pharmaceutics,2021,13(5)
[2]Florence Faurez,Daniel Dory,Vincent Le Moigne,Rodolphe Gravier,André Jestin. Biosafety of DNA vaccines: New generation of DNA vectors and current knowledge on the fate of plasmids after injection[J]. Vaccine,2010,28(23)
[3] 郭佳佳,王建军,徐根兴.siRNA的体内递送及药物代谢动力学特性[J].药学与临床研究,2010,18(04):363-365+369.
Correlation model between incidence rate of asthma and environmental factors
According1 to previous literature review and interview research taken by our HP group, we obtained data on asthma incidence rate, air condition GDP and other things of several cities. These variables are reduced to a regression problem by machine learning. We chose to call the functions in sklearn to train the model and selected the function with the highest score. In this model, function BaggingRegressor() scored highest.
import numpy as np
import seaborn as sns
import matplotlib.pyplot as plt
from scipy.optimize import root,fsolve
import pandas as pd
import sklearn
import matplotlib.pyplot as plt

df = pd.read_csv('总表2.csv',encoding="ISO-8859-1")
re=df.iloc[:,2]
df=df.iloc[:,3:]


# sns.set(font_scale = 1)
# map=pd.read_csv('总表2.csv',encoding="ISO-8859-1").drop(labels='AQI',axis=1)
# sns.heatmap(map.corr())
# plt.show()

####3.8Bagging回归####
from sklearn.ensemble import BaggingRegressor
model_BaggingRegressor = BaggingRegressor()

df=np.array(df)
maxcols=df.max(axis=1)
mincols=df.min(axis=1)

data_shape = df.shape
data_rows = data_shape[0]
data_cols = data_shape[1]
t=np.empty((data_rows,data_cols))
for i in range(data_rows):
    t[i,:]=(df[i,:]-mincols[i])/(maxcols[i]-mincols[i])

x_train,x_test=t[:45], t[45:-1]

y_train,y_test=np.array(re.iloc[:45]),np.array(re.iloc[45:-1])

model_BaggingRegressor.fit(x_train, y_train)
score =model_BaggingRegressor.score(x_test, y_test)
Bj=np.array([[36102.6,2189,4216.5,507.9,0.119,0.685,0.133,0.446,0.187,0.247,0.112]])
result=model_BaggingRegressor.predict(Bj)
print(result)
The forecast is 1.8%. According to our previous interviews, the incidence of asthma in the Beijing area this year was about 2%. It indicates that our model can accurately predict the incidence of asthma according to environmental factors. In the future, governments may be able to use our model to predict morbidity and allocate healthcare resources in a timely manner.
We also analyzed the association between asthma incidence and environmental factors. View Human Practice for more information.
Verification of fusion protein
We constructed the fusion protein of CKLF1C19-Lamp2b and RGD-Lamp2b to target CCR3 and integrin separately. [1] There are two important features that we need to verify, the first is that these two fusion protein can successfully anchor on exosome membrane just as natural Lamp2b protein will do; the second is that our fusion protein can successfully target their receptor proteins.
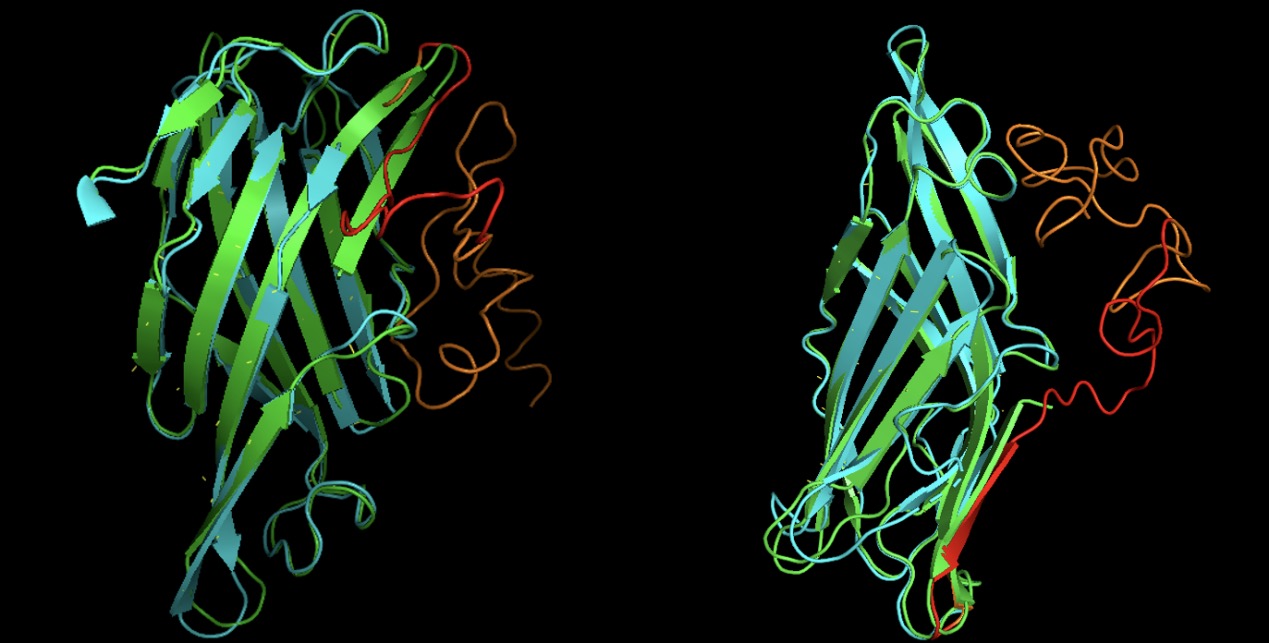
Our fusion proteins can successfully anchor on exosome membrane
By design, our fusion protein has transmembrane domain amino acid sequence just as natural Lamp2b protein does, but whether the structure of transmembrane domain of our fusion protein is the same as the natural Lamp2b is unknown. As a result, we using homologous modeling tool I-TASSER [2] with the help from ZJU-China to construct the protein structure of our two fusion protein CKLF1C19-Lamp2b and RGD-Lamp2b. Then we using alignment to compare the structure of the predicted fusion protein with the natural Lamp2b protein using PyMol. The result is shown in Fig. X. We see perfect alignment in the structure of transmembrane domain between our fusion proteins to natural Lamp2b protein, which indicates there is high possibility that our fusion protein can anchor on the exosome membrane just as we expected.
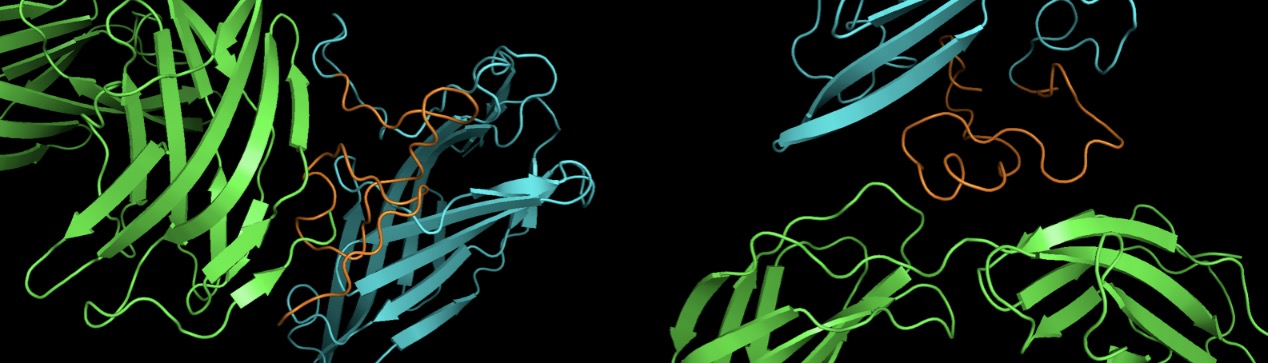
Our fusion proteins can successfully target their receptor proteins
Our selected targeting peptide is CKLF1C19 [3] and RGD [4], of which receptor protein is CCR3 and integrin respectively. We want to ensure that the fusion protein will not interfere with the structure or targeting ability of our selected targeting peptide, so we used rigid protein-protein docking tool ClusPro [5] to verify that our predicted structure of two fusion proteins CKLF1C19-Lamp2b and RGD-Lamp2b can successfully dock on their receptor protein by nature. The result shown in Fig. Y shows that just as we expected, the fusion proteins can successfully target on their receptor proteins.
Reference:
[1] Alvarez-Erviti L, Seow Y, Yin H, Betts C, Lakhal S, Wood MJ. Delivery of siRNA to the mouse brain by systemic injection of targeted exosomes. Nat Biotechnol. 2011;29(4):341-345.
[2] Roy A, Kucukural A, Zhang Y. I-TASSER: a unified platform for automated protein structure and function prediction. Nat Protoc. 2010;5(4):725-738.
[3] Tian L, Li W, Wang J, et al. The CKLF1-C19 peptide attenuates allergic lung inflammation by inhibiting CCR3- and CCR4-mediated chemotaxis in a mouse model of asthma [published correction appears in Allergy. 2019 Mar;74(3):639]. Allergy. 2011;66(2):287-297.
[4] Ruoslahti E. RGD and other recognition sequences for integrins. Annu Rev Cell Dev Biol. 1996;12:697-715.
[5] Kozakov D, Hall DR, Xia B, et al. The ClusPro web server for protein-protein docking. Nat Protoc. 2017;12(2):255-278.