Overview
To complement our tumor-minibrain co-culture platform, we designed and constructed a model, combining Michaelis-Menten kinetics, Hill cooperativity, and parametric analysis, to simulate our D-2-HG oncometabolite reporter system. In implementing our model, we aim use our findings to inform our engineering in the lab, specifically answering two questions:
- What is the D-2-HG reporter activation threshold in which our reporter will be activated?
- How should we tune the reporter activation threshold to match average dangerous levels of D-2-HG?
Deterministic Model Development
Conceptual Model
The D-2-HG oncometabolite reporter system in NODES is a two component system. The first component (BBa_K4046000 constitutively expresses the allosteric transcriptional regulator DhdR. The second component BBa_K4046990 is the reporter with a strong promoter and dhdO binding sites that responds to DhdR repression. We model the two systems separately at first, gathering variables involved in the mechanism and then creating a differential model for each component of the system. Using the developed model, we extracted quantitative metrics, including the Hill coefficient which provides the answer to our proposed questions. The model results will inform and drive decisions in system iterations in Phase II of our project.
Mechanism and Mathematical Model
Constitutive Expression of Reporters
RNA polymerase first binds to the promoter. This is modelled by the chemical equation and the corresponding mathematical equation:
$$ P + U \leftrightarrow A (\frac{k_1}{k_{-1}}) $$
$$ k_{D} = \frac{k_{-1}}{k_{1}} = \frac{[P][U]}{[A]}$$
P is RNA polymerase, U is the promoter region, and A is RNA polymerase-promoter complex. \(k_1\) is the association constant of the RNA polymerase and the promoter region, \(k_{-1}\) is the dissociation constant.
Once bound, the RNA polymerase initiates mRNA formation. This is modelled by the chemical equation and the corresponding mathematical equation:
$$ * \rightarrow m_{x} (k_{mRNA})$$
$$[U]_{0} = [U] + [A]$$
$$r_{mRNA} = \frac{d[mRNA]}{dt} = k_{mRNA}[A] = \frac {k_{mRNA}[P][U]_{0}}{k_{D} + [P]}$$
Assuming \([P] >> K_{D}\), we simplify the above equation to: $$r_{mRNA} = k{mRNA}[U]_{0},$$ as $$[A] = \frac{[P][U]_{0}}{k_{D} + [P]}$$
 is the initial
plasmid
DNA
copy
number.
\(k_{MRNA}\) is the rate of elongation of RNA polymerase.
is the initial
plasmid
DNA
copy
number.
\(k_{MRNA}\) is the rate of elongation of RNA polymerase.
The produced mRNA then undergoes translation by ribosomes. Translation is initiated by ribosome binding, which can be modelled by the chemical equation and the corresponding mathematical equation:
$$R + M \leftrightarrow C_{R} (\frac{k_{1R}}{k_{-1R}})$$
$$k_{DR} = \frac{k_{-1R}}{k_{1R}} $$
$$k_{DR} = \frac{k_{-1R}}{k_{1R}} $$
R represents ribosomes, M represents mRNAs, and C represents complexed mRNA-ribosomes. \(k_{1R}\) is the association constant of the ribosome and the mRNA, \(k_{-1R}\) is the dissociation constant.
Once bound, the ribosome initiates protein formation. This is modelled by the chemical equation and the corresponding mathematical equation:
$$ * \rightarrow TdTomato (k_{protein})$$
$$ r_{protein} = \frac{d_{protein}}{dt} = k_{E}[C_{R}] = \frac{k_{e}[R][M]_{0}}{k_{DR} + [R]}$$
\([M]_o\) is the initial mRNA copy number. \(k_E\) is the rate of elongation of ribosomes. Assuming \([M] >> [C]_R\), we simplify the above equation to:
$$ r_{protein} = \frac{k_{e}[R][M]}{k_{DR} + [R]} = k_{p}[M]$$, where $$k_{p} = \frac{k_{e}[R]}{k_{DR} + [R]}$$
DhdR Expression
DhdR is constitutively produced. Utilizing the methods derived above, this circuit can an be modeled by the transcription and translation equations:
$$\frac{d[mRNA,D]}{dt} = k_{mRNA}[U]_{0} - k_{decay,mRNA,D}[mRNA,D]$$
$$\frac{d[D]}{dt} = k_{p}[mRNA, D] - k_{decay,D}[D]$$
Where mRNA_D represents DhdR mRNA and D represents DhdR. However, because DhdR exist naturally as a dimer, we can further implement the equations:
$$ D + D \leftrightarrow D_{2} (\frac{k_{dim}}{k_{dim'}})$$
$$ \frac{d[D]}{dt} = k_{dim}[D]^{2} - k_{dim'}[D_{2}] - k_{decay,D_{D_2}[D_{2}]}$$
D2 represents the DhdR dimer. \(r_{D2}\) represent the rate of DhdR protein dimer formation. \(k_{dim}\) represents DhdR dimer association rate, while \(k_{dim’}\) represents dissociation rate. \(k_{decay, D2}\) represents the DhdR dimer decay rate.
Combining the expression of DhdR with dimerization calculations, we obtain:
$$ \frac{d[D]}{dt} = -k_{dim}[D]^{2} + k_{dim'}[D_{2}] + k_{p}[mRNA,d] - k_{decay,D}[D]$$
Reporter Expression: One dhdO Binding Site
We assume that because DhdR is stable under a dimerized state, it binds to the dhdO operator site as a dimer. Thus, when DhdR_2 is not present, the reporter circuit is activated and the signal is expressed.
$$* \rightarrow m_{x}(k_{mRNA})$$
$$r_{mRNA, constitutive} = k_{mRNA}[U]_{0}$$
However, because of constitutive expression, DhdR2 binds to the dhdO binding site and allosterically blocks the transcription of the reporter. This is modeled by the equations:
$$D_{2} + O \leftrightarrow D_{2}O (\frac{k_{DO}}{k_{DO'}})$$
$$* \rightarrow m_{x}(k_{mRNA})$$
$$K_{DO} = \frac{k_{DO}}{k_{DO'}} = \frac{[D_{2}][O]}{[D_{2}O]}$$
$$[O]_{T} = [O] + [D_{2}O]$$
$$[O] = \frac{K_{DO}[O]_{T}}{K_{DO} + [D_2]}$$
We know that the rate of transcription is proportional to the concentration of free operator sites, so:
$$\frac{d[mRNA]}{dt} = r_{mRNA, reporter} = r_{mRNA, constituitive}\frac{K_{DO}[O]_{T}}{K_{DO} + [D_{2}]}$$
Factoring in decay, we obtain:
$$\frac{d[mRNA, reporter]}{dt} = r_{mRNA, constitutive}\frac{K_{DO}[O]_{T}}{K_{DO} + [D_{2}} - k_{decay, mRNA}[mRNA, reporter]$$
We can then model translation by:
$$k_{reporter} = k_{protein}[mRNA, reporter] - k_{decay,reporter} [reporter]$$
\(k_{DO}\) represents the association rate between DhdR and dhdO, while \(k_{DO’}$\) represents the dissociation rate. \(r_{mRNA,reporter}\) represents the rate of change of reporter mRNA and \(r_{reporter}\) represents the rate of change of reporter protein.
After factoring in repression of DhdR and obtaining the rate of reporter mRNA and protein expression, we consider how other variables in the system change over time. The variables include \([D_2], [H], [D_2H], [O], [D_2O]\).
When present, D-2-HG binds to DhdR, releasing it from the binding site and therefore inhibiting DhdR repression. Under this state, D-2-HG could bind unbounded or bounded DhdR2. This two case process is modelled by the chemical formulas:
Case 1: Free-flow DhdR2:
$$ H + D_{2} \leftrightarrow D_{2}H \frac{k_{HD}}{k_{HD'}}$$
$$\frac{d[D_{2}H]}{dt} = k_{HD}[H][D_{2}] - k_{HD'}[D_{2}H]$$
Case 2: DhdR2 Bound to dhdO:
$$ H + D_{2}O \rightarrow D_{2}H + O(k_{HD})$$
$$\frac{d[D_{2}H]}{dt} = k_{HD} [H][D_{2}O]$$
Combining the two cases and factoring decay rate, we obtain:
$$\frac{d[D_{2}H]}{dt} = k_{HD}[H][D_{2}] - k_{HD'}[D_{2}H] + k+{HD}[H][D_{2}O] - k_{decay,D_{2}H}[D_{2}H]$$
Since D-2-HG levels are elevated due to the IDH1 mutation in some gliomas, we expect that there will be an increase in fluorescence or luminescence due to the release of the allosteric transcription factor caused by the binding of the upregulated oncometabolite. D-2-HG changes over time can be modelled by:
$$\frac{d[H]}{dt} = k_{H} - k_{HD}[H][D_{2}] + k_{HD'}[D_{2}H] - k_{HD}[H][D_{2}O] - k_{decay, H}[H]$$
\(k_H\)represents the rate of accumulation of D-2-HG overtime in the human body.
Factoring both bound and unbound DhdR and decay, we can obtain \([D_2O]\) through:
$$\frac{d[D_{2}O]}{dt} = k_{DO}[O][D_{2}] - k_{DO'}[D_{2}O] - k_{H2}[H][D_{2}O] - k_{decay,D_{2}O}[D_{2}O]$$
Likewise, the [O] can be obtained similarly through:
$$\frac{d[O]}{dt} = - k_{DO}[O][D_{2}] + k_{DO'}[D_{2}O] + k_{H2}[H][D_{2}O] + k_{decay,O}[O]$$
Lastly, summing all the above information, we can observe changes in DhdR dimer as a whole through the equation:
$$\frac{d[D_{2}]}{dt} = k_{dim}[D]^{2} - k_{dim'}[D_{2}] - k_{H2}[H][D_2] + k_{H2'}[D_{2}H] - k_{DO}[O][D_{2}] + k_{DO'}[D_{2}O] - k_{decay}, D_{2}[D_{2}]$$
When we perform drug screening assays on our completed co-culture system, we will associate decreased fluorescence or luminescence with lower levels of D-2-HG, corresponding to reduced tumor growth.
Reporter Expression: Multiple dhdO Binding Site
In the case of circuits with multiple binding sites for repressors, we model the system as a NOR gate. This NOR gate can be represented by the expression $$reporter = NOT(dhdO_1 OR dhdO_2)$$.
In the scenario with two dhdO binding sites, both repressors need to be absent for the promoter to be fully active. In addition, the binding reactions to dhdO sites are independent, so the chemical and mathematical equations previously derived still hold. With this in mind, the transcriptional equation for a generalized system with n repressor binding sites would be:
$$\frac{d[mRNA, reporter}{dt} = k_{mRNA, const}(\frac{K_{DR}}{K_{DR} + [D_2]})^{n} - k_{decay, mRNA}[mRNA]$$
Key Assumptions
- All reactions are steady-state.
- Free ligand approximation is held.
- Rapid equilibrium assumption held.
- Ligand molecules bind to a receptor simultaneously.
- RNA polymerase concentration is significantly larger than the \(K_{D}\).
- There are much more mRNA its respective coding protein.
- Initial DhdR and reporter mRNA concentrations, DhdR and reporter proteins, DhdR. dimers, operator bound DhdR, and D-2-HG bound DhdR are zero.
- Starting values for both the operator and promoter are \(5.128*10^{-6}M\) (Nature Methods, 2006).
- D-2-HG levels remain relatively constant throughout the reaction.
- The average range of 2HG level in a cancer patient is between 0.005 to 0.035 M (Andronesi et al., 2012).
- In addition to the initial parameter values, association, dissociation, and transcription rate constants were determined based on experimental values found from literature. Citations are listed in Table 2.
- The rate of dimerization \(k_{dim}\) was approximated from the kinetics analysis of b/HLH/Z-family protein.
- The binding rate of D-2-HG to DhdR (\(k_{HD}\))as well as the dissociation rate (\(k_{HD’}\)) were modelled after the characteristics of heterotrimeric G protein.
- The association rate and dissociation rate of DhdR to operator \(k_{DO}\) was modelled after the experimental values derived from the characteristics of the lac repressor.
- The association rate of D-2-HG with a bounded DhdR is the same as that of an unbounded DhdR.
- The decay of each component of the system was derived from their half-life constants (Table 3).
Computation Methodology
In Python, we utilized the Numpy and Scipy library and implemented the forward Euler’s method to compute our simulation. Each component of the system was computed throughout a fixed time step for 11 hours in 1 second increments.
Parameters and Constants
Table 1. Table of parameters - initial values
|
Parameter |
Meaning |
Value |
|
[mRNA]0 |
mRNA |
0 |
|
[O]0 and [U]0 |
Operator |
5.128E-6 M (Nature Methods, 2006) |
|
[D]0 |
Repressor |
0 |
|
[D2]0 |
DhdR as a dimer |
0 |
|
[H]0 |
Initial amount of 2HG in brain tumor patients |
Parameter Sweep |
|
[MD]0 |
mRNA that encodes DhdR |
0 |
|
[D2H]0 |
DhdR dimer bound to 2HG |
0 |
|
[D2O]0 |
DhdR dimer bound to operator |
0 |
Table 2. Table of constants
|
Constant |
Meaning |
Value |
|
K_Dr |
Repressor dissociation constant |
6 uM (Xiao et al., 2021) |
|
k_H |
HG production rate |
2.625E-7uM/s (Dang et al., 2009) |
|
k_mrna |
Transcription rate |
0.0725 mRNA/s (Darzacq et al., 2007)
|
|
k_const |
Constitutive promoter transcription rate |
=kmrna*[U]0 (da Silva et al., 2018) |
|
k_HD |
Association rate of 2HG to DhdR |
2e+6 1/(M*Sec) (Yi et al., 2003) |
|
k_HD’ |
Dissociation rate of 2HG to DhdR |
0.01 s-1 (Yi et al., 2003) |
|
k_DO |
Binding rate of DhdR to operator |
2.8e+7 s-1M-1 (Riggs et al., 1970)
|
|
k_DO’ |
Dissociation rate of DhdR to operator |
0.022 s-1 (Nelson et al. 1985) |
|
k_dim |
Rate of Dimerization |
30 s-1 (Ecevit et al., 2010) |
|
k_p |
Translation rate |
0.208-0.361proteins/mRNA s (Schwanhäusser et al., 2011)
|
Table 3. Table of decay constants
|
Constant |
Value |
|
Decay of DhdR |
4e-4 molecules/cell/sec (Yi et al., 2003) |
|
Half life of hdR-operator complex |
34 Sec (Nelson et al., 1985) |
|
DNA half life |
0 |
|
mRNA half life |
20 min (Wang et al., 2002) |
|
2hg half life |
2 hours (Baudouin-Cornu et al., 2012) |
|
Reporter half life |
15 hours (Baudouin-Cornu et al., 2012) |
Model Results
Individual Components
Setting the D-2-HG level to \(1.56*10^{-5} M \), the individual components of the system were modeled as below. As expected, we observe that the reporter concentration increases almost linearly as the operator concentration decreases and eventually converges at depletion. Conversely, DhdR2 and DhdR concentrations increase relatively steeply during the initial range then plateaus at the maximum concentration level. In terms of reporter mRNA, we observe that it increases until it reaches the maximum level after which it begins to decrease until the equilibrium level is met. A similar trend is observed in two and three binding sites as well, with one of the major differences being the level of convergence for mRNA. For two and three binding sites, reporter mRNA converges at a lower concentration than for the case of one binding site. In addition, we also observe that the total concentration of the reporter decreases with increasing binding sites.
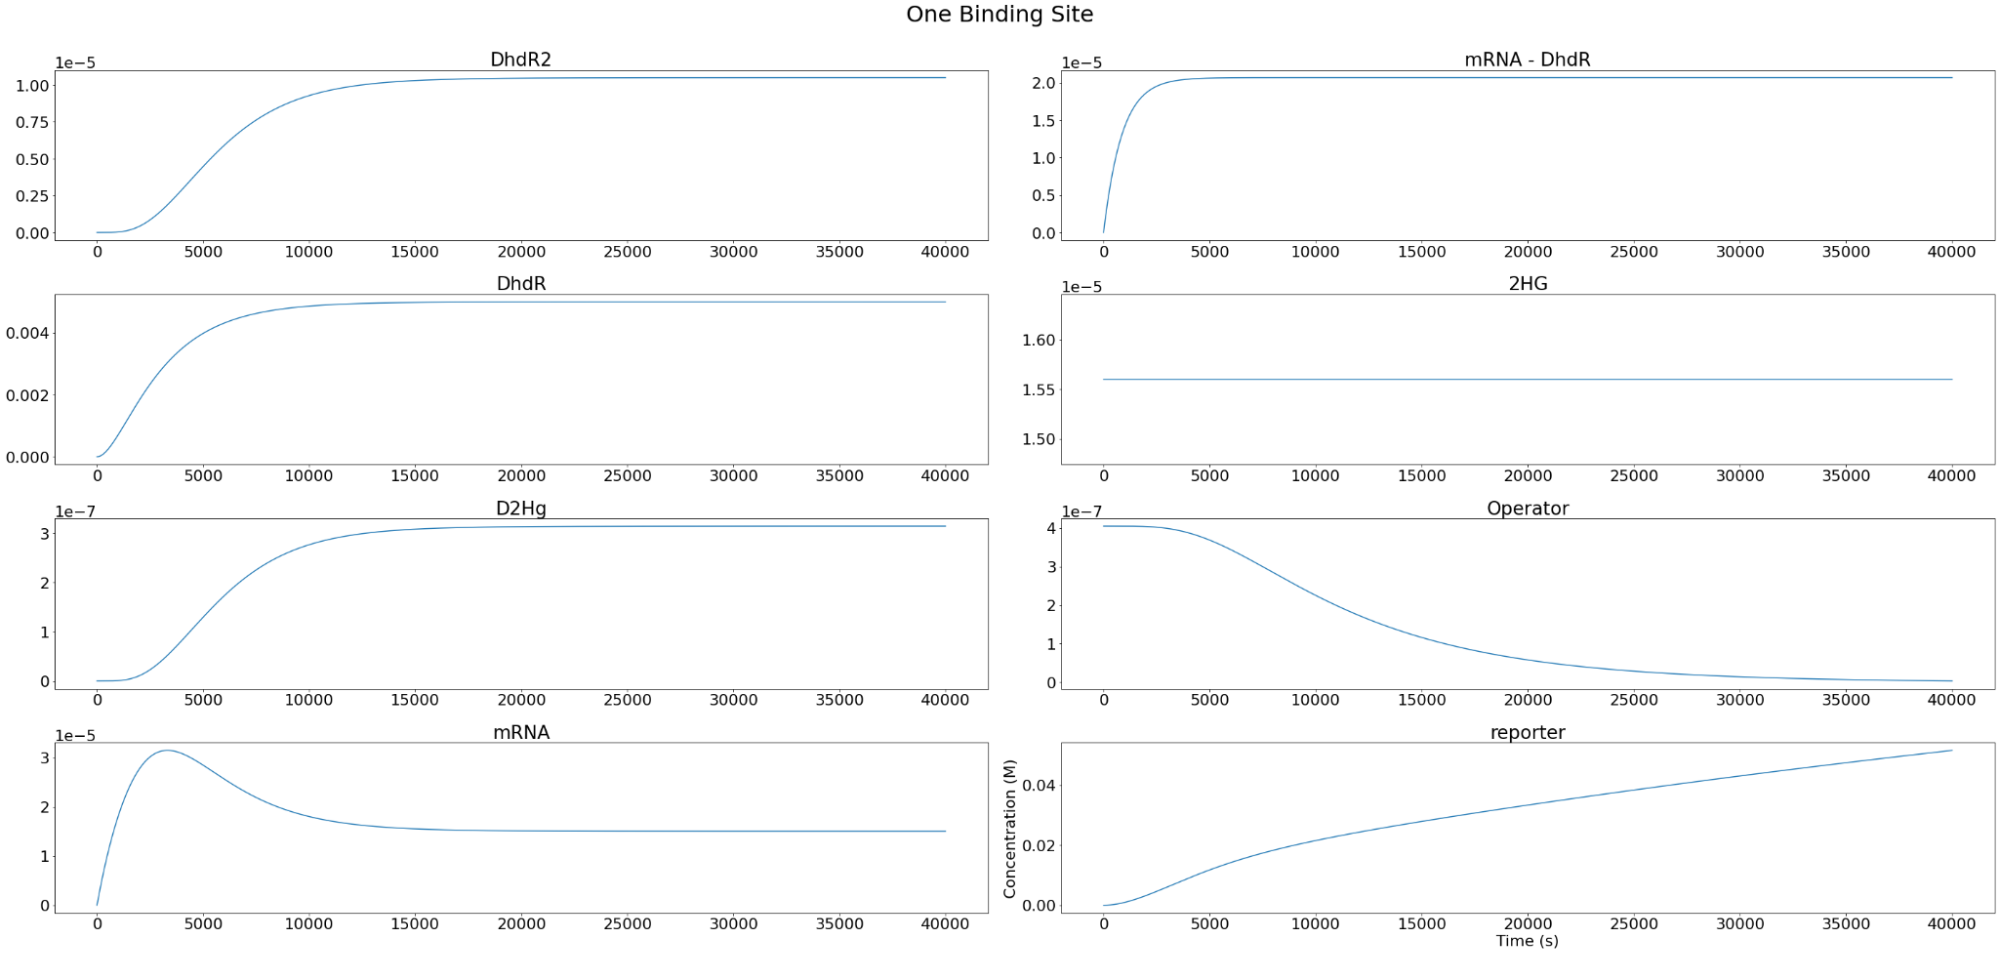
Figure 2. Individual variables change overtime for our one repressor binding site reporter construct.
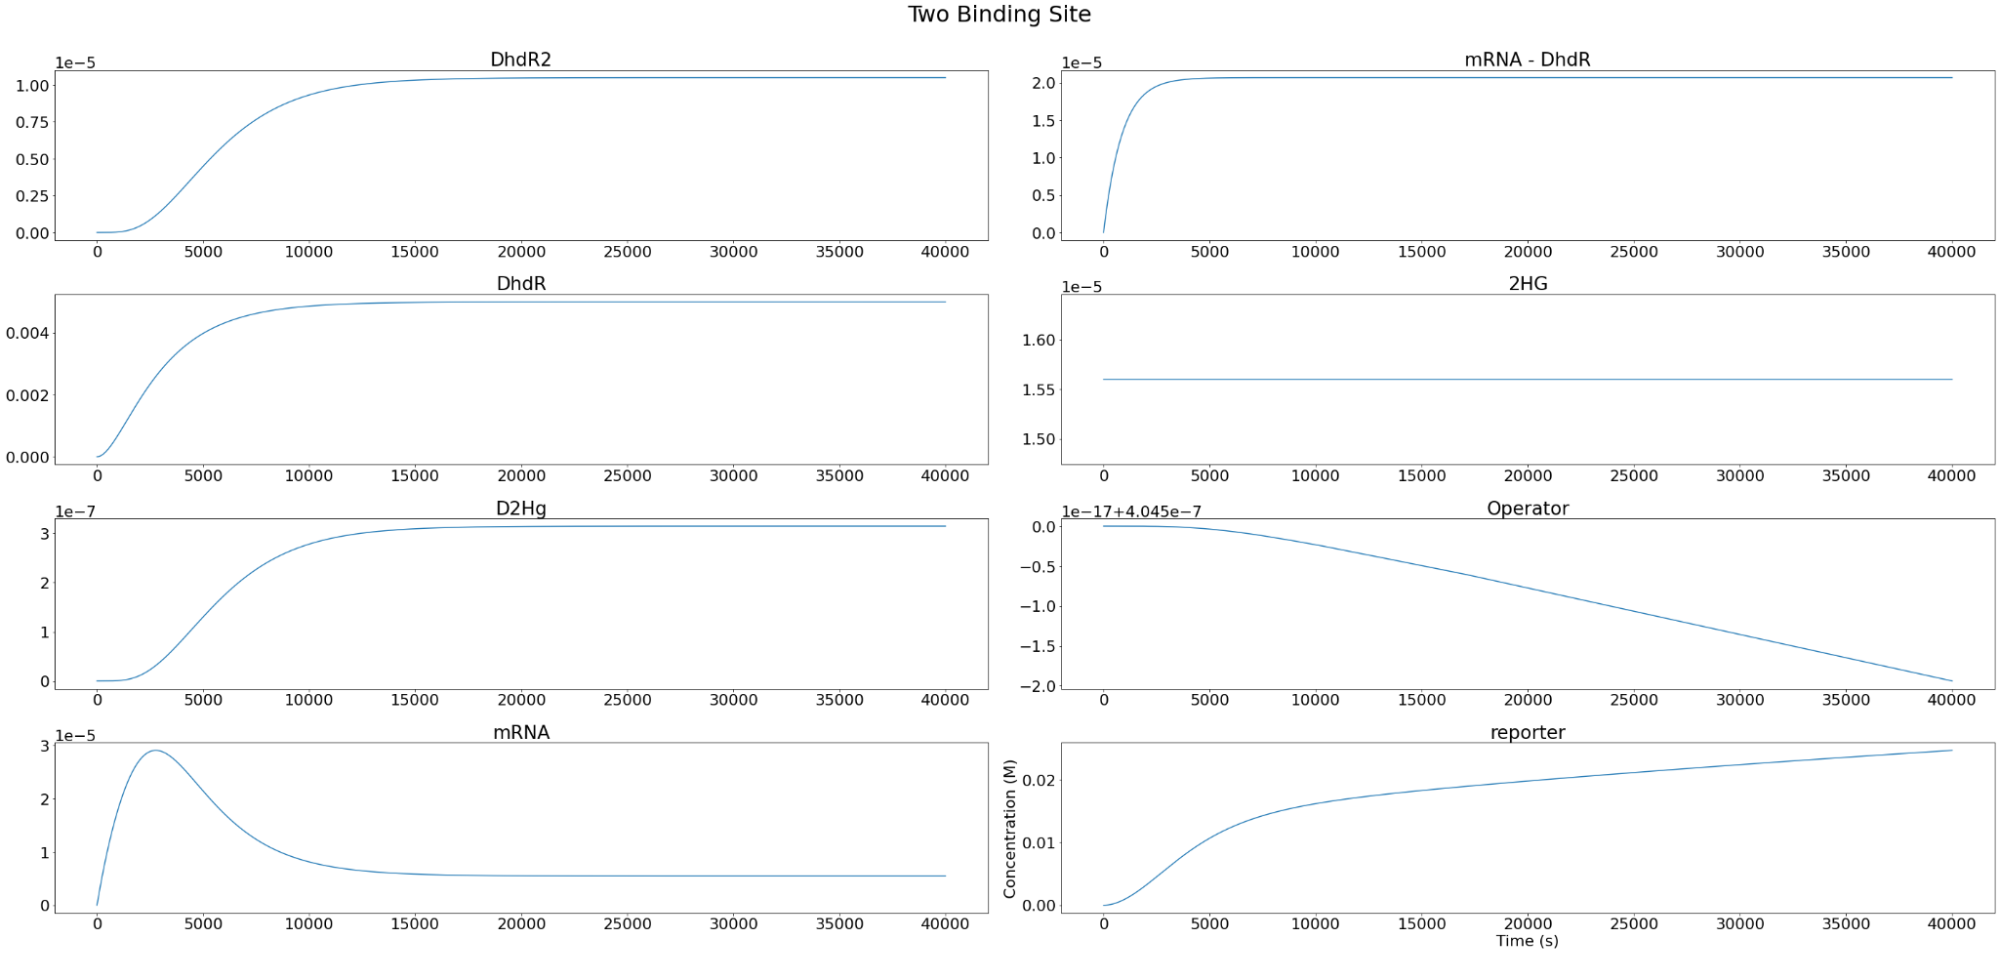
Figure 3. Individual variables change overtime for our two repressor binding sites reporter construct.
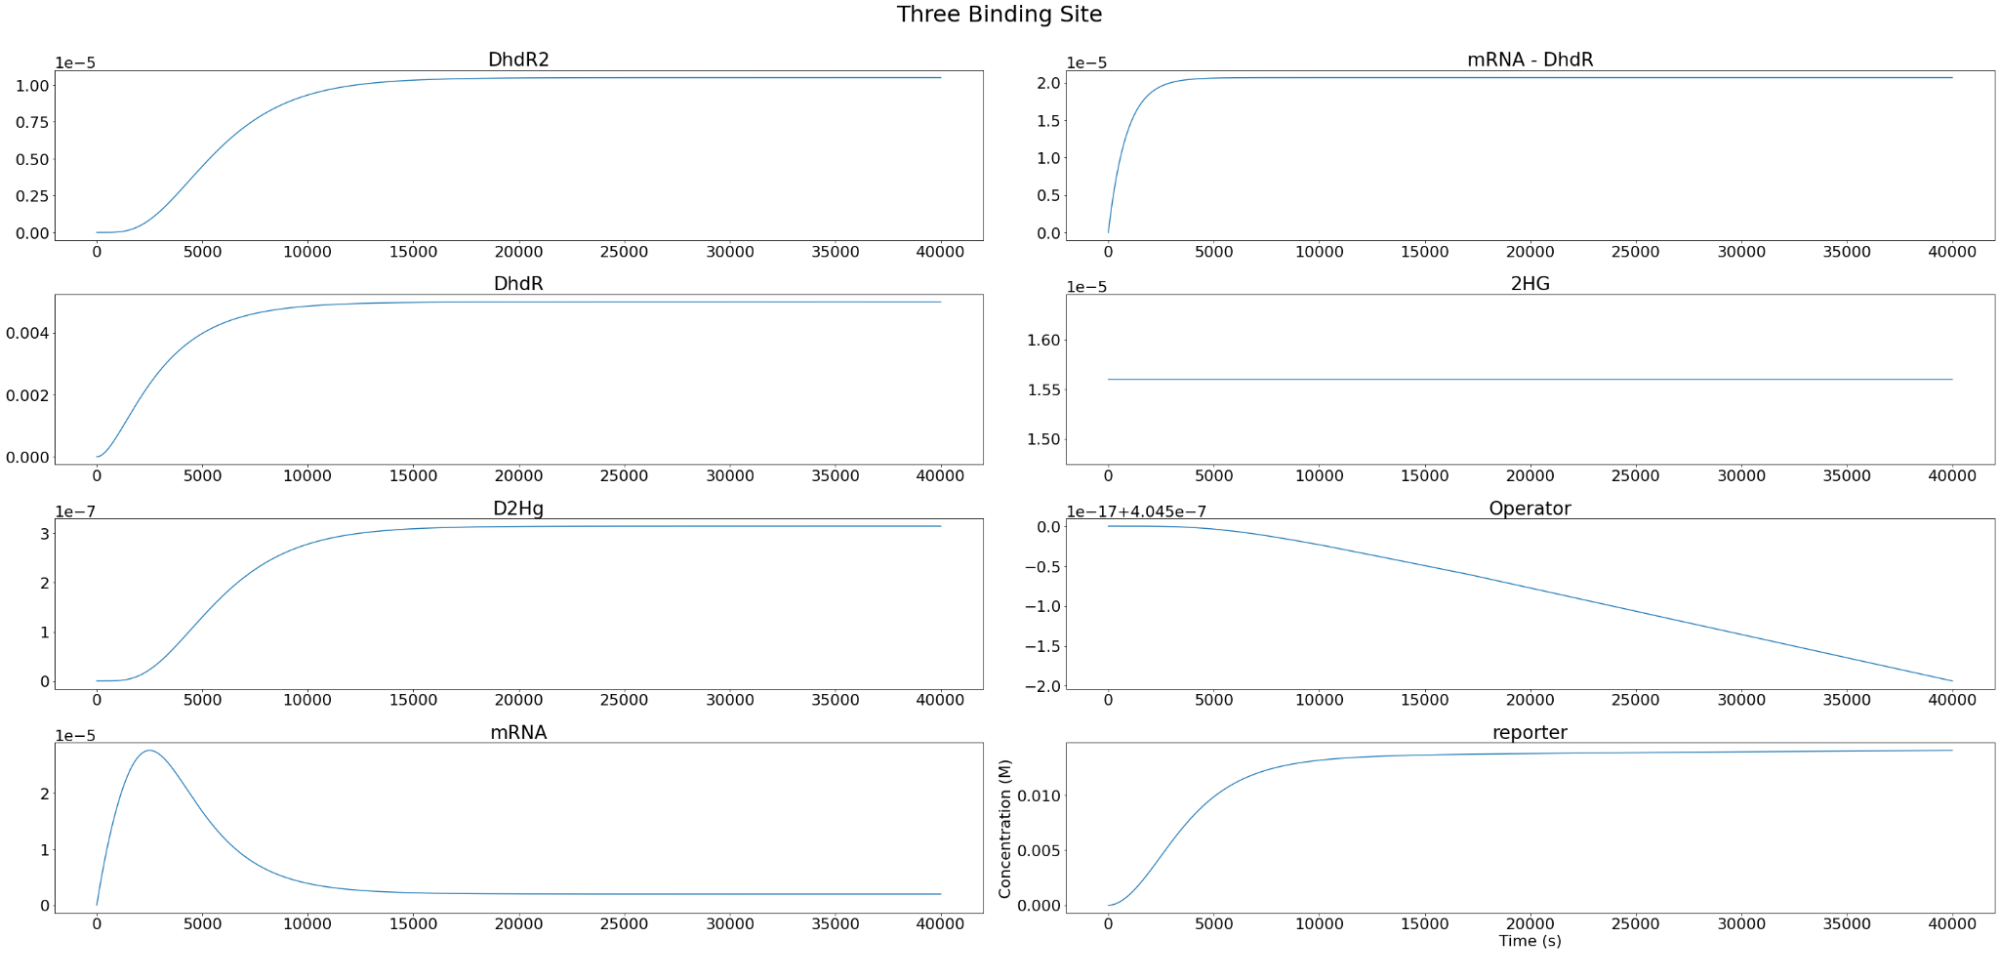
Figure 4. Individual variables change overtime for our three repressor binding sites reporter construct.
Hill Equations and Curves
From aggregating the reporter expression trends at each initial 2HG level, a Hill curve was constructed for one, two, three- binding site cases. In order to closely monitor the reporter-D-2-HG relationship and identify an inflection point — a clinically relevant threshold value that signifies IDH-1 mutation — a parametric sweep with initial 2HG values starting from \(10^{-4}M\) to \(0.035M\) in \(3.5*10^{-4}M\) increments were performed.
From the hill curves, we observe that the reporter-D-2-HG relationship becomes less steep with increasing binding sites. After the initial increase, reporter expression plateaus at the maximum, and this value is consistent for all binding site cases.
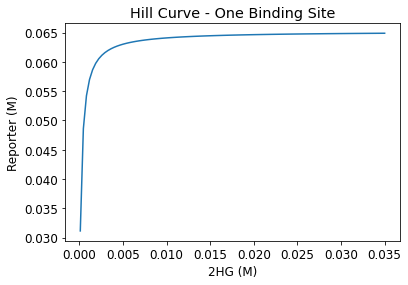
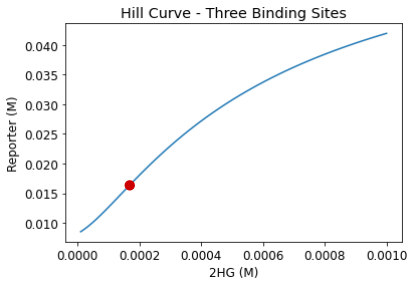
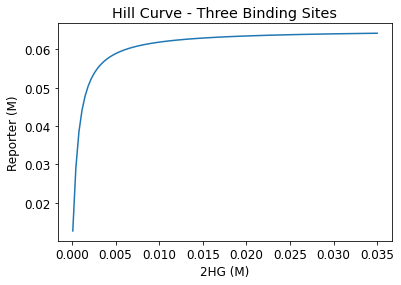
Figure 5. Hill curves for one, two, and three-binding sites
The inflection point in the three binding site Hill curve occurs at around 0.0002 M (Figure 6). This inflection point is our predicted reporter activation D-2-HG threshold. From literature, we found that glioma patients with IDH1 mutation typically have D-2-HG levels of around 0.005 M. (Andronesi et al., 2012). Thus, to implement our system in phase II and tailor the reporter for IDH1-specific drug screening, we plan to raise this reporter activation threshold to match that of glioma patient’s D-2-HG concentration level at the 0.005 M. Once this change is implemented, our circuit will have the capability of modulating reporter expression depending on whether D-2-HG is at dangerous levels or not. An example modification we are looking to implement in phase II is the fine-tuning of our promoters.
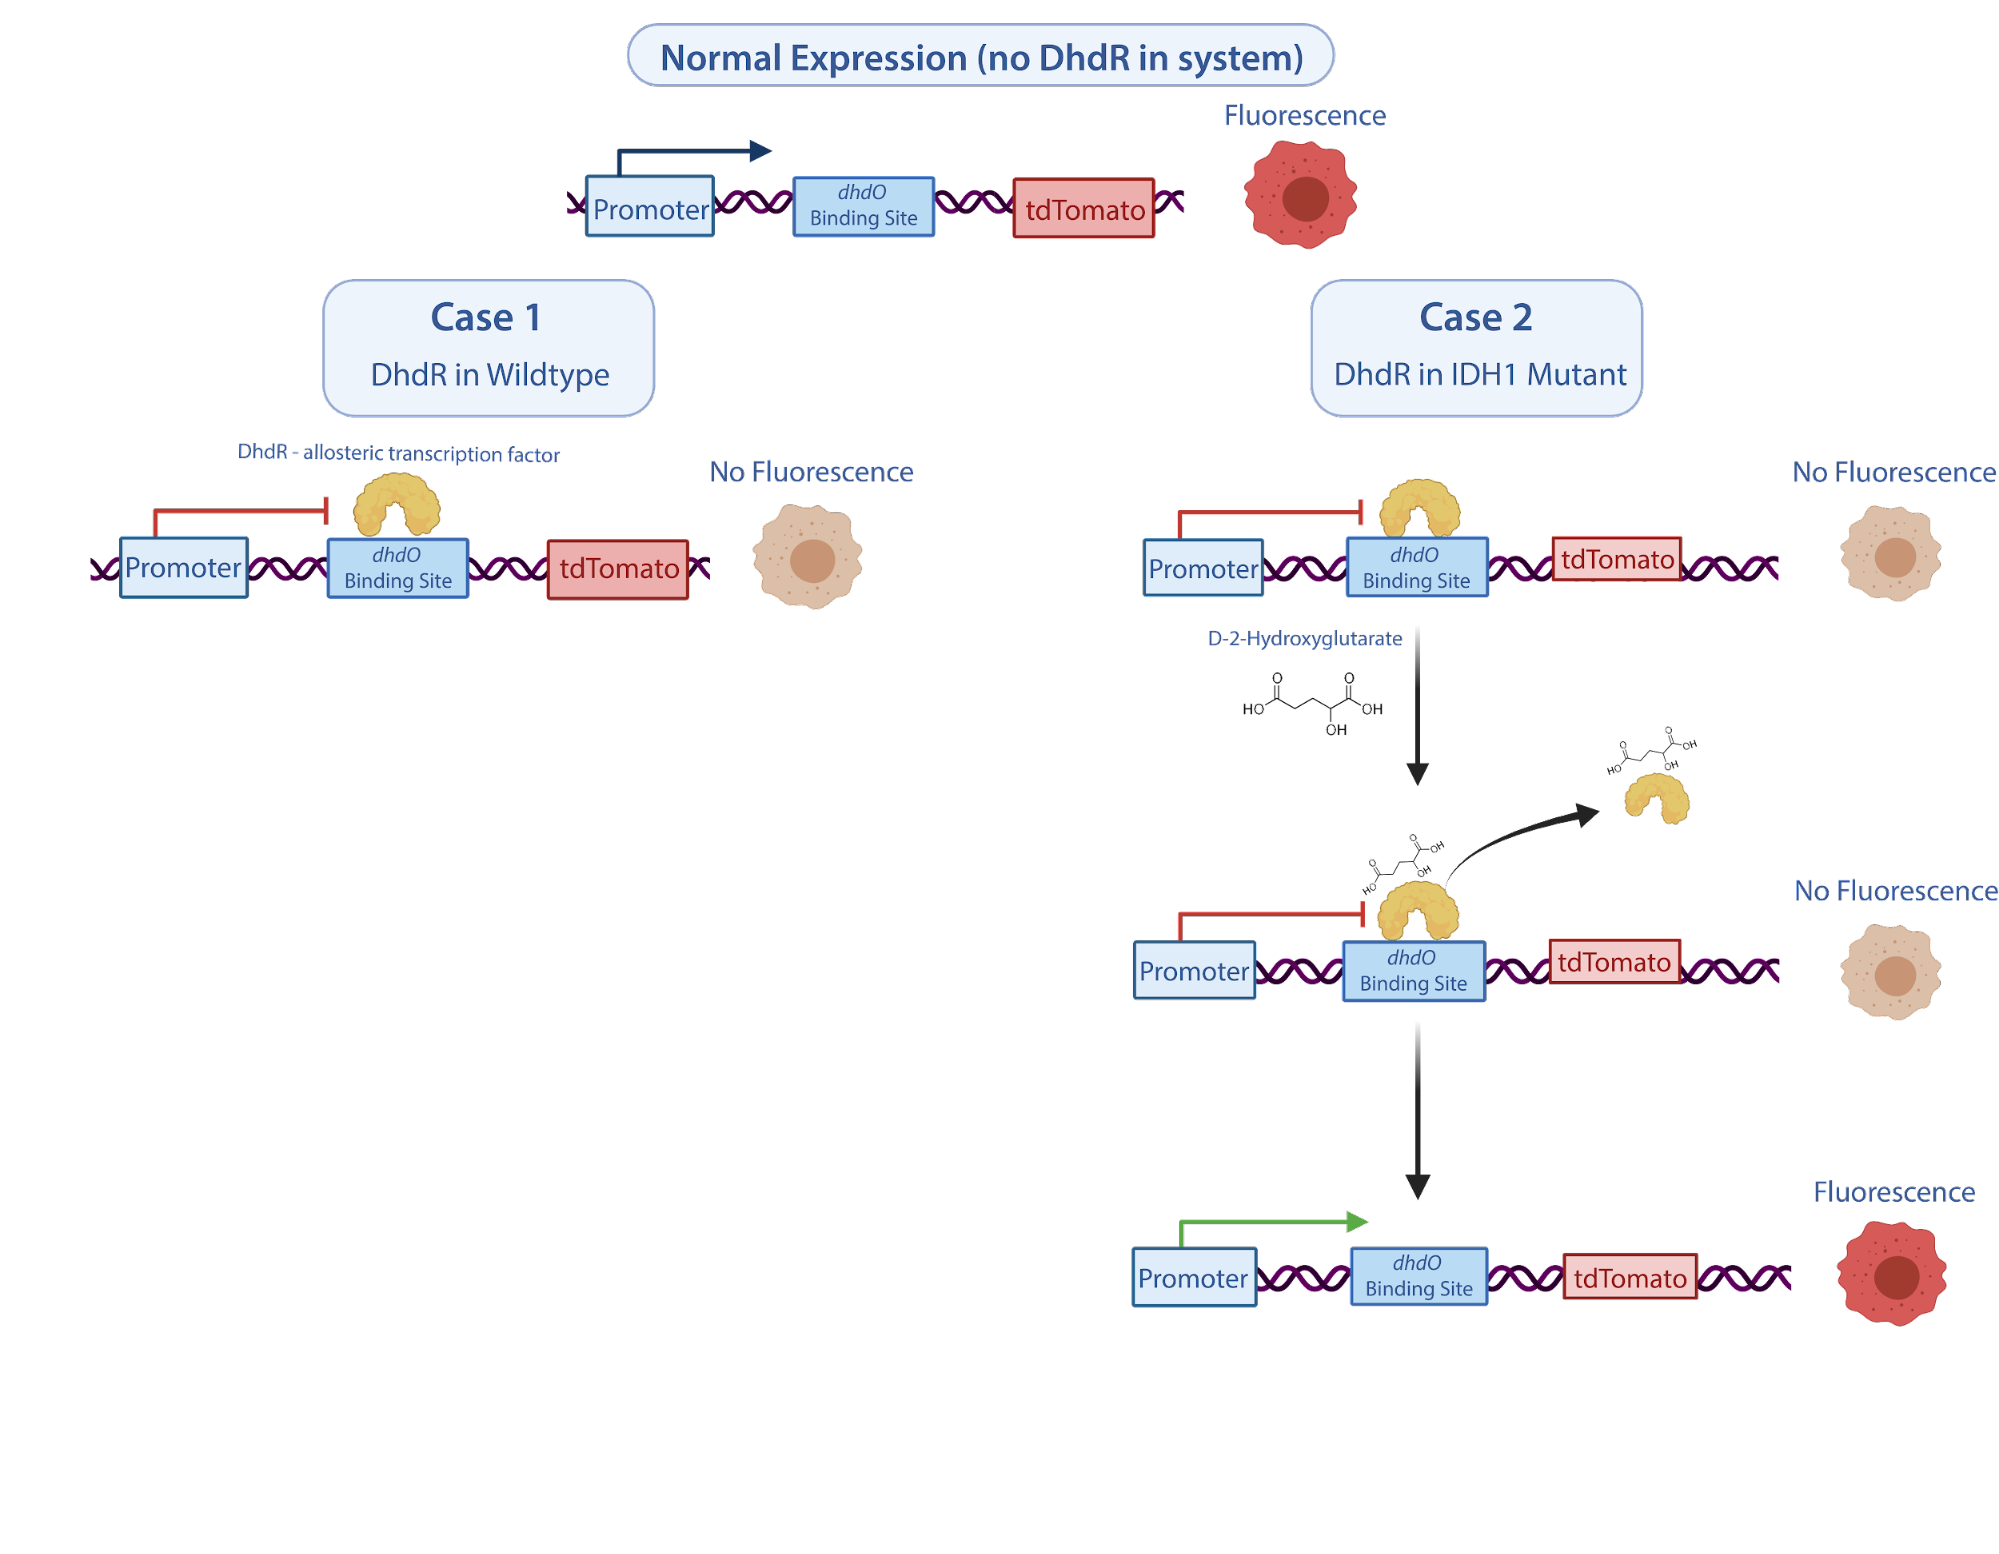
Figure 6. Zoomed-in view for the three binding sites case
While the numerical estimates could be further improved to better simulate the genetic system, our model showed that it is possible to predict circuit behaviors without complete information about the mechanism and constants involved. As with other fields of research, because a multitude of cancer growth variables, complex oncometabolite interactions, and related genetic parts are still uncharacterized, predictive models that are able to simulate these uncertainties and flexibilities will be immensely vital in guiding system designs in these fields.
Coming Soon: Stochastic Model Development and Reverse Modeling
For phase II of our project, we plan to build on our deterministic model and implement a stochastic model. Stochastic models account for variability and volatility in a system by allowing for randomness and implementing probability estimations. In particular, we look to simulate our circuit using Markov models. In addition, we plan to reverse engineer the deterministic model by fitting the data obtained from our experimental results to better understand unknowns in the deterministic model. If implemented, our composite findings from both models will be tremendously informative in guiding the engineering of our reporter system and advance drug screening for glioma patients.
References
Andronesi, Ovidiu C et al. “Detection of 2-hydroxyglutarate in IDH-mutated glioma patients by in vivo spectral-editing and 2D correlation magnetic resonance spectroscopy.” Science translational medicine vol. 4,116 (2012): 116ra4. doi:10.1126/scitranslmed.3002693
Baudouin-Cornu P, Lagniel G, Kumar C, Huang ME, Labarre J. Glutathione degradation is a key determinant of glutathione homeostasis. J Biol Chem. 2012 Feb 10;287(7):4552-61. doi: 10.1074/jbc.M111.315705. Epub 2011 Dec 13. PMID: 22170048; PMCID: PMC3281641.
da Silva, M. S., Cayres-Silva, G. R., Vitarelli, M. O., Marin, P. A., Hiraiwa, P. M., Araújo, C. B., Ávila, A. R., Reis, M. S., & Elias, M. C. (2018). Transcription activity contributes to the firing of non-constitutive origins in Trypanosoma brucei. https://doi.org/10.1101/398016
Dang, Lenny et al. “Cancer-associated IDH1 mutations produce 2-hydroxyglutarate.” Nature vol. 462,7274 (2009): 739-44. doi:10.1038/nature08617
Darzacq X, Shav-Tal Y, de Turris V, Brody Y, Shenoy SM, Phair RD, Singer RH. In vivo dynamics of RNA polymerase II transcription. Nat Struct Mol Biol. 2007 Sep;14(9):796-806. doi: 10.1038/nsmb1280. Epub 2007 Aug 5. PMID: 17676063; PMCID: PMC4942130.
Ecevit, Ozgur et al. “Kinetic analysis of the interaction of b/HLH/Z transcription factors Myc, Max, and Mad with cognate DNA.” Biochemistry vol. 49,12 (2010): 2627-35. doi:10.1021/bi901913a
Nelson HC, Sauer RT. Lambda repressor mutations that increase the affinity and specificity of operator binding.Cell. 1985 Sep42(2):549-58. p.552 table 3PubMed ID3161621
Riggs AD, Bourgeois S, Cohn M. The lac repressor-operator interaction. 3. Kinetic studies. J Mol Biol. 1970 Nov 14;53(3):401-17. doi: 10.1016/0022-2836(70)90074-4. PMID: 4924006.
Schwanhäusser, B., Busse, D., Li, N. et al. Global quantification of mammalian gene expression control. Nature 473, 337–342 (2011). https://doi.org/10.1038/nature10098
Transfection of mammalian cells by electroporation. (2006). Nature Methods, 3(1), 67–68. https://doi.org/10.1038/nmeth0106-67
Wang Y, Liu CL, Storey JD, Tibshirani RJ, Herschlag D, Brown PO. Precision and functional specificity in mRNA decay. Proc Natl Acad Sci U S A. 2002 Apr 30;99(9):5860-5. doi: 10.1073/pnas.092538799. Epub 2002 Apr 23. PMID: 11972065; PMCID: PMC122867.
Xiao, D., Zhang, W., Guo, X., Liu, Y., Hu, C., Guo, S., Kang, Z., Xu, X., Ma, C., Gao, C., & Xu, P. (2021). A D-2-hydroxyglutarate biosensor based on specific transcriptional regulator DHDR. https://doi.org/10.1101/2021.02.18.430539
Yi TM, Kitano H, Simon MI. A quantitative characterization of the yeast heterotrimeric G protein cycle. Proc Natl Acad Sci U S A. 2003 Sep 16100(19):10764-9PubMed ID12960402