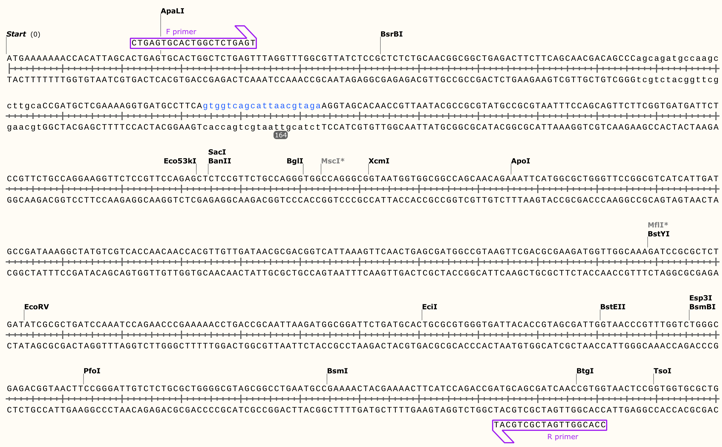
Figure 1: N20+ NGG region and Primer Design for CRISPR
We constructed the pTargetF-degP plasmid by amplifying the pTargetF with the primers (F: TCCTAGGTATAATACTAGT+N20+GTTTTAGAGCTAGAAATAGC, R: ACTAGTATTATACCTAGGACTGAGCTAGCTGTCAAG), which gave the amplicon that replaced the original N20 sequence in pTargetF. To remove the template, we digested the PCR product with DpnI. We sequenced the PCR product with an L4440 primer to confirm the success of the plasmid construction.
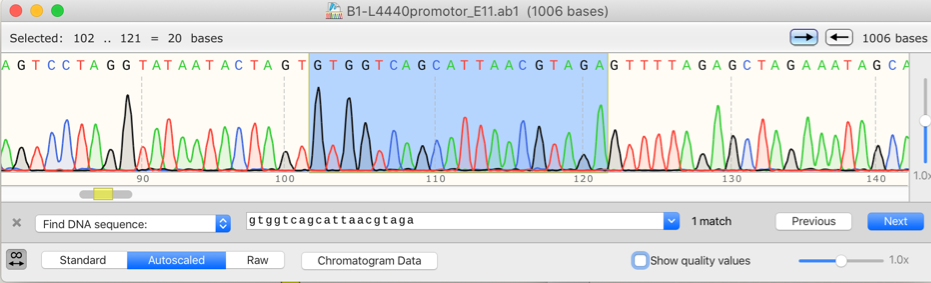
Figure 2: Sequencing Result of pTargetF-degP Plasmid
After we confirmed the construction of the pTargetF-degP plasmid, we followed the protocol by Jiang et al. (2015) to transform the bacteria strain and perform the gene knockout. The pCAS plasmid was transformed into the bacteria through electroporation and pTagetF-degP was transformed into the bacteria through electroporation. The positive transformants were selected with Streptomycin and Kanamycin. After electroporation, the bacteria were recovered at 37˚C overnight to cure the plasmids and let the CRISPR system work. Then we conducted Sanger sequencing with the degP forward primer. One positive strain was found with a missing nucleotide that would lead to the change of reading frame and interrupt the expression of the degP gene.
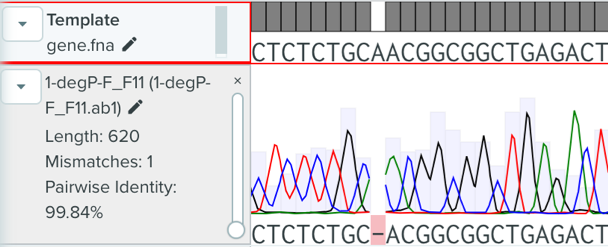
Figure 3: Sequencing Result of Successful Gene Knocking out Strain
Exosome Expression:
For the positive knock-out strains, they were cultured in M9 media with 2% glucose overnight to allow exosome production. To harvest the exosome, the culture media were filtered by 0.22 µm PVDF membrane to remove the bacteria cell. The exosome in the filtrate was isolated by a 100 kDa ultracentrifugation tube followed by washing with PBS buffer. Then, we first ran the flowcytometry of the exosome we isolated and pUC19 coated by lipofectamine. By using lipofectamine to coat pUC19 plasmid, it formed nanoscale membrane-bound particles which hold similar physical properties to our isolated exosome. Therefore, lipofectamine could be seen as the benchmark for our experiment.The violet side-scatter result shows that the size of the exosome we isolated is located within the same range as the lipofectamine. The lipofectamine was more abundant between the range of 105 and 106, while some of our products were beyond 106. This may be because when we prepare the exosome samples, some cell debris and outer membrane vesicles of larger size were not removed efficiently.
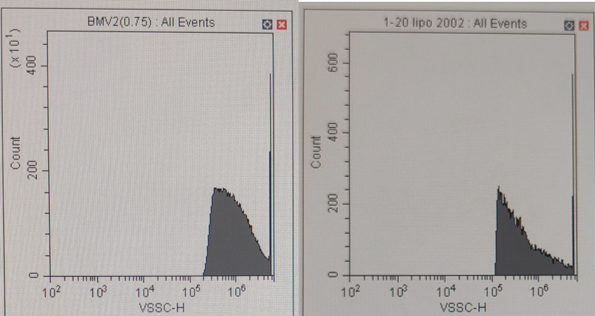
Figure 4: Flow cytometry Result of Exosome (Left) and Lipofectamine (Right)
In addition, the isolated exosome sample was stained DiO, which is a carbocyanine dye that can emit green fluorescence if fused with cell membranes. We detected the fluorescence by fluorometer with an excitation wavelength set to 484nm and emission wavelength at 501nm. The results suggest that compared to the control (PBS buffer), the exosome sample gave a strong fluorescence, which means the exosomes indeed originate from cell membranes.
Figure 5: Fluorescence Staining Result. First row: control (PBS buffer), second row: (5 fold diluted exosome sample), third row: (exosome sample).
Identification of water bloom species:
To study the water bloom species in Lake Taihu, we collected water bloom samples from Lake Taihu on June 27th, 2021. We streaked the BG11 agar plates and culture under 40 μmol photons /(m2·sec) light to isolate autotrophic water bloom species. 16S rRNA gene of single green colonies on the plates was amplified and sequenced. The blast result suggests the existence of M. aeruginosa in the water bloom (Table 1), which is consistent with the result of other studies on water bloom in Lake Taihu.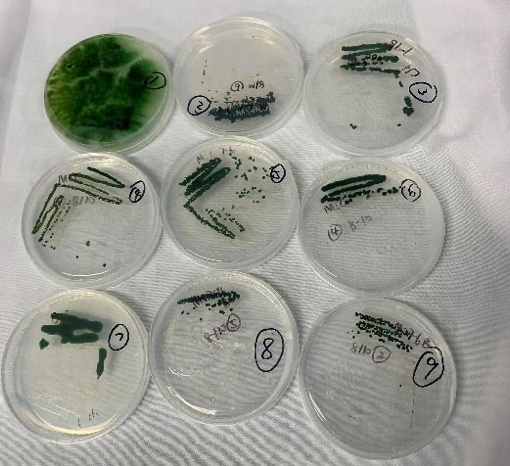
Fig. 6 Single algae colonies separated from water samples obtained from Taihu.
Peptide synthesis:
To better investigate the algicidal effect of HPA3NT3-A2, we used BL21(DE3) to synthesize the fused peptide. Please refer to the DESIGN and PARTS sections for the plasmid design. After all, the single peptide fused protein H1 and triple tandem peptide fused protein H3 are successfully synthesized by a 0.5 mM IPTG induction starting from OD600=0.6 at 37 ℃ for 6 hours. Proteins are purified by Ni-NTA resin and should go through dialysis and HPLC for further purification. While the triple tandem protein H3 is of a low expression, the single peptide fused protein has a significantly higher yield according to the SDS-page gel running result.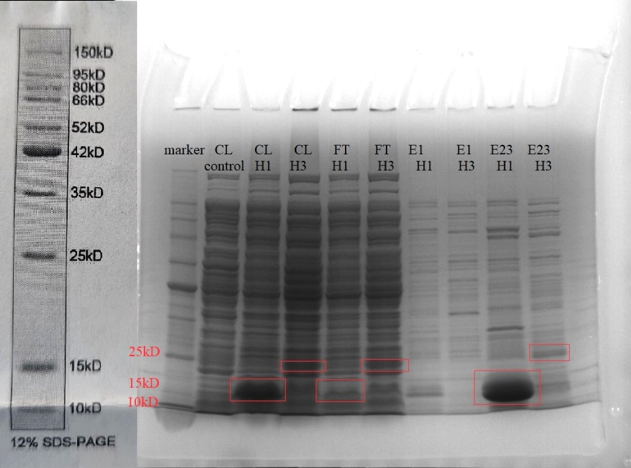
Fig. 7 H1 and H3 fused protein synthesis. Note that the H1 protein is of 14kDa, while the H3 protein is of 19kDa. CL: cell lysate, FT: flow-through, E1: first elution. E23: second and third elution.
Culture of M. aeruginosa and testing of algicidal effect:
Microcystis aeruginosa PCC7806 was cultured in BG11 media in a T75 cell culture flask at room temperature. The cell culture was under 40 μmol photons /(m2·sec) light of 12 hours per 24 hours as a period and was shaken at 60 rpm. The growth curve of Microcystis aeruginosa was determined by OD680 because of a significant peak on the absorption spectrum of the cell culture. Its early exponential growth starts at around OD680=0.25 (Fig. 8). HPA3NT3-A2 was added when Microcystis aeruginosa was in its early exponential growth stage, representing the time slot when an algal bloom is detected in the natural water system.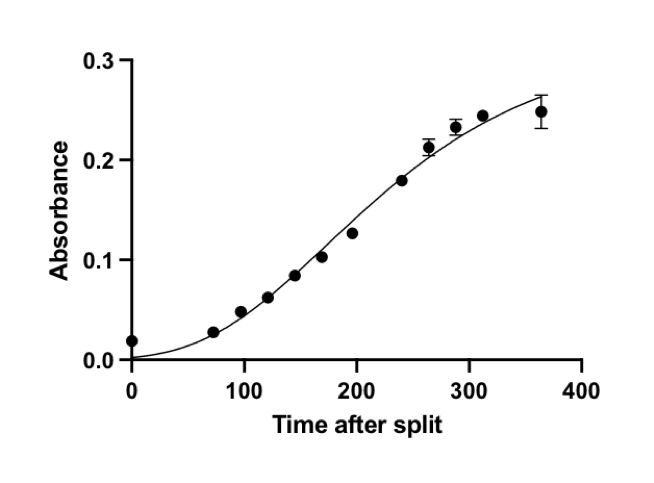
Fig. 8 Growth curve of Microcystis aeruginosa without adding peptide.
To verify the algicidal effect of HPA3NT3-A2. Microcystis aeruginosa was cultured in a tissue culture treated 24-well plate. A concentration of 0 (blank), 15, 20, 30, 40, and 50 μM of the peptide was administered, 2 replicas per group. The OD680 of the samples was measured. The data of the OD680 in a 5-day range is plotted in a scatter plot (Fig. 9). Together with Fig. 10, the algicidal effect of HPA3NT3-A2 is clearly shown. The blank group as a control presents the highest OD680 and the highest growth rate. OD680 and growth rate decreases as the concentration of HPA3NT3-A2 increases. As the concentration of the peptide increased, the green color of the samples gradually faded. Such an observation is consistent with the algicidal effect determined by the OD680 being measured. This also verifies the algicidal principle of HPA3NT3-A2, which is to cause the degradation of the M. aeruginosa cells. Since the cell concentration decreased, the sample solution became clearer. Since phycocyanin of the cells is degraded following the cell death, the optical density at 680 nm which represents the ability of pigments to absorb a certain wavelength of light decreased. Together with our pilot experiment, we knew that a peptide concentration as low as 15μM is presenting algicidal effects. In addition, a concentration of 40-50 μM is sufficient for long-term inhibition of M. aeruginosa growth.
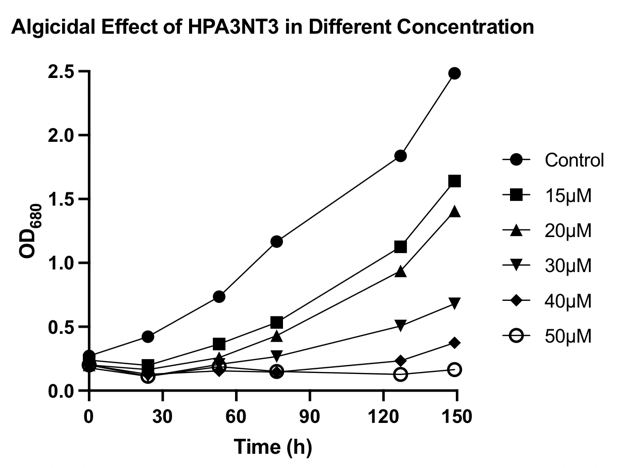
Fig. 9 OD680 of Microcystis aeruginosa after treated with 0 (blank), 15, 20, 30, 40, and 50 μM of HPA3NT3-A2
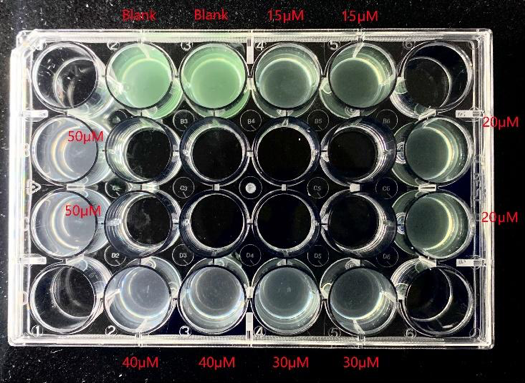
Fig. 10 Growth condition of Microcystis aeruginosa after treated with 0 (blank), 15, 20, 30, 40, and 50 μM of HPA3NT3-A2
Reference Jiang, Y., Chen, B., Duan, C., Sun, B., Yang, J., & Yang, S. (2015). Multigene editing in the Escherichia coli genome via the CRISPR-Cas9 system. Applied and environmental microbiology, 81(7), 2506-2514.
© Copyright DKU iGEM. All Rights Reserved