Overview
During spring season, fruit cultivators throughout Switzerland incur enormous losses due to frost each year. A widespread and renowned crop in the Suisse Romande region are apricots, which were particularly affected by the cold this year. The aim of our project is to develop three different approaches to tackle this problem. We focused on different aspects of this issue and either inhibited the formation of ice crystals directly by using antifreeze proteins (AFP) or found a way to inhibit the production of ice nucleation proteins by Pseudomonas syringae syringae, which will reduce the amount of ice crystals that are formed during the late spring freezes.
Key Achievements
- We successfully constructed 6 new composite parts containing the various AFP genes.
- We expressed and purified RiAFP and DcAFP.
- We were able to determine the thermal hysteresis of RiAFP and DcAFP, and therefore proved that they are functional.
- We successfully demonstrated that the purified AFPs have a strong protective effect against frost damage on plants.
- We managed to extract tailocins from the killer strain and visualised them using electron microscopy.
- We confirmed the ability of our tailocins to kill our target strain thanks to an overlay assay.
- We were able to determine the effect of P. syringae syringae on freezing time.
- We proved that our tailocins affect freezing time of a solution containing P. syringae syringae.
- We successfully inserted all three sgRNAs into three different plasmids.
- We successfully inserted the donor sequence into two of the three plasmids carrying sgRNA.
Antifreeze Proteins
The aim of this part of the project was to produce an antifreeze protein solution, which can bind to ice crystals during late spring freeze and therefore protect the crops from frost damage.
Plasmid Cloning
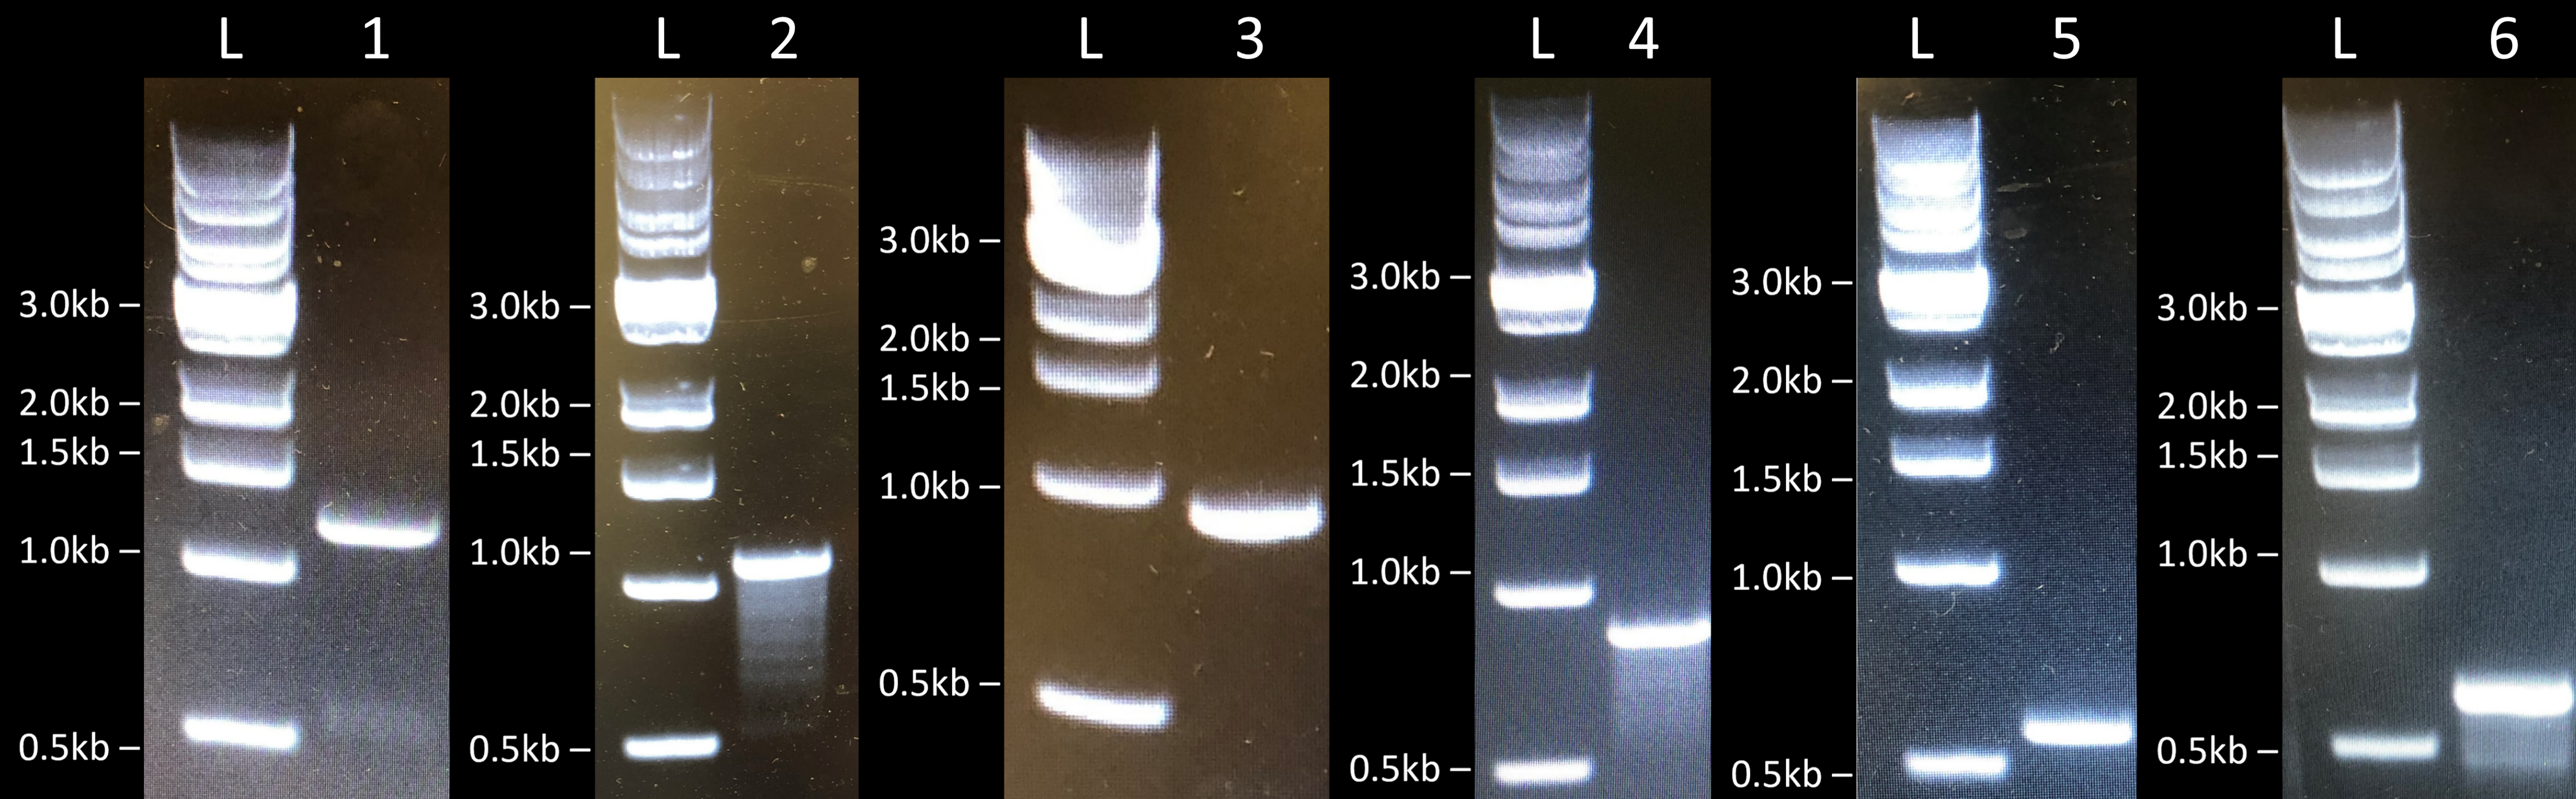
Initially, we first amplified the various AFP genes by PCR and linearized the plasmids by restriction enzyme digestion. Then we assembled the various constructs by Gibson Assembly, transformed E. coli BL21 (DE3) cells by electroporation, and performed colony PCR to check if the genes were correctly assembled in the various constructs (Fig.1). We obtained the expected band sizes and confirmed their sequence by sanger sequencing. We therefore concluded that we managed to successfully clone FfIBP, DcAFP, and RiAFP in E. coli BL21 (DE3) cells.
Expression and Purification
After this, we induced expression of the various AFPs with IPTG and ran a total cell SDS-PAGE (15%) of the E. coli BL21 (DE3) cultures stained with Coomassie blue. We used two different vectors, pET-17b and pCold-I, to compare how the promoters influenced expression efficiency for both AFPs. The expression was successful for FfIBP and RiAFP in both pET-17b and pCold-I plasmids. We observed thicker bands that matched the weights of the different antifreeze proteins (FfIBP 28.4kDa, RiAFP 12.8 kDa). The pCold-I vector worked better for both RiAFP and FfIBP, and the bands on the gels appeared to be thicker for this plasmid (Fig.2 and Fig.3). This can be explained by the fact that the natural expression of AFPs happens at cold temperatures, and any expression system adapted to these conditions will be more efficient. We induced expression at 15°C. At this temperature the 5’UTR of the mRNA from the pCold-I plasmid adopts a highly stable secondary structure and the TEE sequence then improves translation initiation of our AFP genes through a ribosome trapping process. The pET-17b plasmid does not have these features and is therefore less efficient. We can conclude that the pCold-I plasmid is a better system for expression of cold-stable proteins like AFPs.


From these initial test purifications with magnetic beads we were able to conclude that the expression and purification of FfIBP and RiAFP worked. Therefore, we upscaled the protein purification and induced expression in a 1-liter culture. After that, we performed two purification steps: the first using the His-tag affinity column and the second a gel filtration. Then, we eluted the protein in various fractions, ran a SDS-PAGE (15%) of the fractions containing the purified protein stained with Coomassie blue, and finally pulled the fractions containing FfIBP (Fig.4). Finally, we measured the final concentration of our protein with the nanodrop and obtained 178µM or 4.53mg/mL.

The upscaling for RiAFP did not work at first and we did not observe any bands that matched the weight of the protein on the total cell SDS-PAGE (15%) of E. coli cultures stained with Coomassie blue (data not shown). For the FfIBP purification, we used a baffled flask to grow the 1-liter culture for E. coli BL21 (DE3) expressing the construct. The edges of the flask maximize oxygen transfer to the culture media, but in some cases, they can also interfere with protein expression. Since we could not upscale the RiAFP expression using this method, we used a flask without baffles instead and succeeded that way. Then, we performed the same purification steps as we did for FfIBP purification. After gel filtration, we eluted RiAFP in various fractions, ran an SDS-PAGE (15%) of the fractions containing the purified protein stained with Coomassie blue, and finally pulled the fractions containing RiAFP (Fig.5). RiAFP does not contain any Tryptophan and Tyrosine residues in its sequence, hence, we could not measure its final concentration using a nanodrop and used the Bradford method to estimate it instead. In a standard reaction, 25µL of BSA concentration and 5µL of RiAFP concentration were mixed with 200µL of Bradford reagent. Absorbance was then measured at 595 nm. The calibration curve (Fig.6) is needed to calculate sample concentration. We obtained 0.75mg/mL or 58.94µM.


The expression didn’t work for DcAFP in pET-17b. When we ran a total cell SDS-PAGE (15%) of E. coli cultures stained with Coomassie blue, we didn’t observe any thicker bands that would have corresponded to the protein. The root of the problem might be that the protein aggregate to form inclusion bodies. To remedy this problem, we attempted to optimize expression by using various concentrations of IPTG. Once more, we ran a total cell SDS-PAGE (15%) of E. coli cultures stained with Coomassie blue but did not observe thicker bands at the desired protein weight (Fig.7).

Since we couldn’t optimize expression of DcAFP by adapting the concentration of IPTG, the next step would be to purify the protein from inclusion bodies. We adapted a protocol [1] to our DcAFP construct, which could be used in the future.
Results of AFP TH Values
The measurements we performed on our AFP solutions were done in part with the machine we designed, FROZONE. This device, coupled with a software we created, allows the precise control of the temperature of a copper plate placed in a vacuum chamber. We placed a drop of our AFP solutions on the copper plates and visualised their freezing and melting temperatures using a microscope.
This allowed us to precisely determine the freezing and melting temperatures of our AFP solutions, allowing us in turn to determine the TH values of our proteins at specific concentrations. The values we obtained can be visualised in the following (Fig. 24.).

The data we obtained show that the thermal hysteresis of our proteins increases as their concentration in the solution increases.
From these results, we can conclude that our antifreeze proteins are both functional, as we have successfully measured their respective TH values at two distinct concentrations. With these results, we can also conclude that RiAFP is more effective than FfIBP at a concentration of 50µM.
Result of Protective Effect of AFPs on Plants
The following graph shows the percentage of damage measured on the leaves of Arabidopsis plants that were incubated overnight at -5 °C in various solutions of AFPs or in our buffer solution. Our results show that plants incubated in the buffer alone are significantly more damaged than those incubated in the AFP solutions, therefore confirming the protective effect of our AFPs. We were not able to detect, however, a significant difference between the protection level provided by FfIBP, RiAFP or a mix of both AFPs.

Tailocins
In order to kill Pseudomonas syringae pv. syringae B301D, our target strain similar to the frost-damage enhancing Pseudomonas syringae pv. syringae found on apricot trees, we are using tailocins naturally produced by Pseudomonas syrinage pv. aptata DSM50252.
Tailocins Extraction
We successfully extracted tailocins from our killer strain, P. syringae DSM50252.
We first induced the production of tailocins in our killer strain using different concentrations of mitomycin C, i.e. 0.5 or 3 µg ml -1 (cf. tailocin extraction protocol (link)). Tailocin production can be indirectly monitored via the death of the producer bacteria, as tailocins synthesis results in their lysis. We could induce production of tailocins with as little as 0.5 µgml -1 mitomycin C, as both concentration tested led to cell lysis compared to our control flask without addition of mitomycin C (Fig. 1).

Having induced the production of tailocins by our killer strain, we then set out to test their efficacy in killing our target strain P. syringae syringae B301D. For this, we first proceeded to purify the tailocins from both the mitomycin-induced cell lysates and the non-induced culture as a negative control. We then used a soft agar overlay assay method (as described by Baltrus and Hockett) to assess the lysis of the target cells exposed to our purified tailocins.


Our results indicate that we successfully purified tailocins from our killer strain and that these tailocins were able to kill our target strain (Fig. 2, A). Indeed, we observed clear concentration-dependent lysis of cells exposed to our diluted purified extract. The control solution, however, which we obtained by following the same extraction protocol but without inducing tailocin production with mitomycin C, showed some mild killing activity(Fig. 2, A ). This could indicate that some tailocins were produced even without mitomycin or that our killer strain produces another bacteriocin or antibiotic efficient against our target. Nevertheless, mitomycin C-induced lysates exhibit greater killing activities compared to the uninduced cultures, confirming that mitomycin C is essential to obtain significant tailocin yield. Additionally, we observed a higher killing activity in the 0.5 µg mL-1 mitomycin-induced extract than in the 3 µgmL -1 (Fig. 2, A), which suggests that the lower concentration led to a better yield of tailocins production.
As explained on the design page (link), our killer strain’s genome contains both a tailocin gene cluster and a prophage. As both can be induced by mitomycin C, we cannot exclude a priori that the killing activity is caused by the phage rather than the tailocins. Nevertheless, phages produce small individual plaques instead of big ones when they are diluted enough, whereas plaques produced by tailocins become gradually smaller and fainter as they are diluted (Fig. 2, B). As we do not observe individual plaques on our plates, it is most likely that the killing activity seen in our experiment is caused by tailocins. However, we cannot exclude that a small amount of phages is present and contributes to cell lysis. To prove that our tailocins only killed our target, further experiments should aim at deleting some of the phage’s genes from our strain’s genome.
As additional proof of the success of our tailocin purification, we performed negative staining of our tailocin extracts and visualized our samples by electron microscopy. This confirmed the presence of tailocins in our mitomycin C-induced extracts (Fig. 3), while no tailocins could be observed in our control sample (non-induced cells). Also, no phages could be seen in our samples, although more concentrated extracts could be required to observe them. By measuring the height and width of our tailocins, and obtained the following results: 168 nm long and 25 nm wide.


In parallel to obtaining tailocins directly from P. syringae , we aimed at cloning the tailocoin gene cluster in a plasmid to express it heterologously in Escherichia coli . As the cluster is relatively big (i.e. 14 kb), we first amplified it from P. syringae genomic DNA as four distinct fragments (Fig 4).


Plasmid Cloning
Having obtained our different fragments, we then attempted to assemble them using Gibson assembly but we were unfortunately unsuccessful. After transformation of E. coli cells with our Gibson products, we obtained some colonies growing on selective media and none in the control (in which we performed a Gibson without one of the fragments). The absence of colonies on our control plate seemed to indicate that the assembly had worked. However, the colony PCRs we later performed revealed that our transformed bacteria carried only the empty backbone ( Fig. 5 ). Due to lack of time, we were unfortunately not able to proceed further.

Versus
Our Versus assay was designed to test if the tailocins we produced successfully killed and unarmed Pseudomonas syringae syringae. For this assay, we tested a P.syringae solution at OD1 and a P.syringae solution at OD1, which we had previously incubated with our tailocin solution for an hour. We placed a drop of each of these solutions on our FROZONE machine, set at -15°C. We then measured the time it took for each of the drops to freeze. Figure 27 illustrates our results, obtained using a t-test.

We can see that there is a significant difference between the time it took for the P.syringae solution to freeze versus the time it took for the same solution but previously incubated with tailocins to freeze. As the tailocins incubation is the only variable between the two solutions, we can conclude that these protein complexes allow the reduction of P.syringae’s ice nucleation activity.
Measuring the Time Before Freezing - P. syringae Solution
Pseudomonas syringae syringae (PSS) accelerates and facilitates the formation of ice crystals. Theoretically, adding P.syringae to a solution at a sub-zero temperature should shorten the time it takes for this solution to freeze.
To test this hypothesis, we used our FROZONE machine to perform the TTF assay. This assay measures the time it takes for a drop of solution to freeze at -15°C. The results of this assay, illustrated in Figure 26, show that it takes an average of 300 seconds for a 10µL drop of buffer to freeze at -15°C whereas it takes an average of 102 seconds for a solution containing an OD of 0.7 of P. syringae to freeze in these conditions. We also compared this data to the freezing time of a solution containing an OD 0.7 of E. coli, which takes an average of 1500 seconds to freeze. We tested two other concentrations of P. syringae to try and determine when the presence of the bacteria started to have an effect on the time before freezing. From these measurements, we established that even at very low concentrations, the bacteria have a drastic effect on the time it takes for a drop of solution to freeze.
This assay allowed us to confirm that P. syringae drastically reduces the Time before freezing, regardless of the concentrations tested.

Phages
In this part of the project we primarily focused on engineering a plasmid responsible for delivering a CRISPR-Cas9 construct with a sgRNA targeting the genomic site of InaZ, the gene coding for the Ice Nucleation Protein. We tested three different sgRNAs in parallel (each sgRNA on a different plasmid) targeting different positions of InaZ.
In addition, as our purpose was to take advantage of the innate homologous recombination process of Pseudomonas syringae, we also wanted to insert a Donor Sequence into our plasmid, consisting of a 2 kb homology region allowing such mechanism to take place. These two elements would allow us to prove the concept that such an intervention could trigger the deletion of InaZ.
In a second step, we would use the same techniques used to engineer the plasmid in order to engineer the final carrier consisting of a phagemid, allowing us to generate an engineered defective phage capable of infecting Pseudomonas syringae, eventually causing the deletion of InaZ.
Golden Gate Assembly (for sgRNA insertion)
We used a Golden Gate Assembly to clone the three different sgRNAs into pJH1 (i.e. our vector).
We first annealed the three pairs of complementary oligos which gave us the three different sgRNAs ready to be cloned by Golden Gate Assembly into pJH1 opened by BsaI-HFv2.

From here we decided to adhere to the following workflow:

First, we performed a colony PCR followed by a gel electrophoresis to check the presence and size of the amplified fragment. One of the two primers used during colony PCR is priming in the sgRNA insertion, meaning that if we observe a band, the presence of the guide RNA is confirmed, while its absence would be the result of a lack of sgRNA insertion.
The electrophoresis gel is shown in figure 15:

All 12 colonies tested show a bright band at the expected molecular size of approximately 900 bp, which means that in those cases the sgRNA insert is probably present. We purified the PCR product and sent it for sequencing.
We also made a miniprep to extract the engineered pJH1. The sequencing analysis results are shown in figure 16:


These results confirm that all three sgRNAs had been efficiently integrated into pJH1 (each sgRNA in a different plasmid entity).
Gibson Assembly (for Donor Sequence insertion):
We also used Gibson Assembly to clone into pJH1 (i.e. our vector) the donor sequence, carrier of the homology regions responsible for the homologous recombination event occurring in Pseudomonas syringae. We firstly ordered the donor sequence from IDT (Integrated DNA Technologies company) and dissolved it upon arrival.
Once the donor sequence was prepared for further manipulations, the first procedure that took place in this part of the project was the amplification of such sequence via PCR in order to have a sufficient concentration of it to perform a more efficient cloning procedure.
A verification of the amplified fragment was provided by a gel electrophoresis test, where the results are presented in figure 17:

The length of the donor sequence is 2 kb, which is the molecular size where the gel in figure 17 shows the brightest and thickest band, confirming the correct amplification of this sequence.
We digested the backbone into which an insert sequence is supposed to be cloned. In our case, the backbone opening is achieved by a double digestion, where we used two different restriction enzymes (NheI-HF and SphI-HF) to avoid relegation of the resulting sticky ends.
To confirm the efficiency of the digestion we loaded the digested samples on a gel.

From figure 18, it is easily noticeable that the results are the expected ones, namely three bands at a molecular size near 8 kb appeared, which correspond to the linearised open plasmid. In addition, we observed three fainter bands at the bottom of the gel, which reflect the 337 bp sequences cut out.
After having efficiently amplified the donor sequence and properly digested the backbone, the Gibson Assembly was performed in order to insert the 2 kb (i.e. the donor sequence) into the 8 kb sequence (i.e. the open pJH1).
We then transformed the Gibson Assembly products into electrocompetent cells (E. coli NEB5alpha).
The plating results are displayed in figure 19:

Next, we tested 12 clones by colony PCR and ran a gel to check the presence and characteristics of the amplified fragment, directly suggesting which colony presented the donor sequence and which did not.
The electrophoresis gel is shown in figure 20.

If the donor sequence is integrated, a band at a molecular size of 2’105 bp is expected, whereas if a band at 442 bp molecular size is visible, it means that the insertion did not occur properly and that the Gibson Assembly did not work for those colonies. As it is noticeable in figure 20, we obtained six colonies (i.e. 2-5, 8 and probably 9) with the correct insert. These PCR products were then sent for sequencing.

As we can see in figure 21, the sequences confirmed that the team successfully inserted the donor sequence into pJH1. However, from the sequencing analysis results, as already suggested from the electrophoresis results, it turned out that one out of the three different types of pJH1 (one per each sgRNA type) (i.g. pJH1 bearing sgRNA 3) did not integrate the donor sequence. Nevertheless, we pursued our assays with pJH1 bearing either sgRNA 1 or sgRNA 2.
Once we obtained our engineered plasmid bearing both sgRNA and the donor sequence, we properly prepared Pseudomonas syringae pv. syringae B301D for transformation via electroporation.
To test the efficacy of our construct in deleting InaZ, we transformed the bacteria with three lines of plasmids, two of which bore sgRNA 1 while the other carried sgRNA 2.The bacteria were then plated onto LB agar plates supplied with Kanamycin 50. The resulting plates are shown in figure 22:

We did colony PCRs of the grown colonies by using two primers specific to the bacterial genome to confirm the InaZ deletion followed by running a gel. From the size of the amplified fragment, we can directly say whether the deletion was efficiently induced or not.
The electrophoresis results are shown in figure 23:

Unfortunately, all grown colonies still carried InaZ in their genome. In fact, the expected PCR product confirming InaZ deletion would have shown a band at around 2 kb, whereas, as shown in figure 23, all our PCR products have a band at about 6 kb, which means that InaZ is not deleted.
As we did not manage to delete InaZ from the bacterial genome, additional attempts would have been made if there was more time. Besides, small changes to the protocol could be tried, for example by either shortening the recovery time after electroporation or changing the temperature at which this process occurs. However, the reason we did not achieve our goal could also come from a problem in our construct. First, we might need to test if Cas9 got expressed. We could perform a Western Blot to test Cas9 expression. Second, we could test the efficiency of the sgRNAs. We could transform another plasmid containing the target region of the sgRNAs and see if Cas9 induces a cut in this plasmid in Pseudomonas syringae. Third, the homologous recombination might have been low efficient in Pseudomonas syringae, especially when the designed homology arms are not adjacent to the cut site. We could design a donor sequence carrying homologies adjacent to the cut site, which will not completely delete InaZ but at least disrupt it. In addition, instead of one cut, we could cut InaZ twice by using two gRNAs targeting the start and the end of the gene. This might facilitate the integration of the donor sequence by the HR repair mechanism, as the sequences next to the cut are directly homologous to the ones provided by the donor sequence.
References
- [1] D. Q. Zhang et al., Expression, purification, and antifreeze activity of carrot antifreeze protein and its mutants, In: Protein Expression and Purification, Vol. 35, No. 2, pp. 257-263, June 2004 Available from: https://www.sciencedirect.com/science/article/pii/S1046592804000907
- [2] K. L. Hockett et al., Use of the Soft-agar Overlay Technique to Screen for Bacterially Produced Inhibitory Compounds, In: Journal of Visualized Experiments, Vol. 119, 2017 Available from: https://www.ncbi.nlm.nih.gov/pmc/articles/PMC5352255/
- Tailocins : Figures 2,4,5 created with Biorender.com
- Phages : Figure 2 created with Biorender.com