Team:UGM Indonesia/Bioreactor
<!DOCTYPE html>
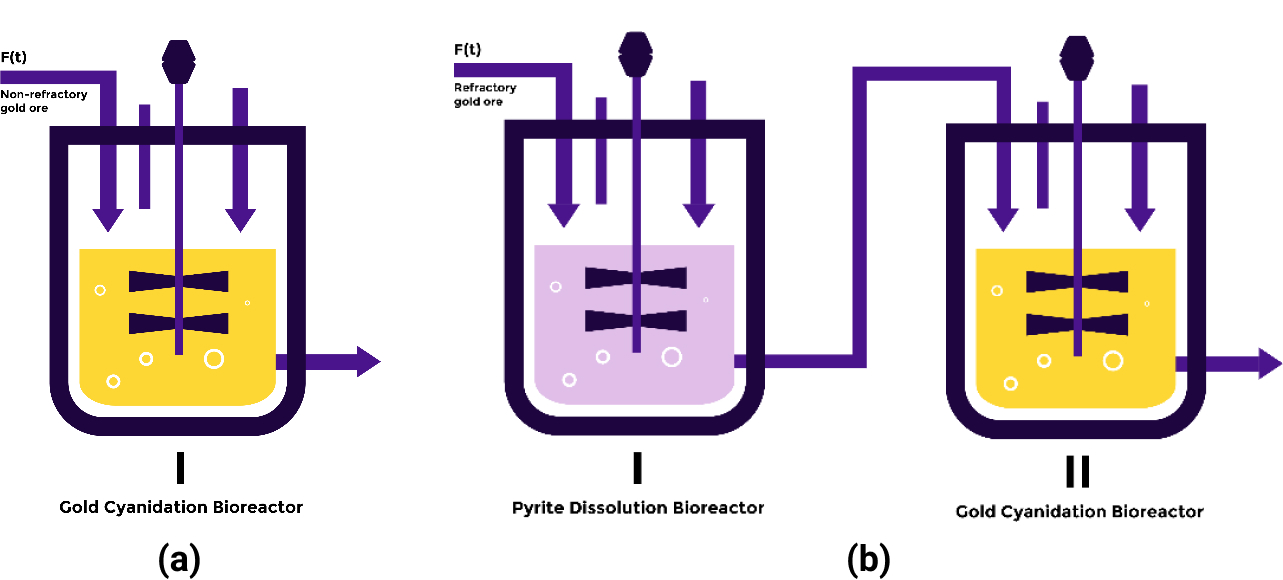
We determined the design of the bioreactor based on two types of gold ore: refractory and non-refractory. Refractory gold is a type of ores that is naturally resistant to extract by standard cyanidation process, while the non-refractory one is the opposite.
The refractory gold ores were obtained from Kulonprogo, Yogyakarta which can be reached for 1 hour from Universitas Gadjah Mada. Meanwhile, the non-refractory ones were obtained from Sumbawa, West Nusa Tenggara. The gold ores from Kulonprogo were trapped between pyrite, \(FeS_2\), in which Thiobacillus ferrooxidans could be used to oxidize the pyrite and collect the gold elements.
In this project, we used two types of bioreactor, one that harbors Chromobacterium violaceum for gold cyanidation, and the other one utilized T. ferrooxidans for pyrite dissolution. The non-refractory gold ore only uses 1 bioreactor that utilizesC. violaceum for gold cyanidation. Meanwhile, the refractory one uses 2 bioreactors (Figure 1).
Pyrite Dissolutions Bioreactor
In this reactor, we used wild-type T. ferrooxidans kinetics to the bioreactor.
These are the mass balance of semi-batch bioreactor1:
\[\begin{align*} \frac{d(XV)}{dt} & = V r_c(X,S) \\ \frac{d(PV)}{dt} & = V r_P(X,S) \\ \frac{d(SV)}{dt} & = F S_0 - \frac{1}{Y_{X/S}}V r_c(X,S) \end{align*}\]
The change of volume per time (hour) is defined as1:
\[\frac{dV}{dt} = F(t)\]
The cell growth is expressed as1:
\[\frac{dV}{dt} = F(t)\]
Monod model provides this equation to define cell specific growth rate as a function of substrate concentration1:
\[ \mu(S) = \mu_{max}\frac{S}{K_S + S} \]
The rate of product formation is assumed to be a fraction of cell growth by-product:1:
\[ r_P(X,S) = Y_{P/X}r_g(X,S) \]
Where \(Y_{P/X} \) is a product yield coefficient that serves as a ratio of product formation versus cell growth.1:
\[ Y_{P/X} = \frac{\mbox{product mass}}{\mbox{new cells mass}} \]
The mass of new cells from cell growth is assumed to have a constant ratio with mass of substrate consumed, thus1:
\[ Y_{X/S} = \frac{\mbox{new cells mass}}{\mbox{substrate consumed}} \]
| \( X \) | Cell concentration (grams/liter) |
|---|---|
| \( P \) | Product concentration (grams/liter) |
| \( S \) | Substrate concentration (grams/liter) |
| \( S_0 \) | Feed substrate concentration (grams/liter) |
| \( r_c \) | Rate of cell or biomass growth (grams/liter/hr) |
| \( r_P \) | Rate of product formation (grams/liter/hr) |
| \( Y_(P/X) \) | Product yield coefficient |
| \( Y_(X/S) \) | Cell growth coefficient |
| \( F(t) \) | Flowrate (liter/hr) |
| \( \mu(S) \) | Cell specific growth rate |
| \( \mu_{max} \) | Maximum cell specific growth rate |
| \( K_S \) | Half saturation constant |
In the semi-batch model, the volume is not constant. Thus, the dilution effect is affecting cell, product, and substrate concentrations. The differential equation for \(X\), \(P\), and \(S\) mass balance is extended according to chain rule1:
\[ \begin{align*} \frac{d(XV)}{dt} & = V\frac{dX}{dt} + X\frac{dV}{dt} = V\frac{dX}{dt} + F(t)X \\ \frac{d(PV)}{dt} & = V\frac{dP}{dt} + P\frac{dV}{dt} = V\frac{dP}{dt} + F(t)P \\ \frac{d(SV)}{dt} & = V\frac{dS}{dt} + S\frac{dV}{dt} = V\frac{dS}{dt} + F(t)S \end{align*} \]
Rearranging this mass balance equation with the previous equations gives1:
\[ \begin{align*} \frac{dX}{dt} & = - \frac{F(t)}{V}X + r_g(X,S) \\ \frac{dP}{dt} & = - \frac{F(t)}{V}P + r_P(X,S) \\ \frac{dS}{dt} & = \frac{F(t)}{V}(S_f - S) - \frac{1}{Y_{X/S}}r_g(X,S) \\ \frac{dV}{dt} & = F(t) \end{align*} \]
We used an assumption that states \(Fe^{3+}\) is a product that also acts as a competitive inhibitor for pyrite dissolution reaction. This assumption is based on the engineering cycle – design, build, test, and learn – that has been done on various possible inhibition schemes (competitive, uncompetitive, non-competitive) and various possible inhibition components ( \(Fe^{3+}\) and regulation by T. Ferrooxidans cells). The best scheme would be the one which gives the shortest reactor residence time.
The \(Fe^{3+}\) as competitive inhibitor assumption gives the following value for bioreactor-related variables mentioned in Table 2.
| Kinetic Variable | Source | |
|---|---|---|
| \( \mu_max \) | \( 1.25 hr^{-1} \) | 2 |
| \( K_S \) | \( 0.048 gram/liter \) | 2 |
| \( K_P \) | \( 0.06 gram/liter \) | 2 |
| \( Y_{X/S} \) | \( 0.324 gram/gram \) | 3 |
| \( Y_{P/X} \) | \( 0.4348 gram/gram \) | 4 |
| \( S_0 \) | \( 606.6225 gram/liter \) | 5 |
| Bioreactor Operating Condition | ||
| \( pH \) | \( 1.6 \) | 2 |
| \( \mbox{Temperature} \) | \( 30^{\circ} C \) | 2 |
In this model, it is assumed that the operating conditions are maintained from the beginning until the end of the process batch. Then, the reaction was modelled via Jupyter Notebook.
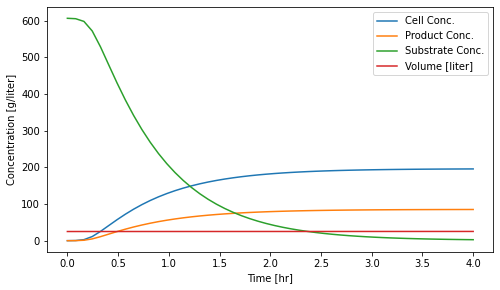
These are the results of cell concentration (\( X \)), product concentration (\( P \)), substrate concentration (\( S \)), and total volume (\( V \)) in 4 hours batch time:
| Variable | Initial (time = \( 0 s\)) | End of Batch (time = \(14400 s\)) | Unit |
|---|---|---|---|
| \( X \) | \( 0.05 \) | \( 1.95728572 \times 10^{2} \) | Gram/liter |
| \( P \) | \( 0 \) | \(85.08121549\) | Gram/liter |
| \( S \) | \( 606.6225 \) | \( 2.67506643 \) | Gram/liter |
| \( V \) | \( 25 \) | \( 25.2 \) | Liter |
To determine the volume of the bioreactor, we implemented 20% overdesign to prevent reactor flooding. Thus, based on the final total volume of one batch:
\[ 25.2\ \mbox{Liter} \times 120\% = 30.24\ \mbox{Liter} \]
References
- Shuler, M.L., Kargi, F., DeLisa, M., 2017, Bioprocess Engineering: Basic Concepts, Pearson Education.
- Jones, C. A. and Kelly, D. P., 1983, Growth of Thiobacillus ferrooxidans on ferrous iron in chemostat culture: influence of product and substrate inhibition, J. Chem. Tech. Biotechnology, vol. 33B, pp. 241-261. https://doi.org/10.1002/jctb.280330407
- Li, X., 2015, Engineering and Characterization of Acidithiobacillus ferrooxidans for Biotechnology Applications, Columbia University.
- Michaels, R. and Corpe, W. A., 1965, Cyanide Formation by Chromobacterium violaceum, American Society for Microbiology, vol. 89, no. 1.
- Pramuwijoyo, P., Idrus, A., Warmada, I.W., Yonezu, K., 2017, Geology, Geochemistry and Hydrothermal Fluid Characteristics of Low Sulfidation Epithermal Deposit in the Sangon Area, Kokap, Special Region of Yogyakarta, Journal of Applied Geology, vol. 2, np. 1, pp. 48-58. https://doi.org/10.22146/jag.42442