Team:Stony Brook/Results


Navigating to Results
Results
PP1 Assay
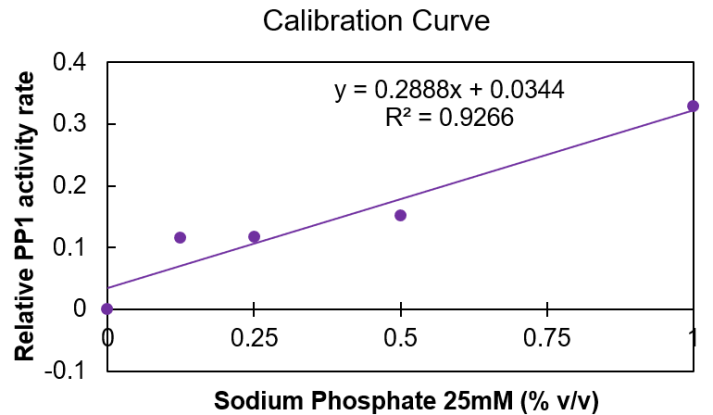
In order to indirectly test for MlrA expression, PP1 assay was used to quantify how much microcystin remained after incubating transformed E. coli with MC-LR. However, several issues arose when attempting to replicate the results from Moore et al. Firstly, the standard curve generated showed no inhibition by MC-LR, regardless of the concentration used. On the other hand, the curve from the literature demonstrated a clear decrease in relative PP1 activity with increasing MC-LR concentration. To determine whether lack of inhibition was due to the MC-LR solution used or a procedural error, it was decided to test another inhibitor of PP1. Given the limited time frame, it wasn’t possible to order a well-characterized, selective PP1 inhibitor, such as okadaic acid or tautomycin. Instead, 25mM dibasic sodium phosphate was used, since it is an inhibitor of other phosphatases and was readily available (Dean, 2002). However, unexpectedly, results from the PP1 assay demonstrated activation, not inhibition, in the presence of sodium phosphate (Figure 1). This is indicated by the fact that the log of the relative PP1 activity is positive and increases with increasing concentrations of sodium phosphate (as a percent of total reaction volume)—an inhibitor would produce negative values that increase in magnitude with greater inhibitor concentration.
Testing the Anchoring Construct
Despite the mixed results when generating the calibration curve, samples of transformed and wild-type bacteria were tested by the same protocol. Both cell lysate and whole cells were tested in order to get a sense for whether MlrA was present primarily on the outer membrane, as was hoped, or the cytoplasm, as in previous work (Dziga et al., 2012). However, as seen in Figure 2, these results proved to be inconclusive. While cell lysate of transformed BL21 did seem to result in reduced PP1 activity relative to the negative control (without sample exposure) at some concentrations, this was not true for all concentrations. Furthermore, these points did not show a strong correlation (R2=0.139). Similarly, data for whole cell samples from control and transformed E. coli had R2 values of 0.065 and 0.111, respectively. Given both the unsuccessful attempts at creating the calibration curve and the absence of strong correlations, it is unlikely that these results are an accurate representation of MlrA expression levels.

What we would do differently
Had we had more time, it would have been optimal to test the PP1 assay protocol with Phosphatase Inhibitor Cocktail 3 (produced by Sigma Aldrich), which is designed to be an effective inhibitor of PP1. It is composed of Cantharidin, (-)-p-Bromotetram isole, and Calyculin A. Then, we would have been able to definitively determine whether our MC-LR solution or protocol was at fault. Furthermore, in order to corroborate the results from the PP1 assay, a western blot for MlrA protein expression could have been conducted. Since MlrA contained a 6X His tag at the C-terminus, anti-His primary antibodies would be used for blotting. Alternatively, ELISA or LC-MS could have been carried out to determine the amount of microcystin present after incubation with samples.
References
Dziga, D., Wladyka, B., Zielińska, G., Meriluoto, J., & Wasylewski, M. (2012). Heterologous expression and characterisation of microcystinase. Toxicon, 59(5), 578–586. https://doi.org/10.1016/j.toxicon.2012.01.001
Dean, R. L. (2002). Kinetic studies with alkaline phosphatase in the presence and absence of inhibitors and divalent cations. Biochemistry and Molecular Biology Education, 30(6), 401–407. https://doi.org/10.1002/bmb.2002.494030060138


