Team:Stony Brook/Model


Navigating to Model
Model
Microcystin Degradation Model
In accordance with the objective of the project, a mathematical model was made to predict the relationship and overall efficiency of microcystinase (MlrA) in its degradation of the microcystin (MC-LR) toxin. Initially, we hypothesized that the rate of microcystin degradation would be proportional to the concentration of E. coli with microcystinase expression and the concentration of the microcystin toxin. A series of differential equations was developed to mathematically predict our hypothesized relationship.
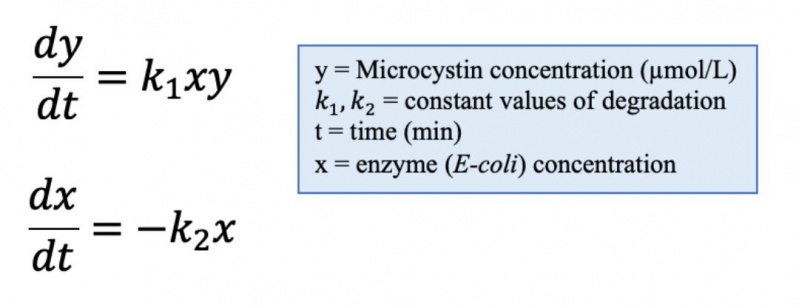
Through searching academic literature, constant values in common circumstances for the model were specified and are as follows:
- Initial E. coli concentration = 1e12 𝜇molecule/L
- Rate at which microcystinase was expressed (per minute, per E. coli) = 1e5
- Initial microcystin concentration = 500 μg/L
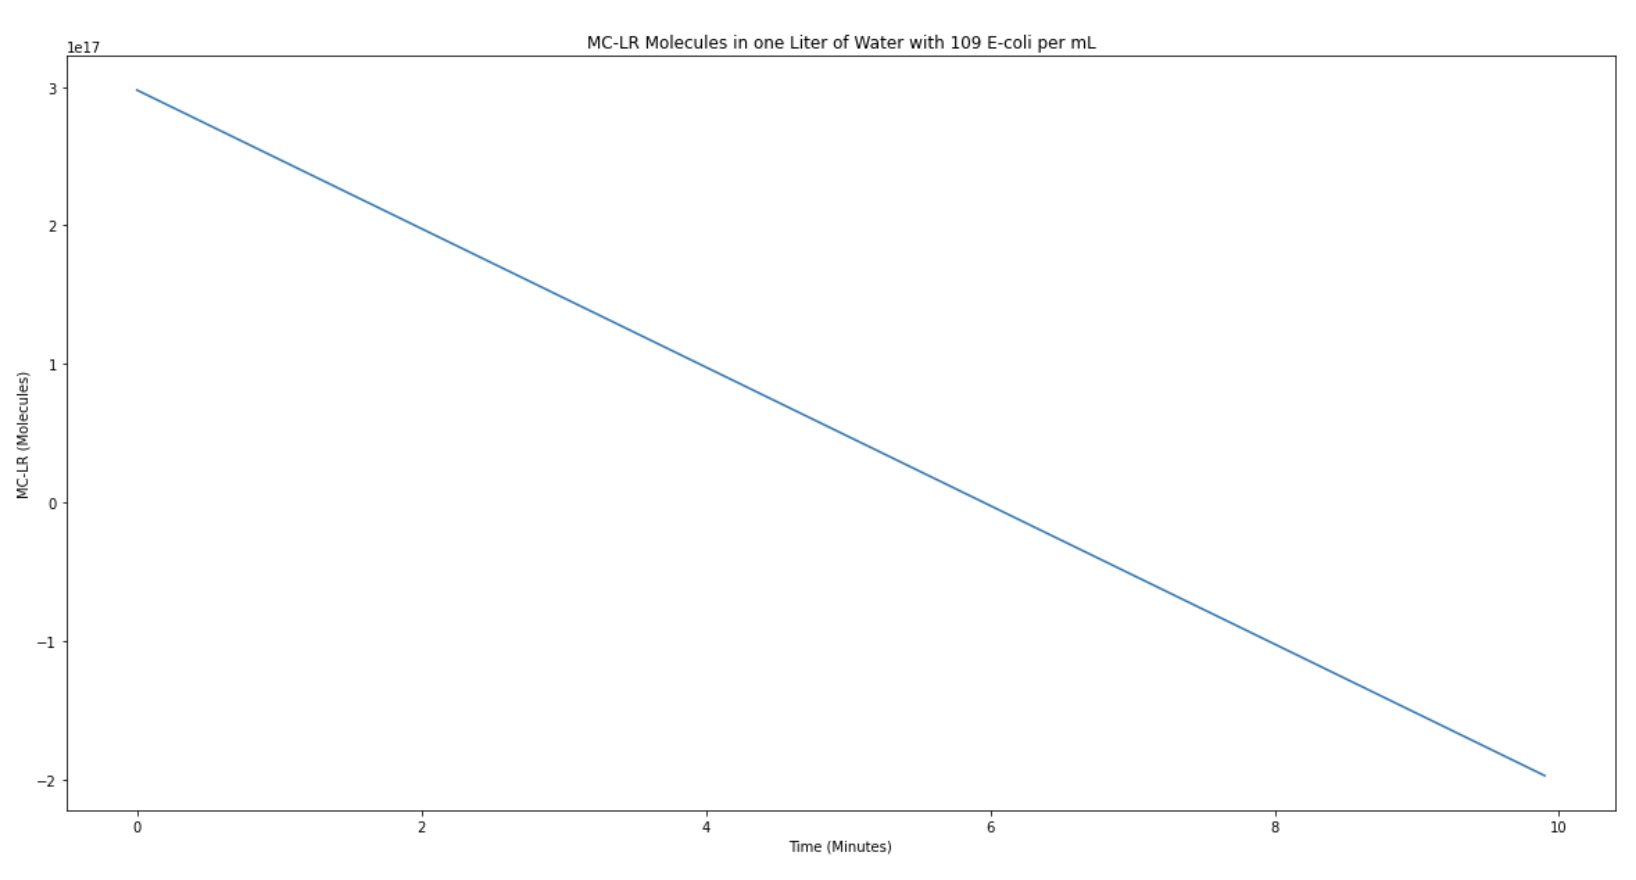
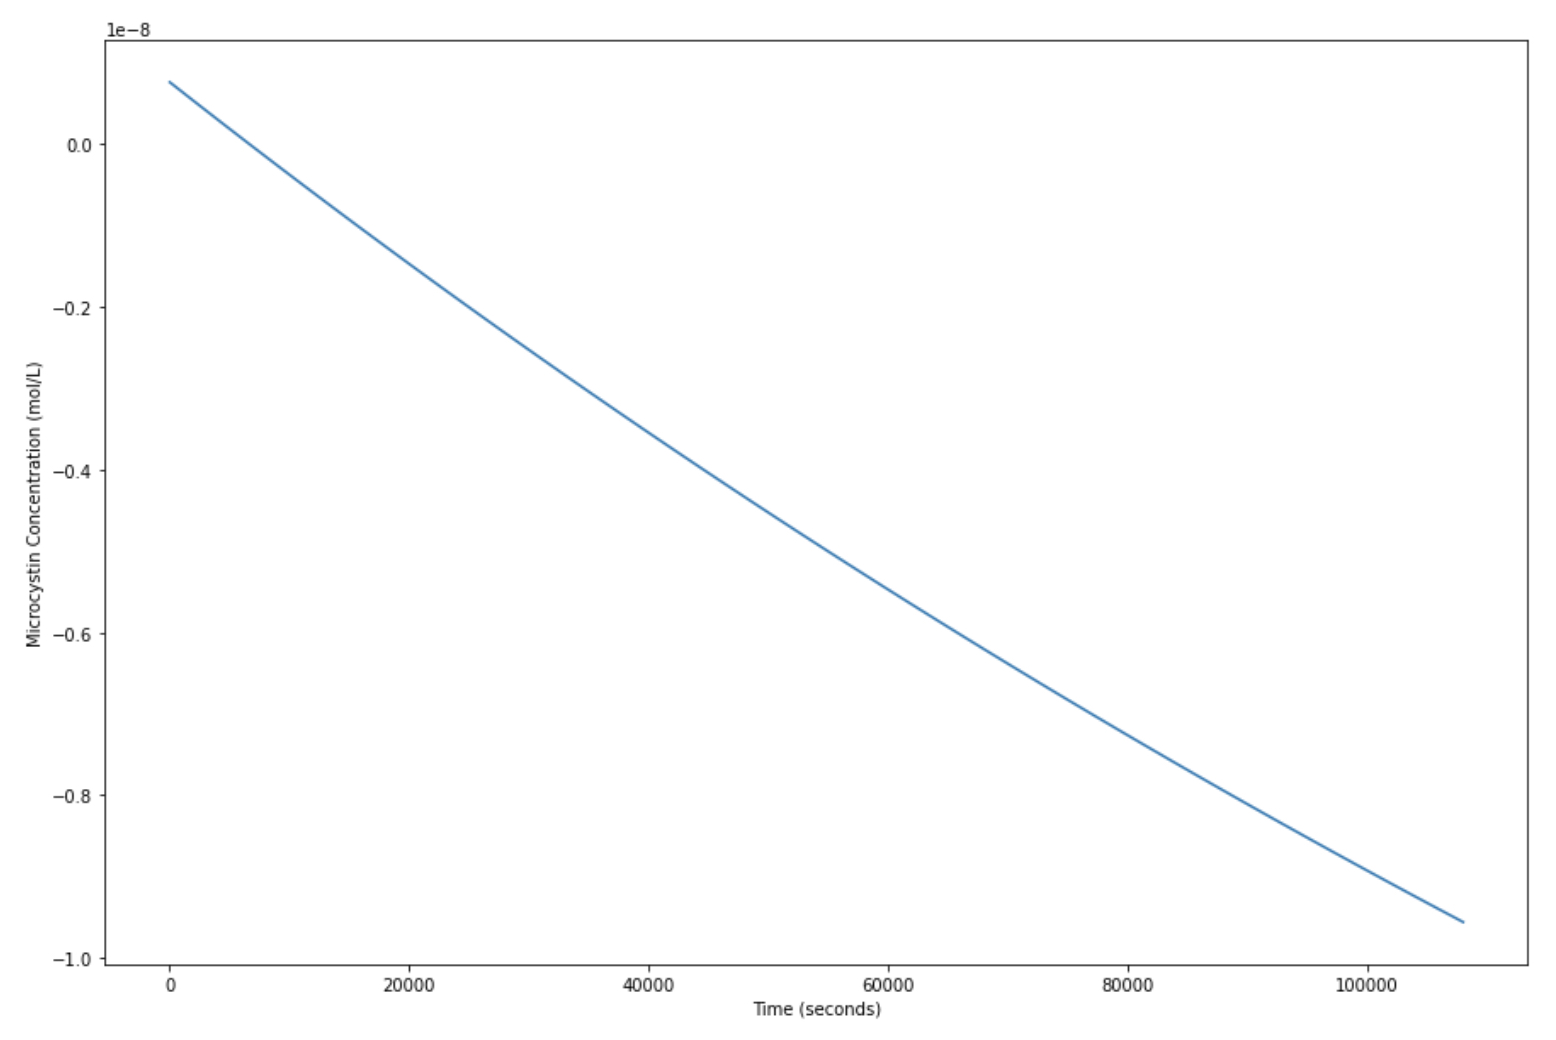
Through the defined differential system and adopted constants, a deterministic model of the rate of microcystin degradation based on given E. coli and microcystin concentrations was developed. The model predicts that the rate of microcystin degradation is 0.05 μmolLper minute given our constant values.
PP1 Assay Model
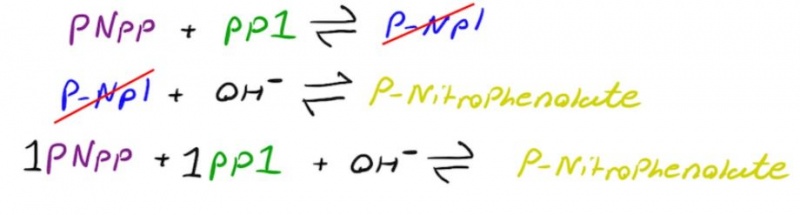
To experimentally obtain the results of microcystin degradation and verify the validity of our wet-lab solution, a protein phosphatase assay (PP1) was used to detect microcystin degradation over time. In this assay, PP1 interacts with p-nitrophenyl phosphate (pNPP) to form p-nitrophenol (pNP). In basic conditions, pNP is ionized and becomes p-nitrophenolate, a molecule that emits a detectable wavelength and discernable yellow color. However, if microcystin (MC-LR) is introduced, it will inhibit PP1 activity, leading to a solution that is less yellow (decreased absorbance). In theory, if the enzyme microcystinase (MlrA) is introduced, microcystin will be degraded and thus, there will be a greater amount of PP1 that can convert pNPP into colored p-nitrophenolate.
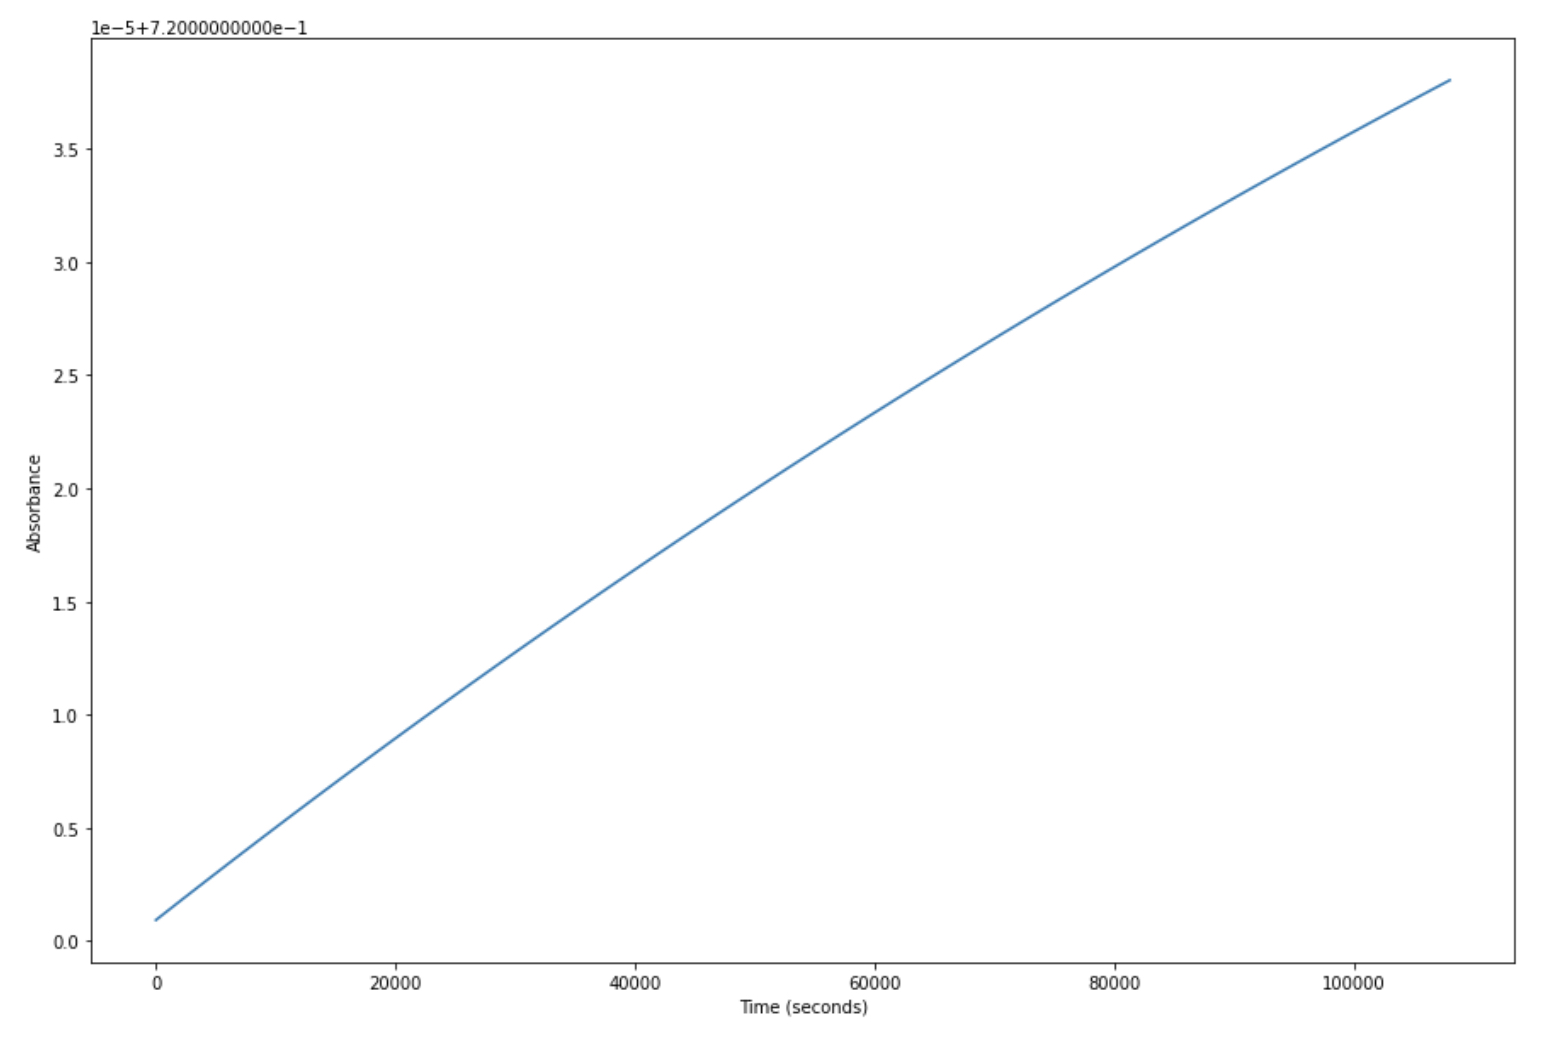
The model, Figure 4, is a prediction model of absorbance over time in the presence of MlrA. To verify the experimental results and discern theoretical values for the absorbance of pNPP in the presence of microcystin, a model was developed and introduced that takes into account the output of the absorbance over time for a PP1 - microcystin system when MC-LR was added. The relevant constants are in the linked Python notebook for reference purposes. According to the model, it is expected that the absorbance (of non-yellow light) to increase by around 0.01 every 100 seconds.
References
Dziga, D., Wladyka, B., Zielińska, G., Meriluoto, J., & Wasylewski, M. (2012). Heterologous expression and characterisation of microcystinase. Toxicon, 59(5), 578–586. https://doi.org/10.1016/j.toxicon.2012.01.001
Falconer, I., Bartram, J., Chorus, I., Kuiper-Goodman, T., Utkilen, H., Burch, M., & Codd, G. (n.d.). Chapter 5. SAFE LEVELS AND SAFE PRACTICES. Retrieved October 19, 2021, from https://www.who.int/water_sanitation_health/resourcesquality/toxcyanchap5.pdf
Milo, R. (2012). What is the concentration of bacterial cells in a saturated culture? Bionumbers.org.


