Team:NU Kazakhstan/Model

Background
Estimating rhamnolipid production from increased amount of NAD synthetase production
Since our project considers dual expression of rhlBA and nadE genes, we needed to predict the influence of potential increase of NH(3)-dependent NAD(+) synthetase in engineered P. putida. NAD synthetase produces NAD+ from nicotinic acid dinucleotide (NaAD) [1] (Figure 1).
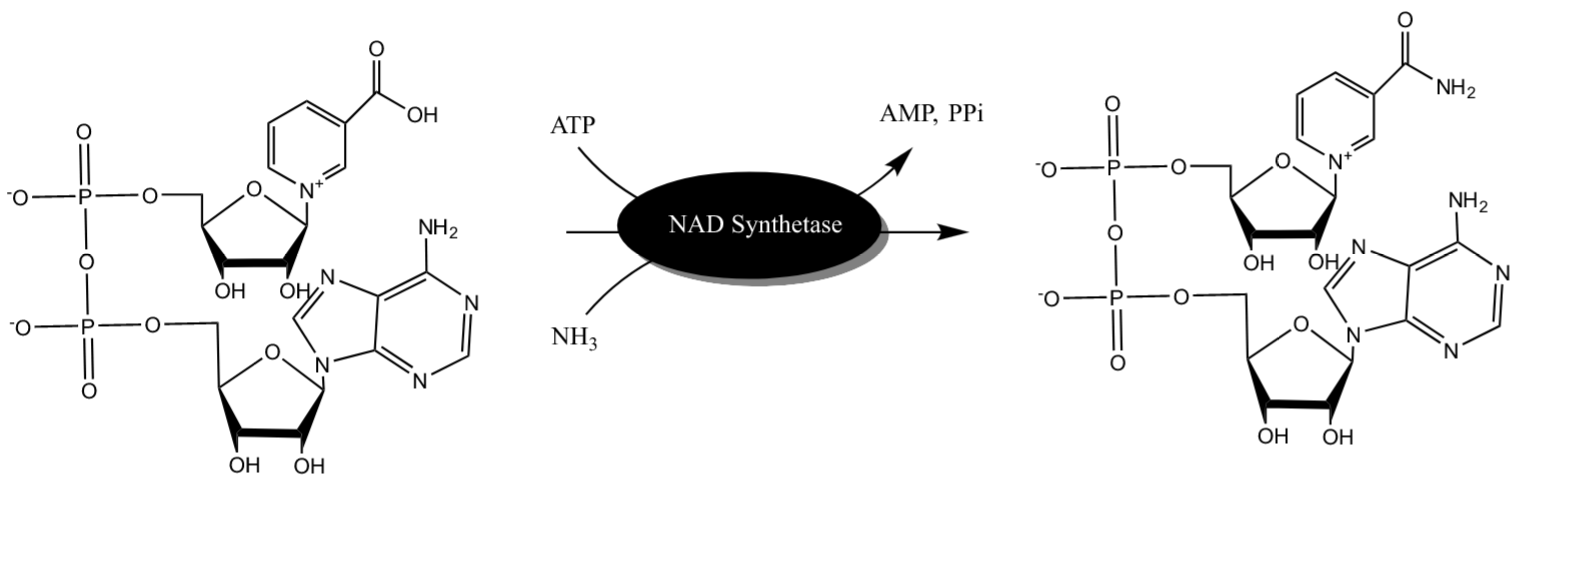
Figure 1. Illustration of NAD Synthetase reaction drawn in ChemDraw
It was tested that overexpression of nadE gene increases metabolic activity in P. putida [2] (Yong et al, 2013). Thus, it can be assumed that NaAD production is in abundance. There are 2 steps that our team will proceed:
- Obtaining Vmax by Michaelis Menten Equation at different enzyme concentrations
- Comparing the rate between different enzyme concentration and projecting the rhamnolipid production
1. Michaelis Menten
Michaelis Menten equation is used to measure the catalytic reaction rate by enzymes.
General equation for Michaelis-Menten is:
$$V=\frac{V_{max}*{[S]}}{K_{m}+{[S]}}$$where V is the velocity at a certain substrate concentration, Vmax is maximum rate of the reaction, and Km is Michaelis constant. Km is the substrate concentration at the rate half of the maximum velocity (Vmax) [3].
kcat is the turnover number, which allows to measure the rate independent from enzyme concentration:
$$k_{cat}=\frac{V_{max}}{[E]_{t}}$$2nd equation can be changed to:
$${V_{max}}={k_{cat}}*[E]_{t}$$Then, we can combine 1st and 3rd Equations to:
$$V=\frac{k_{cat}*[E]_{t}*[S]}{K_{m}+[S]}$$ The Km and kcat values are obtained from literature [4]. $$K_{m}=0.13\pm 0.02 \,mM$$ $$K_{cat}=0.20\pm 0.01 \,s^{-1}$$Since Km and kcat are known to us, only enzyme concentration is left to allow us to plot Michaelis Menten graph.
Since we did not obtain the enzyme concentration in our engineered P. putida, we have no enzyme concentration available at this time. However, this model can help to predict the rhamnolipid synthesis if [E]t is known.
$$V=\frac{0.2\, s^{-1}*\, [E]_{t}*[S]}{0.13\, mM+[S]}$$So we plotted example Michaelis Menten Equation if [E]t is 50mM in Matlab:
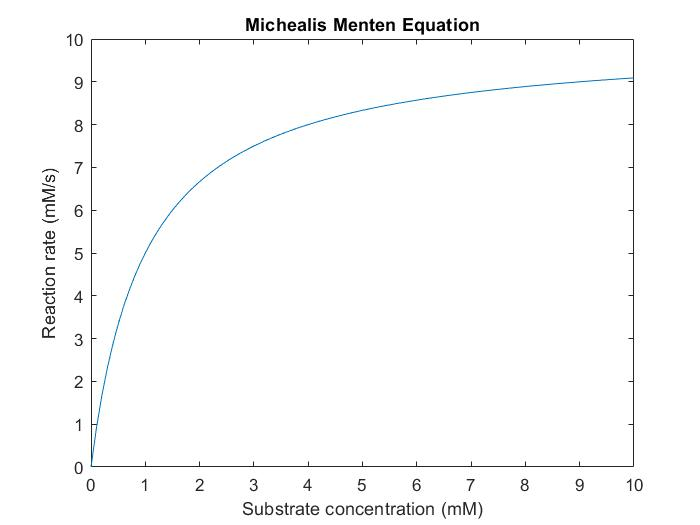
Figure 2. Michaelis Menten Graph of NAD synthetase activity
2. Comparing rate
As Vmax of NADS is known for engineered P. putida is known, we can compare it with Vmax of NADS from P. putida without inserted plasmid. We can create a ratio that can show to what extent the Vmax is increased.
$$ratio=\frac{V_{max}{(Engineered\, P.putida) }}{V_{max}{(Control\, P.putida) }}$$This ratio can also be interpreted as the increased magnitude in NAD+ concentration. We know that NAD can be used as an energy source for rhamnolipid production or can directly participate in rhamnolipid production in NADP form. However, for this modeling we will not consider the NADP effect as it should not be significant. Nonetheless, we believe that the ratio obtained above can be used as the increase in rhamnolipid production.
Reference List:
UniProt. (n.d.). nadE - NH(3)-dependent NAD(+) synthetase - Pseudomonas aeruginosa (strain PA7) - nadE gene & protein. https://www.uniprot.org/uniprot/A6VD32
Yong, X., Chen, Y., Liu, W., Xu, L., Zhou, J., Wang, S., Chen, P., Ouyang, P., & Zheng, T. (2013). Enhanced cadmium resistance and accumulation in Pseudomonas putida KT2440 expressing the phytochelatin synthase gene of Schizosaccharomyces pombe. Letters in Applied Microbiology, 58(3), 255–261. https://doi.org/10.1111/lam.12185
Libretexts. (2020, August 11). Michaelis-Menten Kinetics. Chemistry LibreTexts. https://chem.libretexts.org/Bookshelves/Biological_Chemistry/Supplemental_Modules_(Biological_Chemistry)/Enzymes/Enzymatic_Kinetics/Michaelis-Menten_Kinetics
De Ingeniis, J., Kazanov, M. D., Shatalin, K., Gelfand, M. S., Osterman, A. L., & Sorci, L. (2012). Glutamine versus Ammonia Utilization in the NAD Synthetase Family. PLoS ONE, 7(6), e39115. https://doi.org/10.1371/journal.pone.0039115
3D model
Our team also wanted to illustrate NAD synthetase and rhamnosyltransferase proteins in a 3D model. To this day, we have poor understanding of how to predict the 3D structure of proteins only by looking at their primary structure although proteins can fold in a couple of seconds or less. This is called Levinthal’s paradox [1]. However, it is possible to predict 3D structure of protein by comparative analysis where proteins with similar primary structure may have similar 3D structure.
We used our amino acid sequence to check their tertiary/quaternary protein structures. This way, we were able to prove the used amino acid sequence translates to the correct protein. We used a Phyre2 online program which matches the sequences with other protein sequences in their database [2]. We also were able to predict the rhamnosyltransferase shape.
1. Rhamnosyltransferase
We run our amino acid sequences of RhlA and RhlB in the Phyre2 program. However, it was not able to match our sequence with other proteins. Nonetheless, according to Essentials of Bioinformatics [3], even significant differences in amino acid sequence can have similar folding structure. Therefore, we searched for similar proteins to what Phyre2 gave more coverage %. For RhlA, the probable hydrolase from Pseudomonas aeruginosa had 17% coverage to our model.
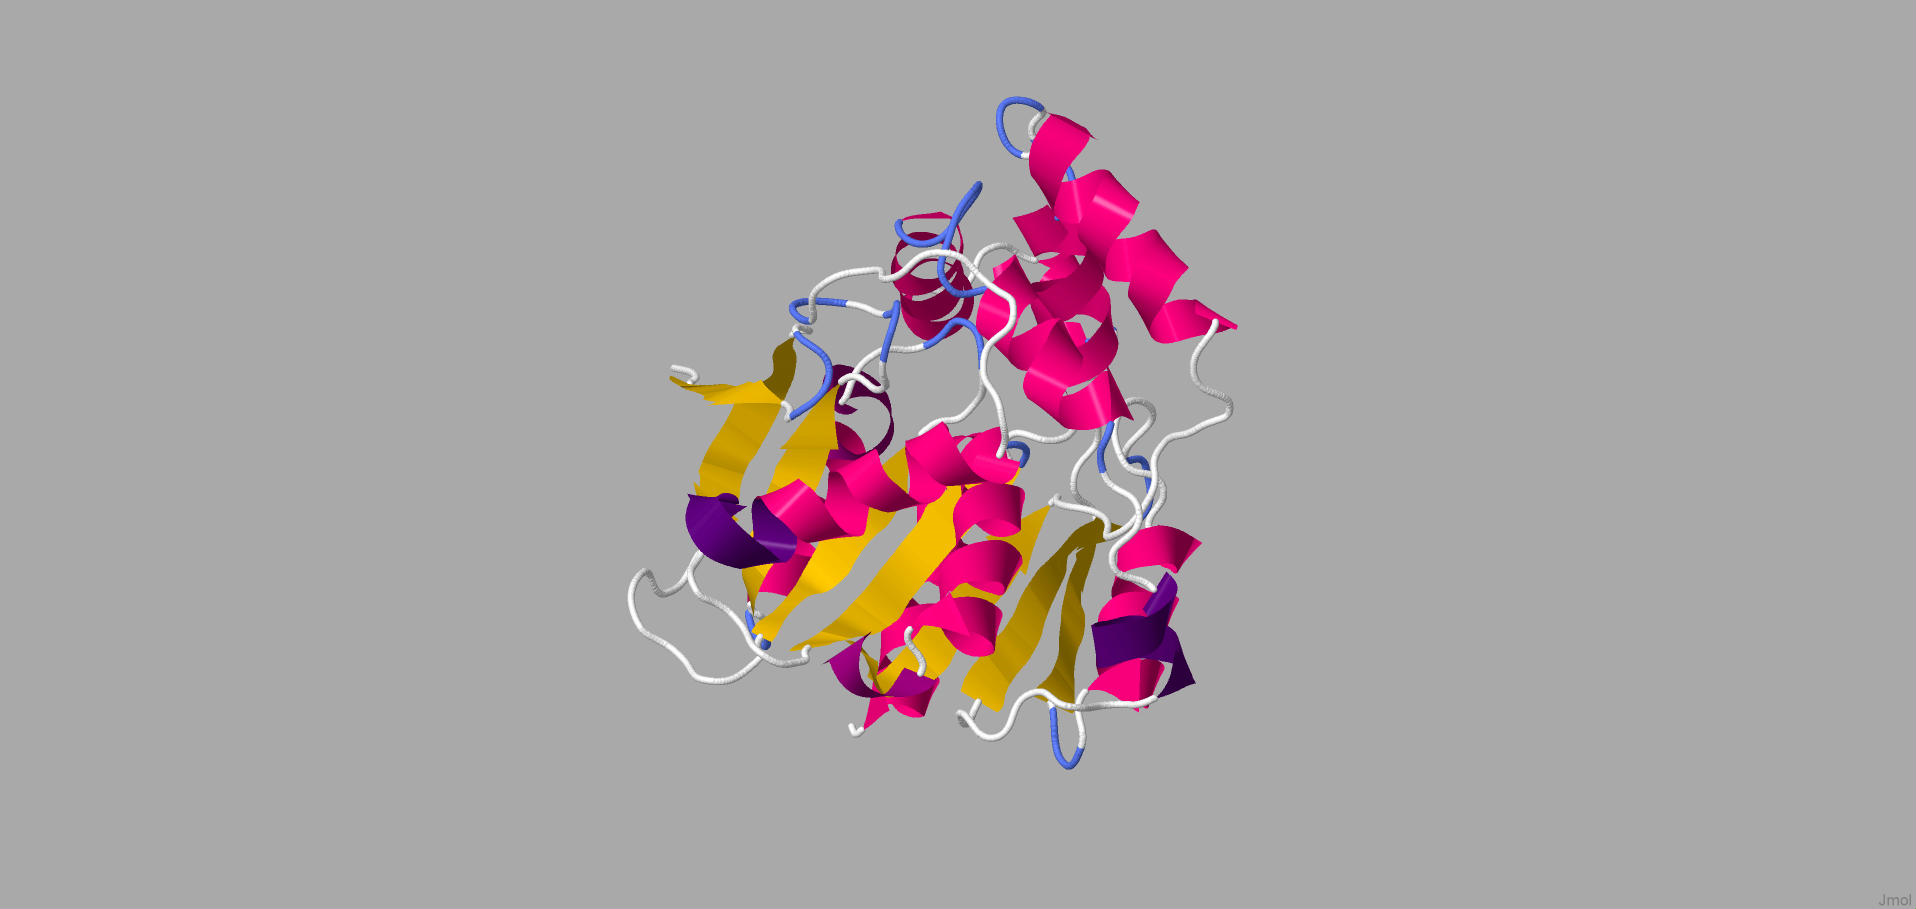
Figure 1. The illustration of hydrolase which is closest structure to RhlA
According to Figure 1, hydrolase has 11 α-helices and 8 β-sheets. It can be assumed that the structure of RhlA is similar to the structure of hydrolase above. On the other hand, Phyre2 was able to correspond to the amino acid sequence of RhlB to transferase group proteins.
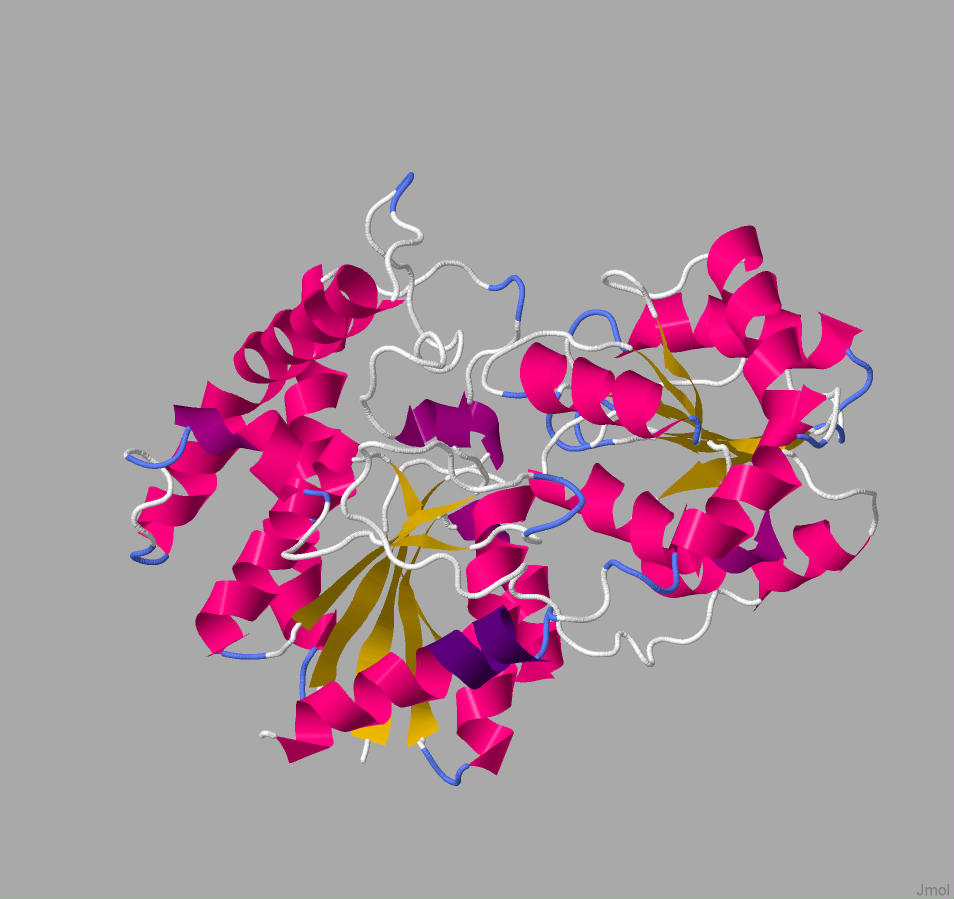
Figure 2. The illustration of glucosyltransferase family protein structure
We additionally searched for similar structures in Protein Data Bank and we found the 3D model of glucosyltransferase (depicted in Figure 3). However, this protein was not properly labeled, thus, we wanted to compare the data we obtained from Phyre2 with this model. The structure in Figure 2 and green part of the structure in Figure 3 has a similar shape and position of α-helices and β-sheets. Thus, it can be assumed that the green part of rhamnosyltransferase is RhlB. Moreover, we also were able to visualize the mono-rhamnolipid site at this part (Figure 4).
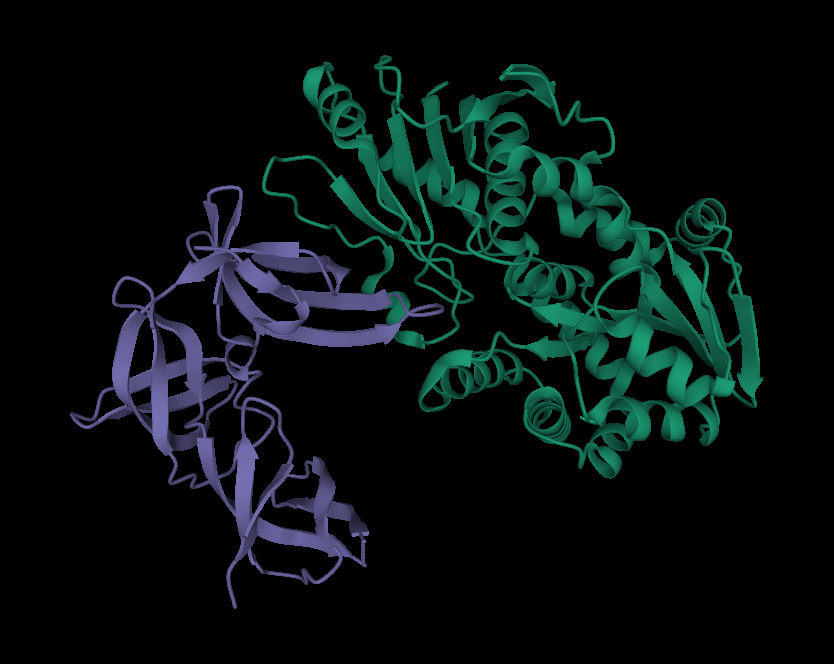
Figure 3. The 3D illustration of rhamnosyltransferase by RCSB PDB
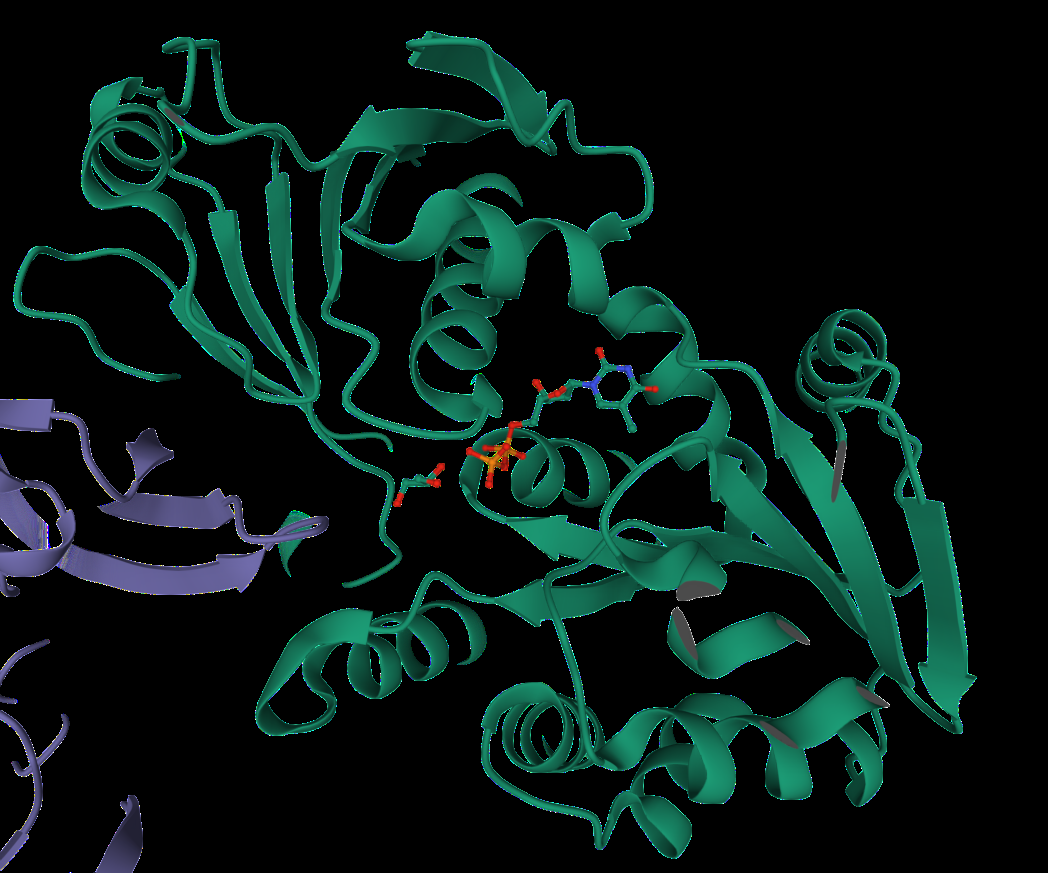
Figure 4. The illustration of rhamnolipid as a ligand on rhamnosyltransferase chain B
However, the purple part in Figure 3 and Figure 1 are significantly different from each other. As it was stated in PDB, this state acts as a regulation site for this enzyme, thus, it is not RhlA.
Even if there is poor 3D visualization of RhlA, it can be concluded that green tertiary structure and in Figure 3 and Figure 1 together could be similar to rhamnosyltransferase structure in Pseudomonas aeruginosa.
2. NH3+ -NAD+synthetase
The Phyre2 program matched our amino acid sequence with actual NH3-NAD synthetase in Pseudomonas.

Figure 5. NAD synthetase 3D structure
In conclusion, we were able to check our amino acid sequences, and we were able to predict the model of rhamnosyltransferase structure.
Reference List:
Corvalan, C. (n.d.). Why Does Predicting a Protein’s 3D Structure Matter? The Biological Impact of AI System AlphaFold. PI IP LAW. https://piip.co.kr/en/blog/alphafold-protein-structure-prediction-importance-1
Phyre2. (n.d.). Phyre2. https://www.sbg.bio.ic.ac.uk/phyre2/html/page.cgi?id=index
Patel, B. (2019). Structural Bioinformatics. In V. Singh & D. Patel (Eds.), Essentials of Bioinformatics (Vol. 1, pp. 168–197). Springer Nature Switzerland. https://doi.org/10.1007/978-3-030-02634-9_9
Optimization of substrate type for rhamnolipid production by machine learning
Our team wanted to predict rhamnolipid production by our P. putida through machine learning with multi-omic modeling by Occhipinti et al [1]. So we wanted to analyze the metabolic network of rhamnolipid production. So, we were able to determine which carbon source and in which combination is optimal to use. The sugars that were considered in this model are glucose, fructose, benzoate, sucrose, myristic acid, and glycerol.
Methods
Firstly, we used Flux balance analysis (FBA) to metabolic pathways as it did not require enzyme kinetics and substrate concentration. Therefore, it is easier to compute large scale metabolic networks than other modeling techniques.
The set of reactions is represented by the stoichiometric matrix (S) with n x m dimensions.
n = reactions, m = metabolites
We assume that the system is in a pseudo steady state where the net rate of all reactions is zero.
S ✕ v = 0
where v is the vector of the flux distribution of n
The restrictions like capacity and directionality are represented by the upper boundary - Vmax - and lower boundary - Vmin. Thus. the range of flux can hold is
Vmin ≤ v ≤ Vmax
So, max c * v such that (where vector c can allow us to choose rhamnolipids or biomass for our objective function):
S ✕ v = ŷ
ŷ = 0 if Mi ∈ internal metabolites
ŷ ∈ R if M ∈ exchange metabolites
Using COBRA Toolbox in MatLab with GLPK (linear programming solver), geometric FBA was simulated
Transcriptomics - is the study of the transcriptome which is the set of RNA transcripts. Comparing transcriptomes allows us to identify genes that are differentially expressed due to the different treatments [2]. In our case, this is two different Pseudomonas putida: wild type and mutant.
Reason behind using gene expression data was to make profile-specific metabolic models for each gene. The constraints are similar to range flux:
Vminφ(θ) ≤ v ≤ Vmaxφ(θ)
φ is the map of θ for each gene
φ(θ) = [1+ℽ|logθ|]sgn(θ-1)
sgn operator is needed to return the vector of ±1; ℽ is the indicator of the rate of production by specific enzyme. For this model, ℽ = 1 since it will allow the logarithmic effect of the transcriptomic value.
We also incorporated gene expression data of P. putida from GEO (GSE28257). Overall, this dataset contains expression levels θ of 5547 genes for 80 types of wild and Tn5 mutant P. putida. So we aimed to obtain a maximum amount of rhamnolipid production from each condition-specific model.
The wild type and Tn5 mutant flux rates were compared with each other. This should allow us to identify the set of reactions with p value<0.05, which is called a set of differentially active reactions (DARs). These DARs should allow us to investigate the significantly disrupted metabolic pathways between wild type and mutant groups where rhamnolipid production is at its maximum. The variable selection regression method was used to identify the genes that influence the flux rates of the DARs.
Assume that x = (x1,x2,... xt)T is the response or FBA solution vector, while Y=(y1|...|yp) is the gene expression matrix. Additionally, lets consider j = 1,..., p as predictor from xj = (x1j,x2j,... xtj)T. Elastic net regularization criterion (linear combination of ridge and lasso regression penalties) was used for fixed λ1 and λ2:
L(λ1,λ2, β) = ||x-Yβ||2 + λ1||β||1 + λ2||β||2
β is the vector of coefficients (β1, β2, … βp).
$$\left \| \beta \right \|_{1}=\sum_{j=1}^{p}\left | \beta _{j} \right |$$ $$\left \| \beta \right \|_{2}=\sum_{j=1}^{p}\ {\beta _{j} }^{2}$$
β=argminβ{L(λ1,λ2, β)}
If we consider that α = λ2/(λ2+λ1) and λ = λ1+λ2, then β should transform to:
β=argminβ = ||x-Yβ||2 + Pα,λ(β)
Pα,λ(β) is the elastic net penalty function:
Pα,λ(β) = λ[(1-α) ||β||1 + α||β||2]
By applying data accessible we were able to find that the rate of uptaking sugars and rate of production of rhamnolipids was linear. Moreover, this program allowed us to predict that myristic acid contributes to the optimal rhamnolipid production [3].
Reference List:
Occhipinti, A., Eyassu, F., Rahman, T. J., Rahman, P. K. S. M., & Angione, C. (2018). In silico engineering of Pseudomonas metabolism reveals new biomarkers for increased biosurfactant production. PubMed. Published. https://pubmed.ncbi.nlm.nih.gov/30588397/
Transcriptomics. (n.d.). Nature. Retrieved October 18, 2021, from https://www.nature.com/subjects/transcriptomics
Cross, J. (2006). MEDLINE, PubMed, PubMed Central, and the NLM. Editors’ Bulletin, 2(1), 1–5. https://doi.org/10.1080/17521740701702115

CONTACT
igem@nu.edu.kz
Kabanbay batyr av., 53, Nur-Sultan, Kazakhstan
FOLLOW


