Team:LZU-CHINA/Model

Introduction
SARS-CoV-2 relies on angiotensin converting enzyme 2 (ACE2) on human cells in the process of entering cells. In order to reduce the expression of ACE2 on cell surface, we constructed the CRISPR-Cas13d system, using gRNA-mediated Cas13d protein to reduce the coding RNA (tagetRNA) level of ACE2 receptor protein, thereby reducing protein expression. The following sections will show our work from both micro and macro perspectives through two mathematical models.
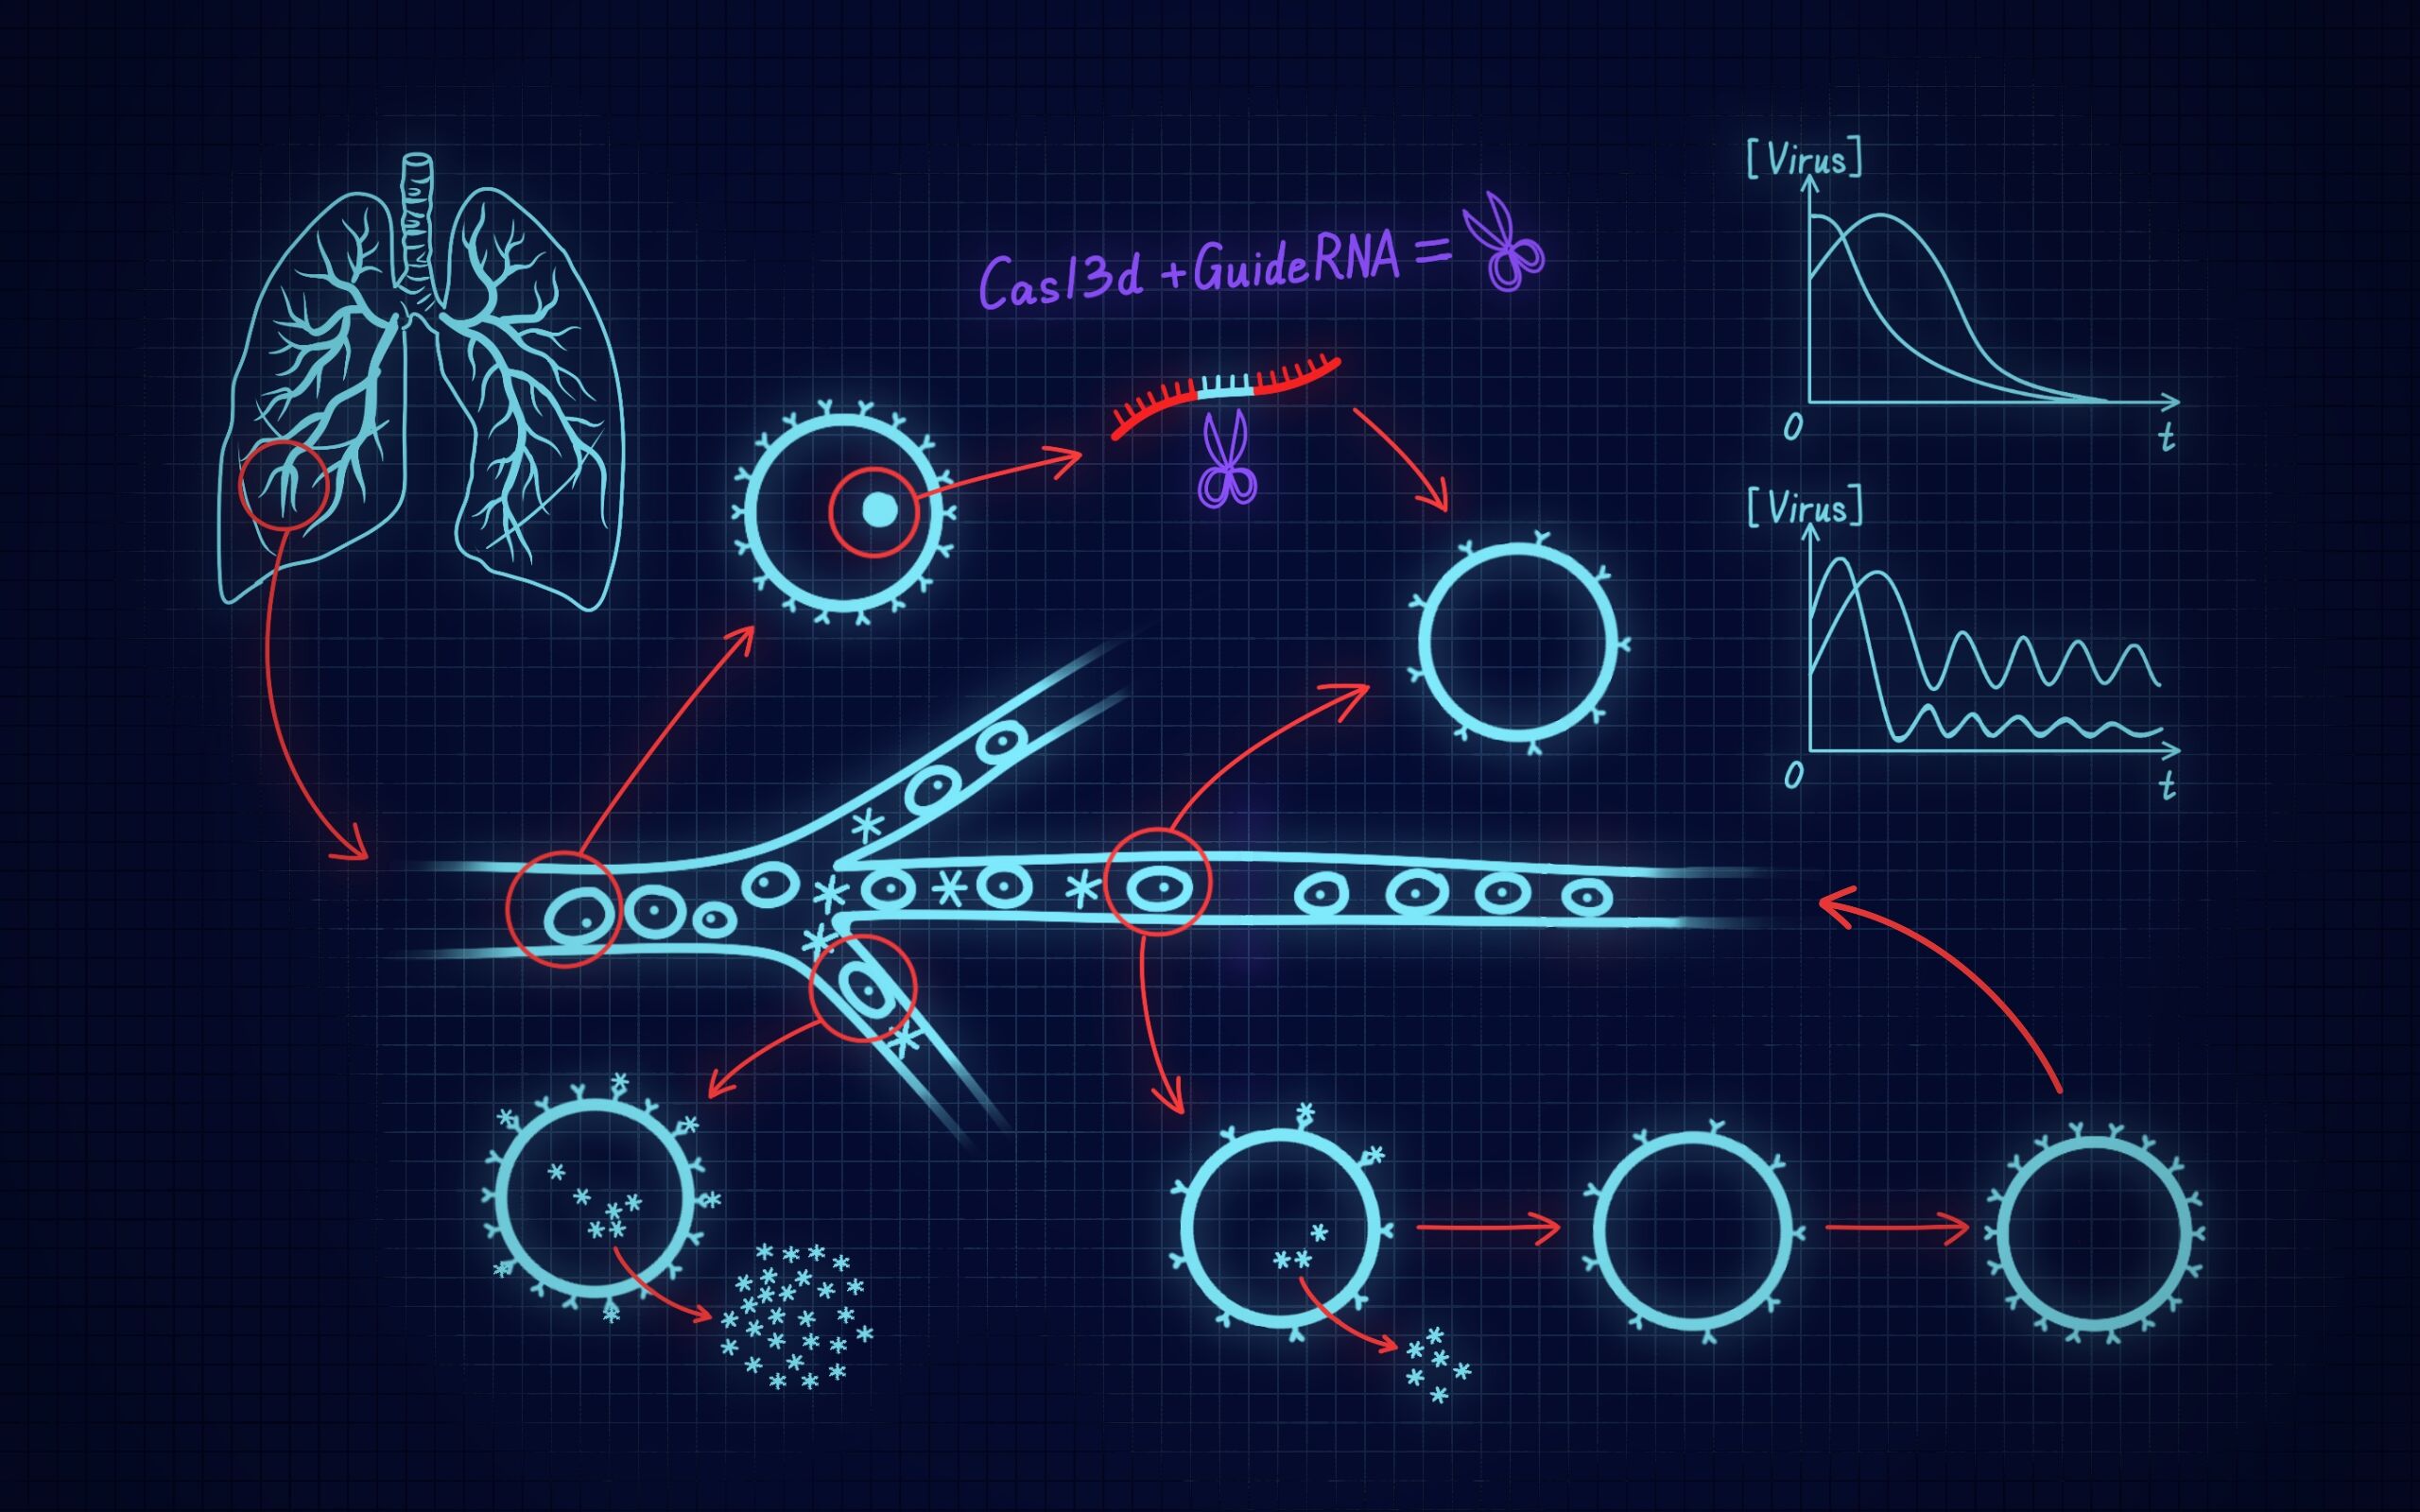
I: CRISPR-Cas13d system cutting targetRNA based on Michaelis-Menten equation
The high-intensity fluorescence signal corresponding to the specific trans-cleavage activity of Cas13d protein mediated by gRNA after reaction with target RNA was used to characterize the protein reduction level. In view of the above process, we establish an ordinary differential equation model based on Michaelis-Menten equation to predict the change of high intensity fluorescence signal with time.
Michaelis-Menten equation
Michaelis-Menten equation is a rate equation describing the relationship between the initial rate of an enzy- matic reaction and the substrate concentration

where Vmax is the reaction rate when the enzyme is saturated by the substrate, [S] is the substrate concen- tration, and Km is called the Michaelis constant (its value is the substrate concentration when the maximum reaction rate is half).
Model assumptions
To establish a more reasonable mathematical model, the following assumptions are made:
1.The conditions provided by the in vitro validation system meet the Michellian equation hypothesis.
2.Full contact of all substances involved in the reaction process.
3.Stable diffusion of substances during the reaction.
4.During the gRNA-mediated Cas13d protein-targetRNA reaction, the rate of substance change at each time is only related to the content of the reactants involved in the reaction at that time.
Process 1: gRNA mediated Cas13d

[Cas13d]: The function of Cas13d content in the reaction changing with time.
[crRNA]: The function of crRNA content in the reaction changing with time.
[Cas13dcrRNA]: The function of Cas13dcrRNA content in the reaction process changing with time.
kcr: The ratio of the change rate of [Cas13d] or [crRNA] over time to [Cas13d] · [crRNA].
Process 2: gRNA-mediated Cas13d-targetRNA reaction
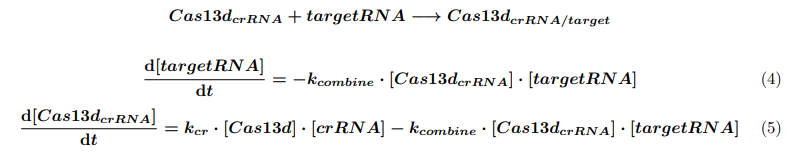
[targetRNA]: In vitro validation of the time-dependent function of targetRNA content in the reaction system.
[Cas13dcrRNA/target]: The function of Cas13dcrRNA/target content produced by reaction changing with time.
kcomebine: The ratio of the change rate of [targetRNA] over time to [Cas13dcrRNA] · [targetRNA].
Process 3: Cas13d with specific trans-cutting activity reacts with reporterRNA to produce fluorescence signal
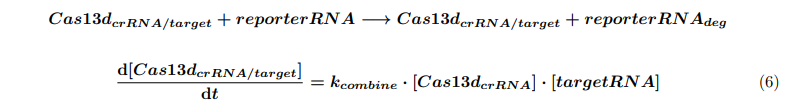
The following equations can be obtained by using the above Mie equation:

reporterRNA: In vitro validation of the time-dependent function of reporterRNA content in the reaction system.
reporterRNAdeg: A time-dependent function of product content after reporterRNA reaction.
kcat: The ratio of the change rate of [reporterRNA] to the product of [Cas13dcrRNA/target] and the first derivative of the rate obtained from the Michaelis equation.
Determined parameter values
Referring to the relevant articles[1][2], we can preliminarily determine
kcr = 1/(min) and KM = 500nM. In order to further determine kcombine and
kcat, we adjust different parameters under the premise of keeping other
parameters and initial values unchanged, and finally obtain the parameters
consistent with the experiment. The final parameter values are determined as
: kcr = 1/(min), kcombine = 0.001/(nM.min), kcat = 5/(min), KM = 500nM.
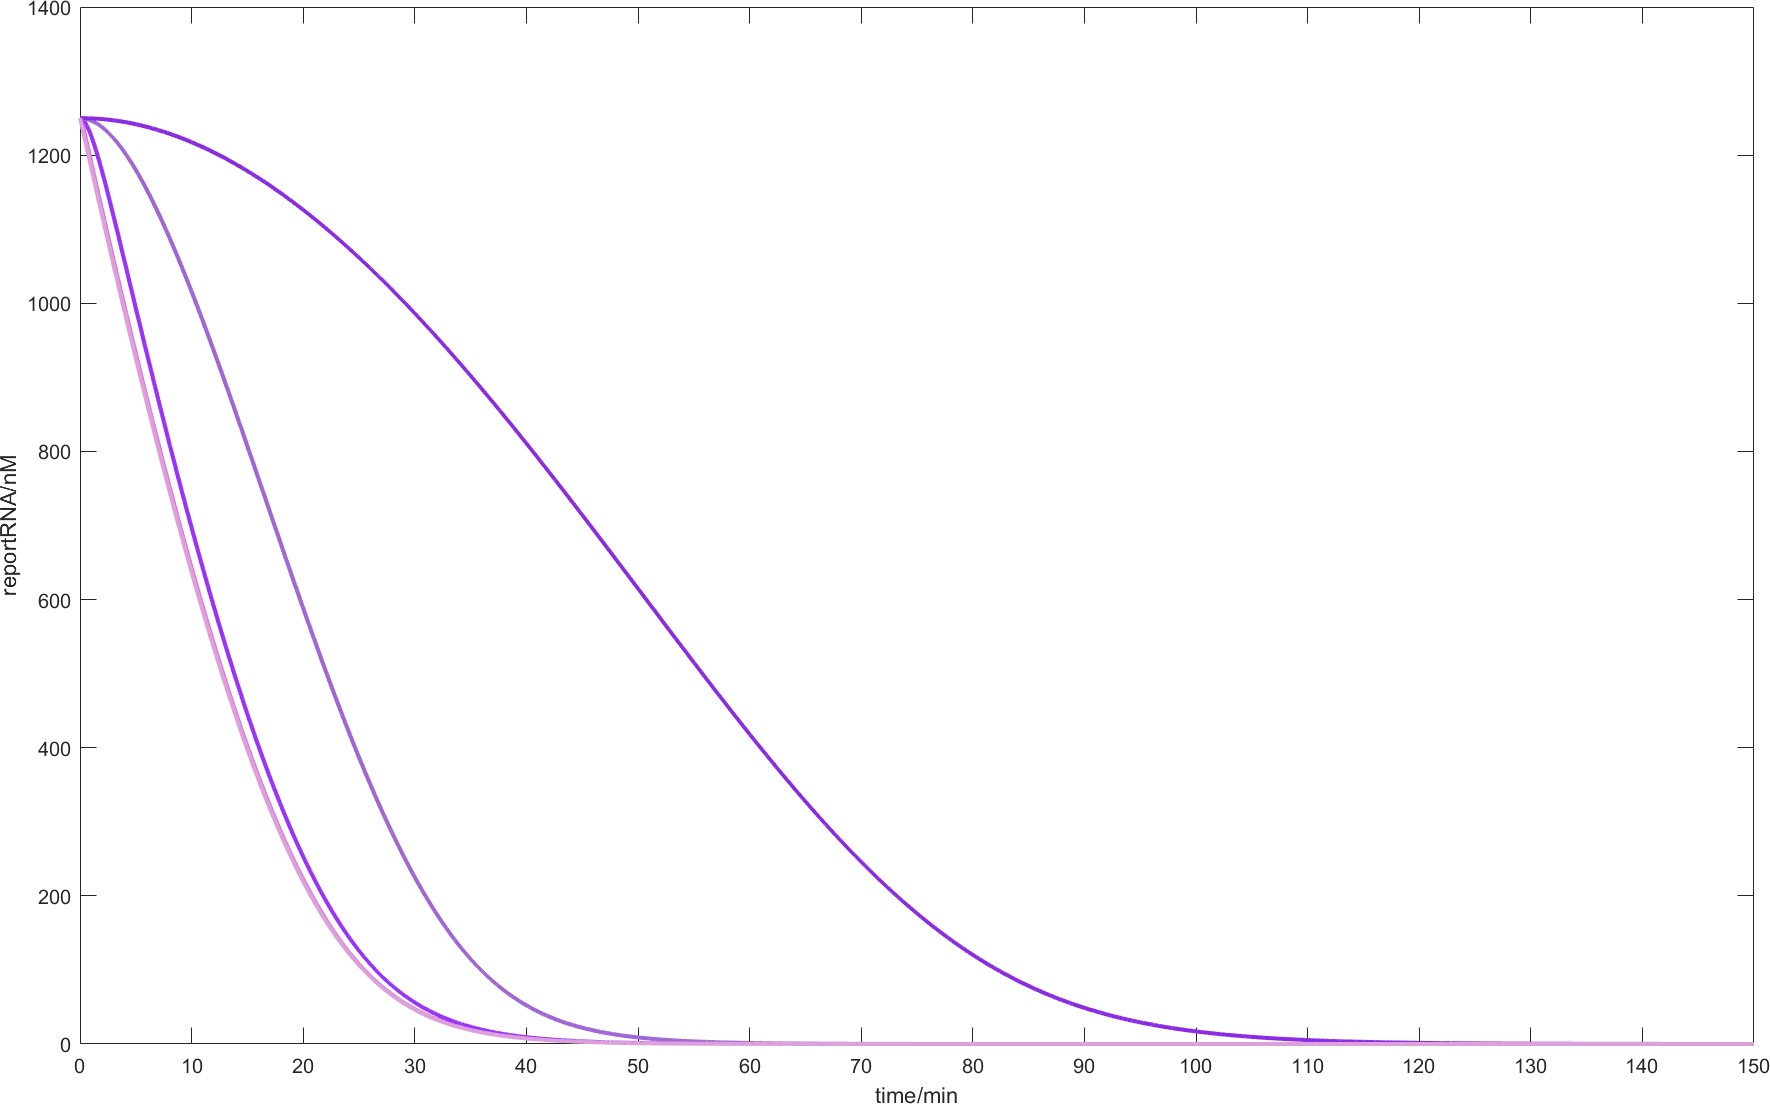
Fig.1.
When the parameters are kcr = 1/(min), kcat = 5/(min), KM = 500nM and the initial conditions are
[Cas13d] = 240nM, [crRNA] = 100nM, [targetRNA] = 19.0912nM, [reporterRNA] = 1250nM,
the residual level of reporterRNA corresponding to different kcombine values changes over
time. From left to right kcombine values 1, 0.1, 0.001, 0.0001.
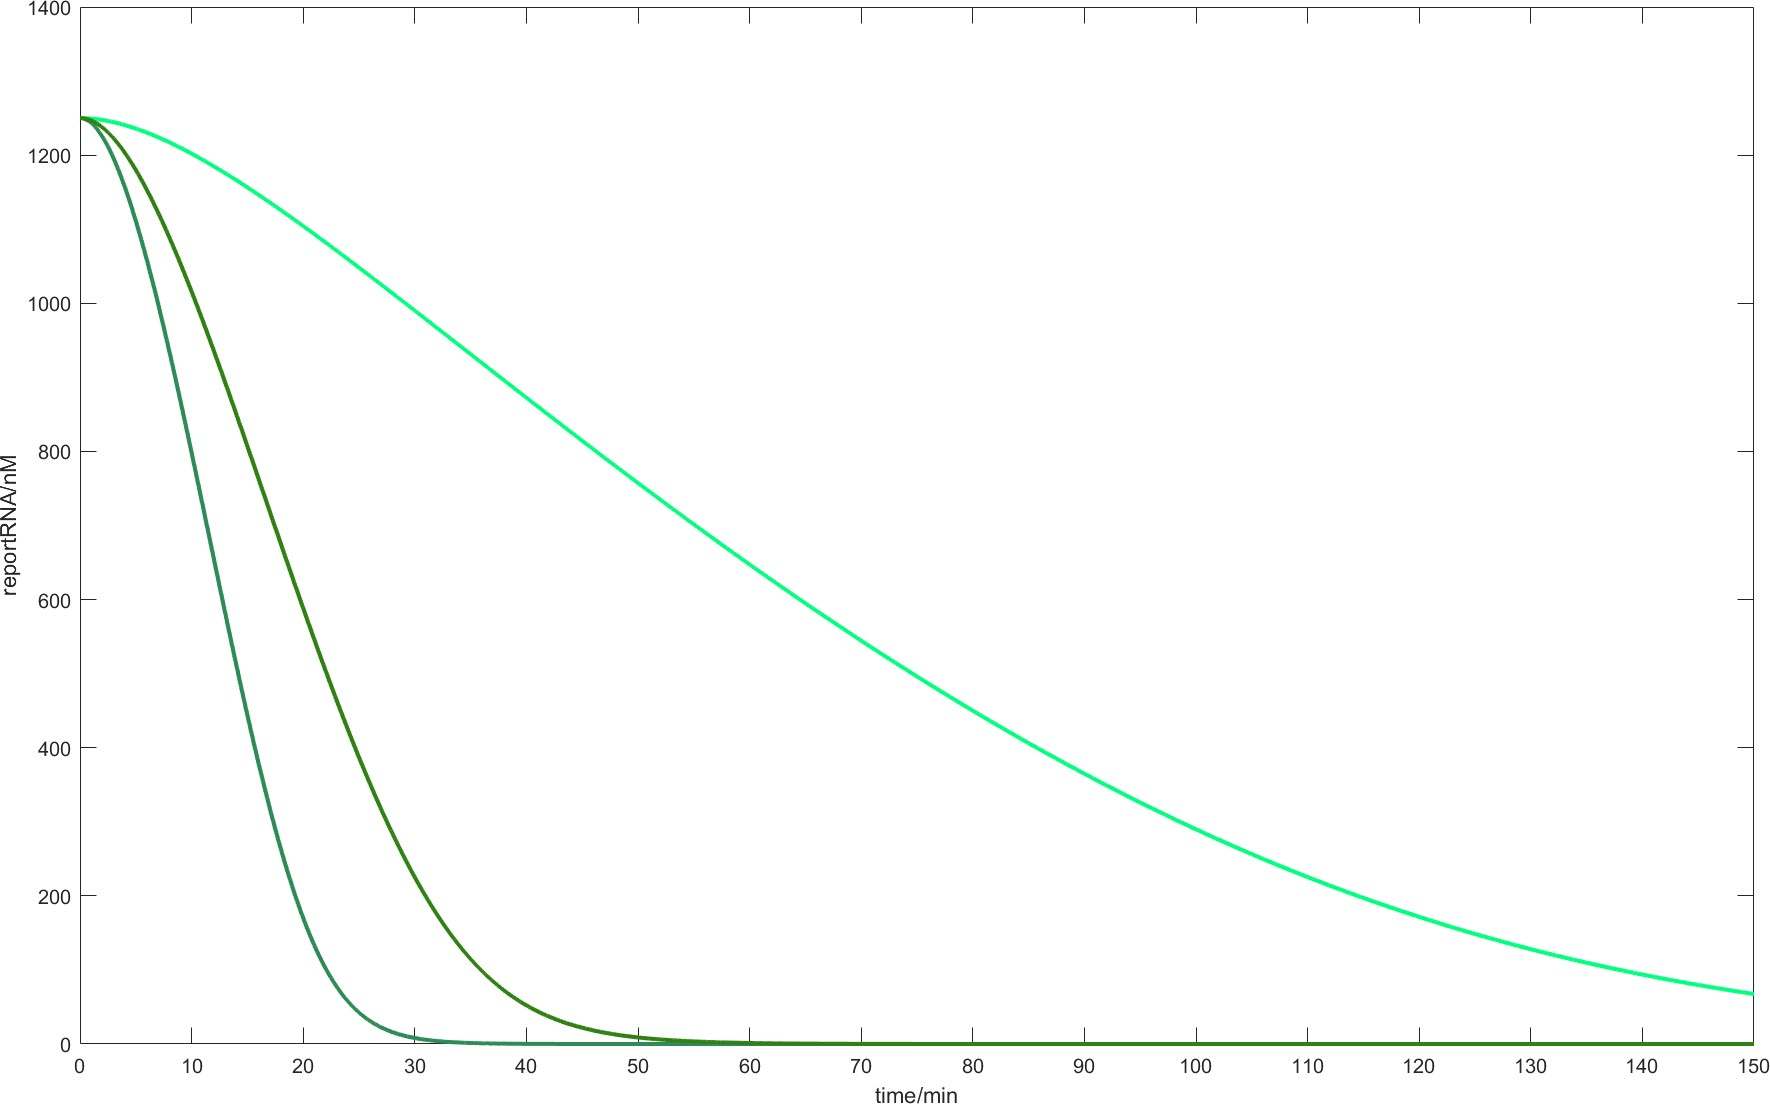
Fig.2.
When the parameters are kcr = 1/(min), kcombine = 0.001/(nM.min), KM = 500nM
and the initial conditions are [Cas13d] = 240nM, [crRNA] = 100nM,
[targetRNA] = 19.0912nM, [reporterRNA] = 1250nM, the residual level
of reporterRNA corresponding to different kcat values changes over time.
From left to right kcat values 1, 5, 10.
Model verification
We finally got a model consistent with the experimental results in vitro. The model predicted that the reaction system could reach a stable state in about 60 minutes, and the experimental results were 65 minutes.
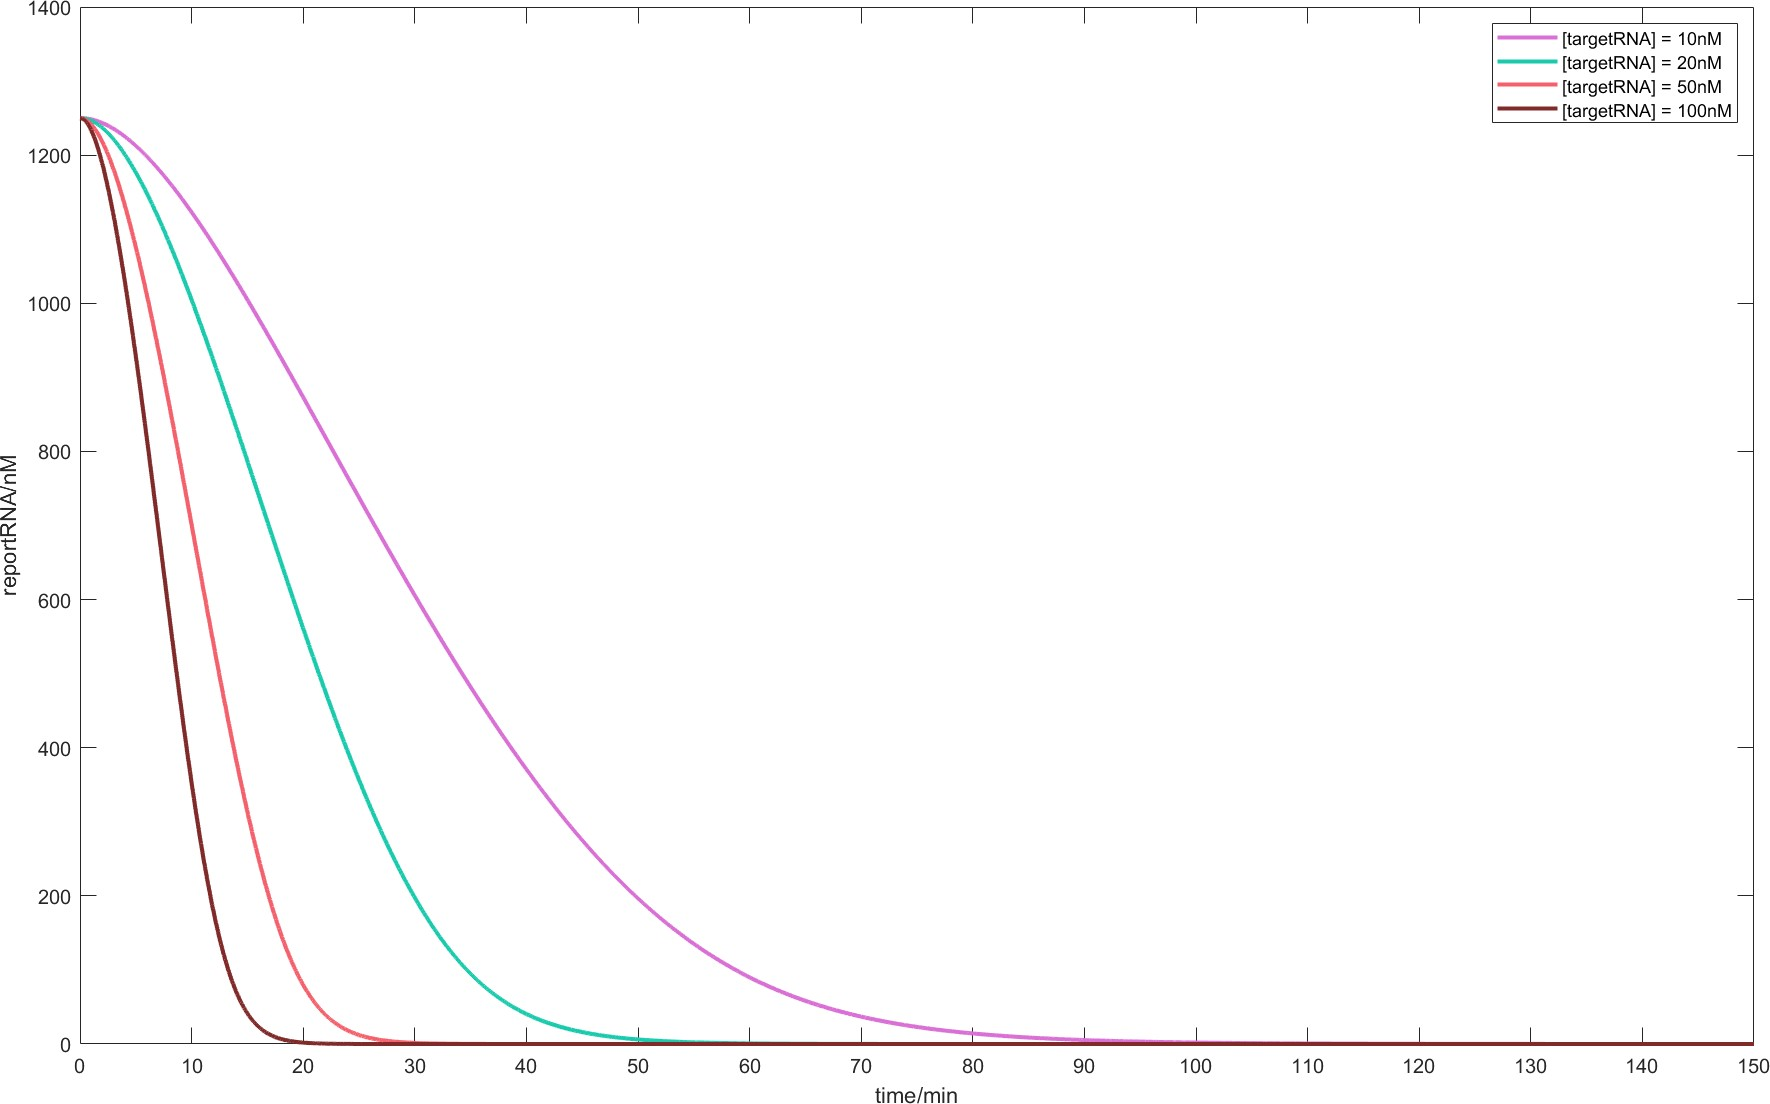
Fig.3.
When the parameters are kcr = 1/(min), kcombine = 0.001/(nM.min), kcat = 5/(min), KM = 500nM and
the initial conditions are [Cas13d] = 240nM, [crRNA] = 100nM, [reporterRNA] = 1250nM, the residual
levels of reporterRNA corresponding to different initial [targetRNA] change with time.
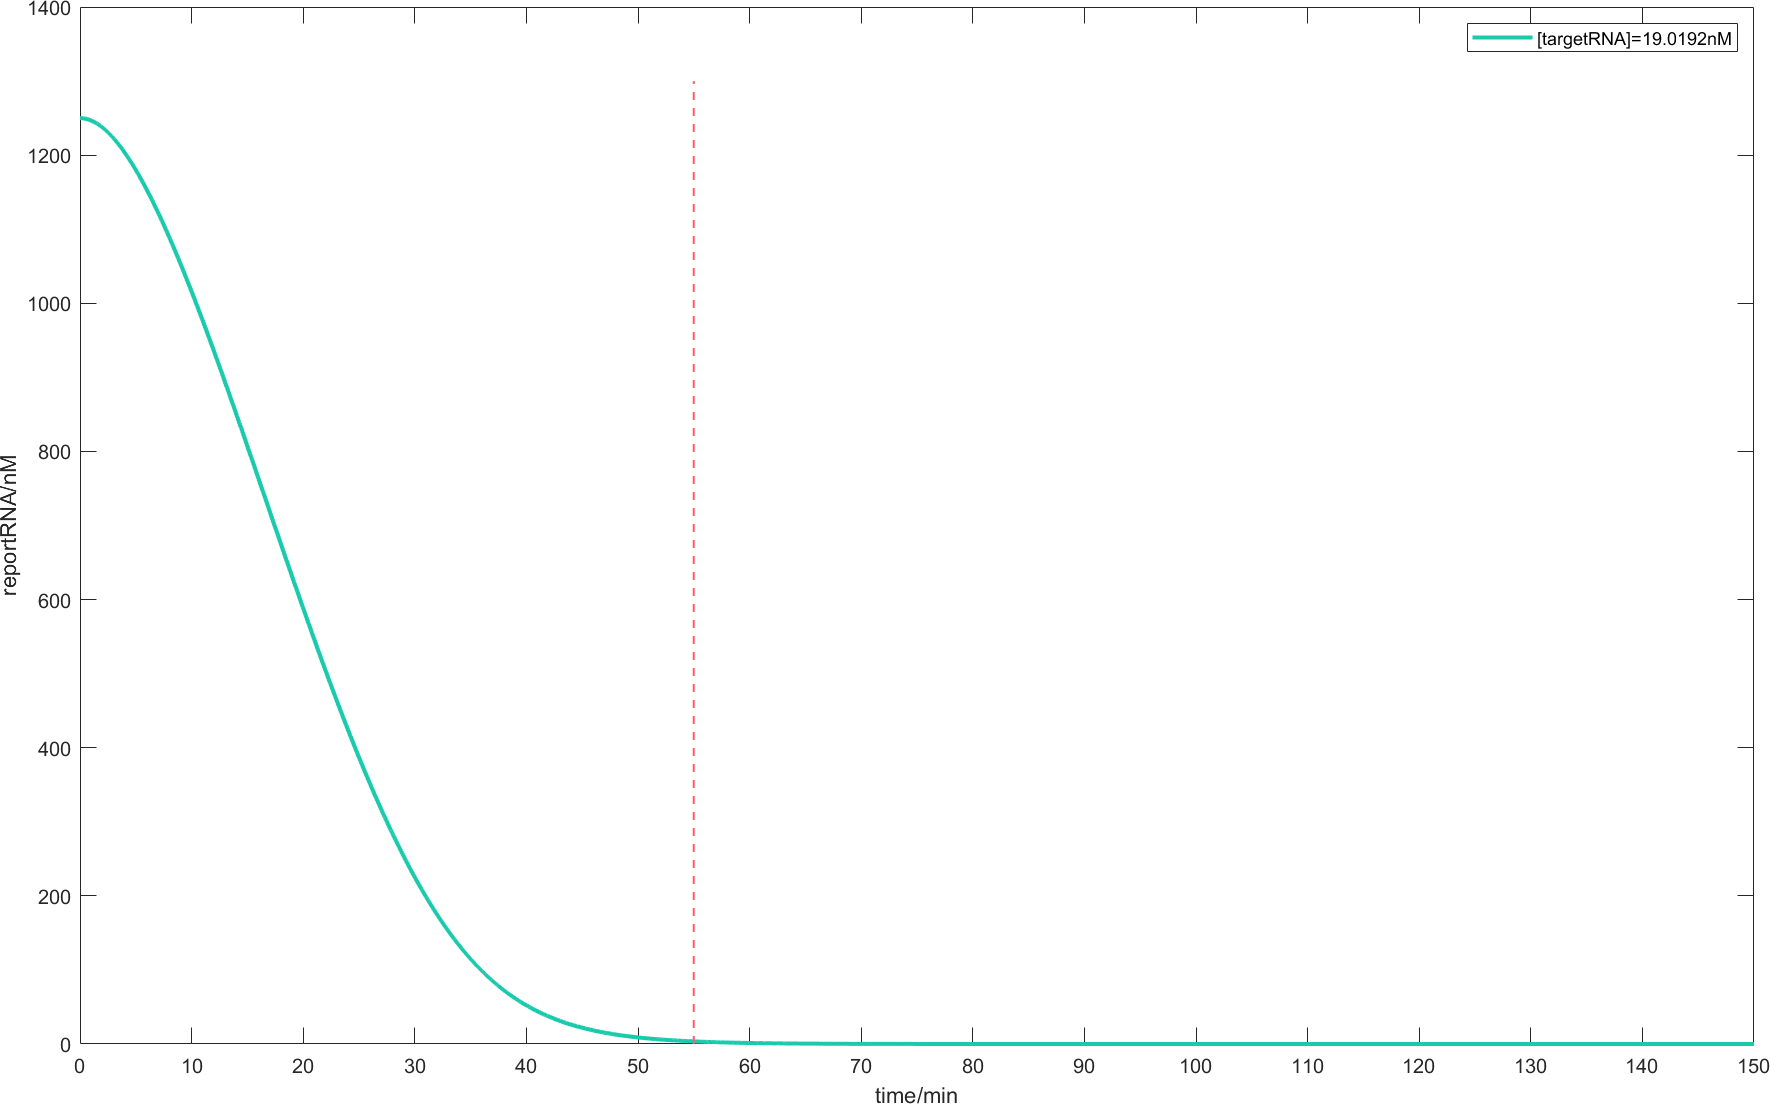
Fig.4.
When the parameters are kcr = 1/(min), kcombine = 0.001/(nM.min), kcat = 5/(min), KM = 500nM and
the initial conditions are [Cas13d] = 240nM, [crRNA] = 100nM, [targeMtRNA] = 19.0912nM,
[reporterRNA] = 1250nM, the remaining level of reporterRNA changes over time.
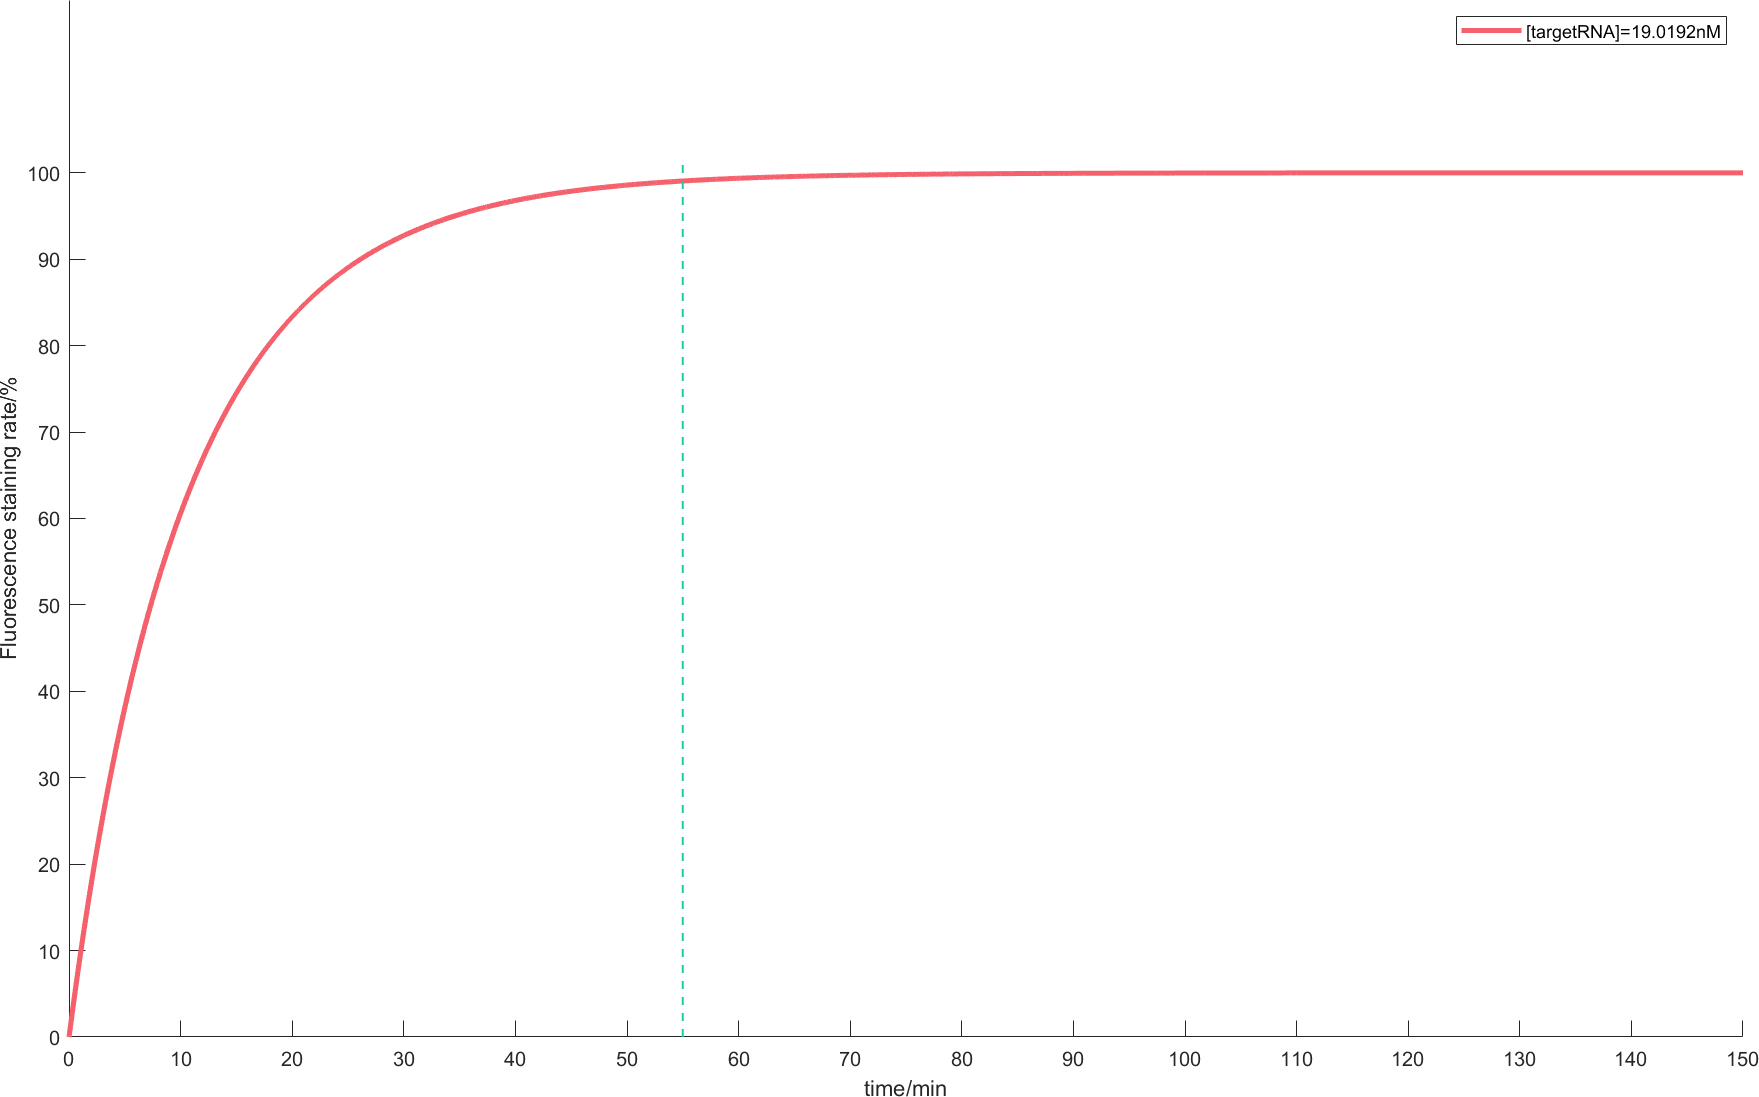
Fig.5.
When the parameters are kcr = 1/(min), kcombine = 0.001/(nM.min), kcat = 5/(min),
KM = 500nM and the initial conditions are [Cas13d] = 240nM, [crRNA] = 100nM, [targetRNA] = 19.0912nM,
[reporterRNA] = 1250nM, the change of fluorescence dyeing rate with time.
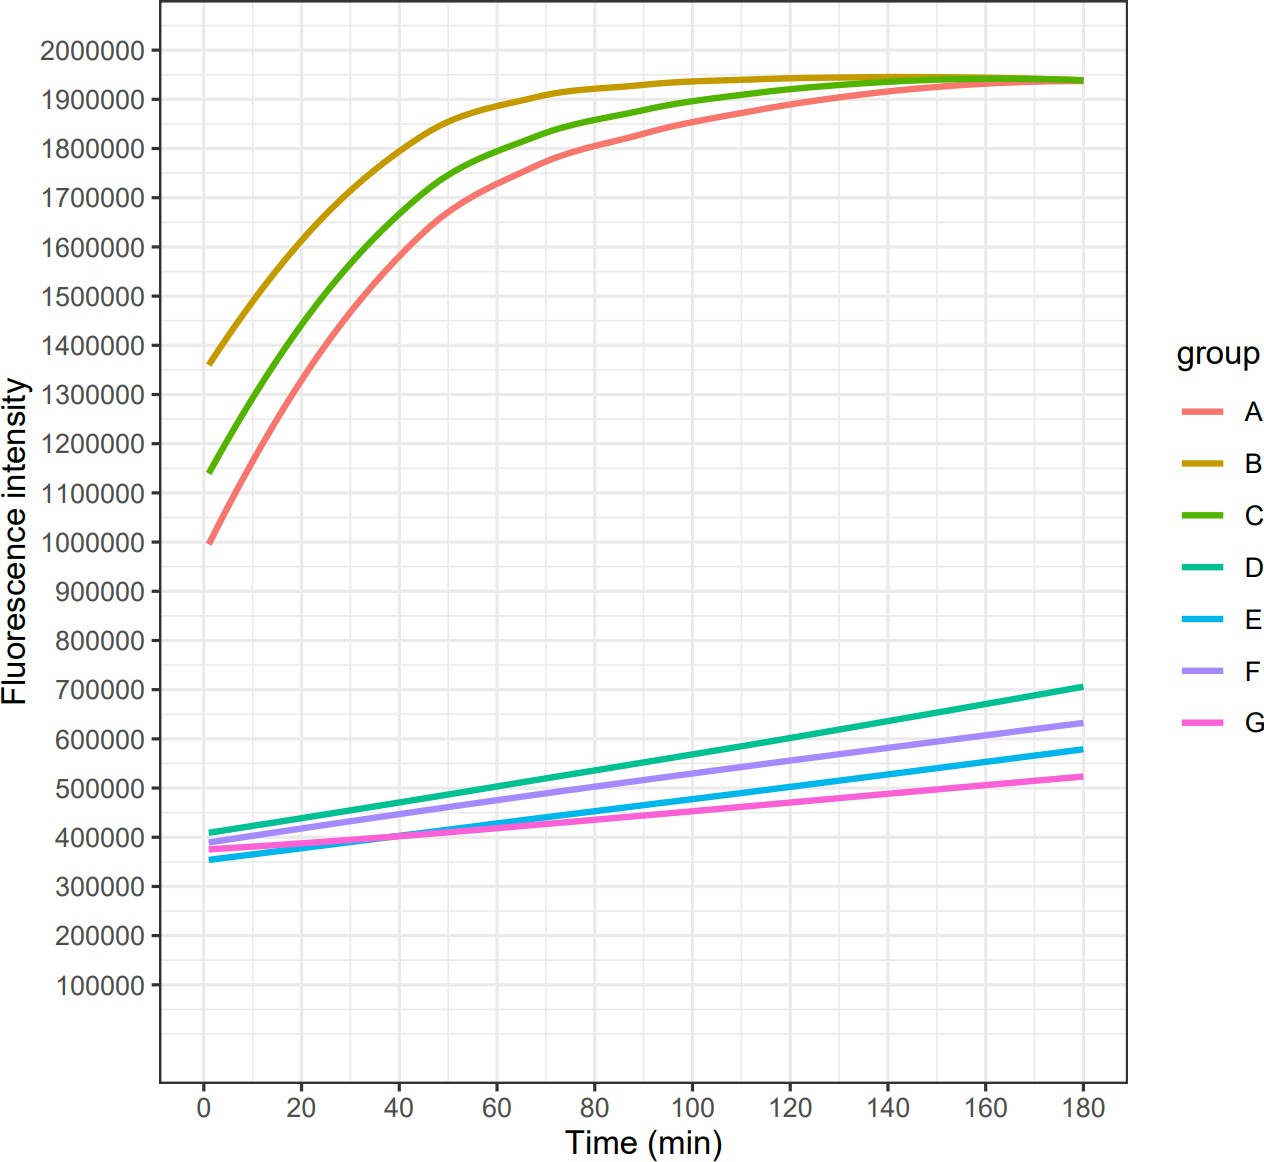
Fig.6.
In vitro verification of CRISPR / Cas13d on August 15. The initial conditions are : [Cas13d] = 240nM,
[crRNA] = 100nM, [targetRNA] = 19.0912nM, [reporterRNA] = 1250nM. Four experimental groups A, B, C, D and
four control groups E, F, G, H ( without target RNA ) were incubated in ABI Step one plus real-time PCR
at 37 °C for 3 hours, and fluorescence signals were detected every minute. In addition to D, the fluorescence
intensity of ABC was significantly higher than that of the control group, and the high-intensity fluorescence
signal corresponding to the specific trans-cleavage activity of Cas13d was detected.
II: Effect of knock-down of ACE2 level on virus diffusion
Studies[3] show that the severity of the novel coronavirus pneumonia in different altitudes may be related to the different expression levels of ACE2. In order to illustrate that knocking down the ACE2 level can become a possibility for the treatment of pneumonia, we established a prediction model by intervening ACE2 level parameters in the in vivo viral diffusion model with immune response participation. Furthermore, the influence of ACE2 knockdown on the patient’s condition was given by adjusting the value of this parameter. In order to better demonstrate the diffusion effect, we established the dimensionless partial differential equation model of virus diffusion based on type II functional response. Furthermore, we introduced the ACE2 level as a parameter into the above model by establishing the corresponding relationship between the cell surface ACE2 level and the growth rate of pathogens. Finally, based on the relationship between ACE2 levels and novel coronaviruses in the real world, we proposed the possibility of blocking virus infection.
Model assumptions
1.The level of ACE2 on cell surface affects the virus proliferation rate.
2.When pathogen density is particularly high, the replication rate of specific immune cells is higher than its attenuation rate.
3.In the immune response process of high-density pathogens, specific immunity was stronger than non-specific immunity.
4.Virus spread rate, immune cell spread rate and non-specific immune level are constant.
5.Pathogen predation by immune cells follows the second Holling function.
Modelling

This is a dimensionless system [4]. Homogeneous Neumann boundary condition was used to indicate that the amount of pathogens and specific immune cells did not change at the end of the blood vessel.
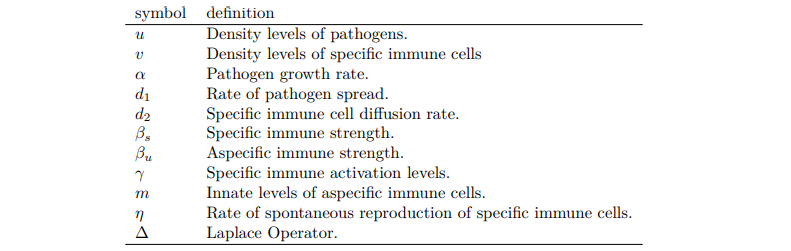
Symbol description
Discussion on parameter values
According to the article[4], we can first fix the following parameters: d1 = 0.1, d2 = 10, βs = 10^(-10), βu = 0.1, γ = 0.05, m = 1.5, η = 0.05, and α in [0, 2]. According to the hypothesis, we can associate the ACE2 level on the cell surface with the proliferation rate of the virus. The following will discuss the influence of the value of parameter α on the virus level.
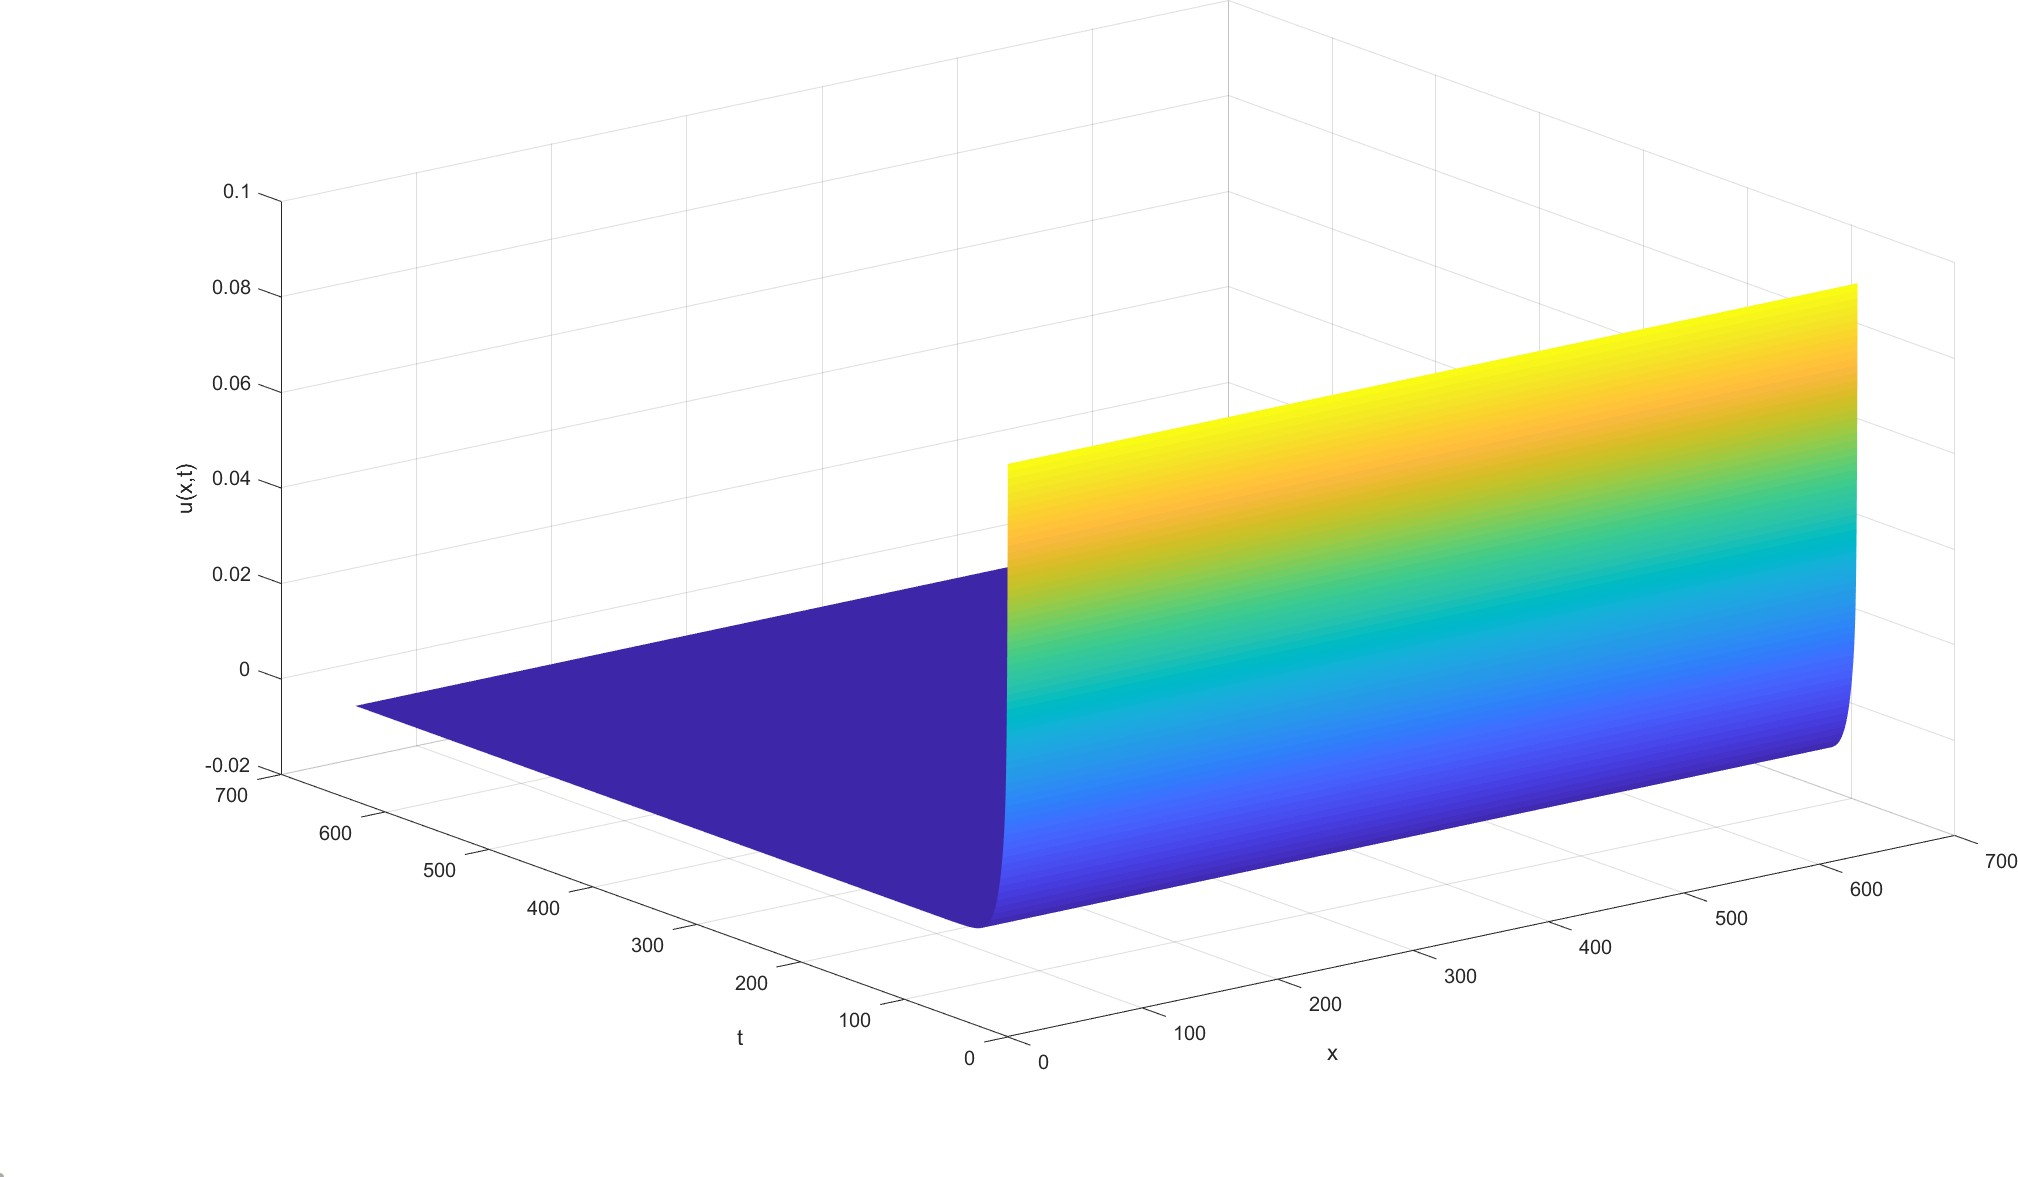
Fig.7. Let α = 1.4, under the conditions of parameter values : d1 = 0.1, d2 = 10, βs = 10^(-10), βu = 0.1, γ = 0.05, m = 1.5, η = 0.05 and initial function is u0 = 0.1, v0 = 1, the variation of virus level u(x, t) with time and space.
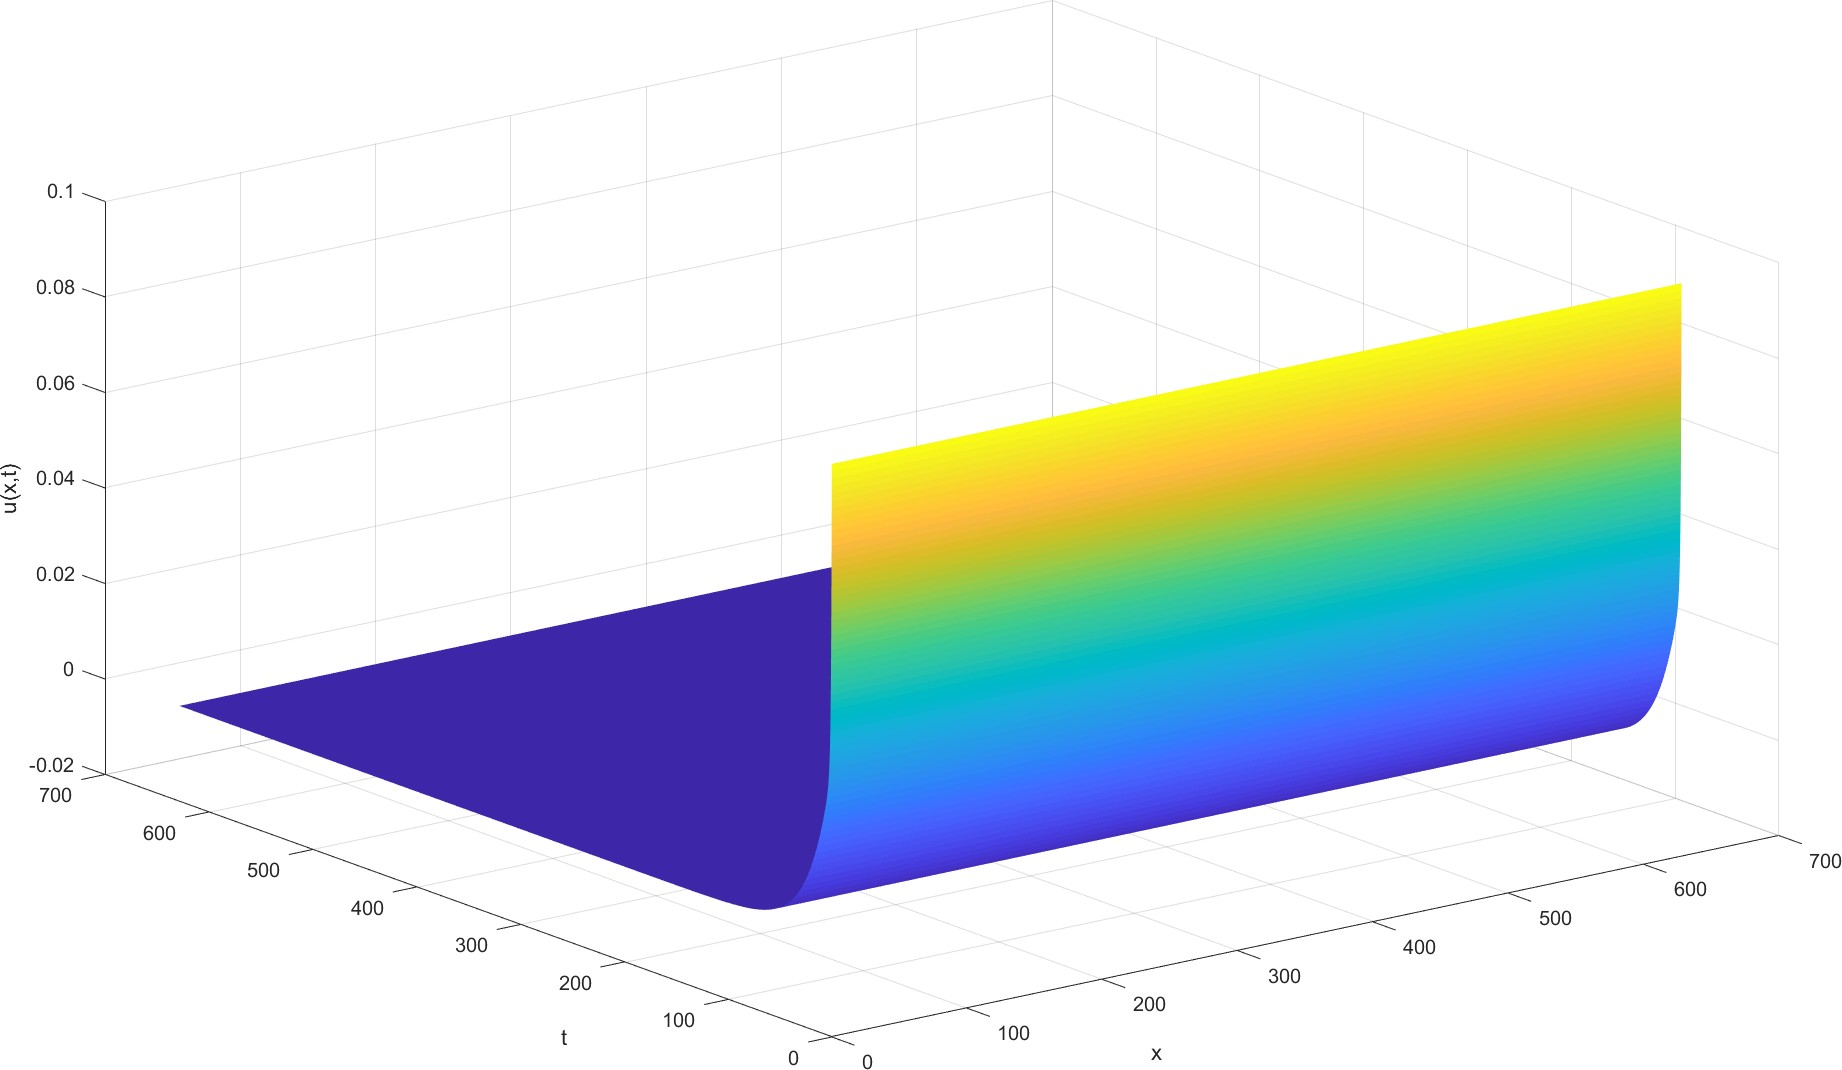
Fig.8. Let α = 1.5, when the parameters are d1 = 0.1, d2 = 10, βs = 10^(-10), βu = 0.1, γ = 0.05, m = 1.5, η = 0.05 and the initial function is u0 = 0.1, v0 = 1, the change of virus level u(x, t) with time and space is set.
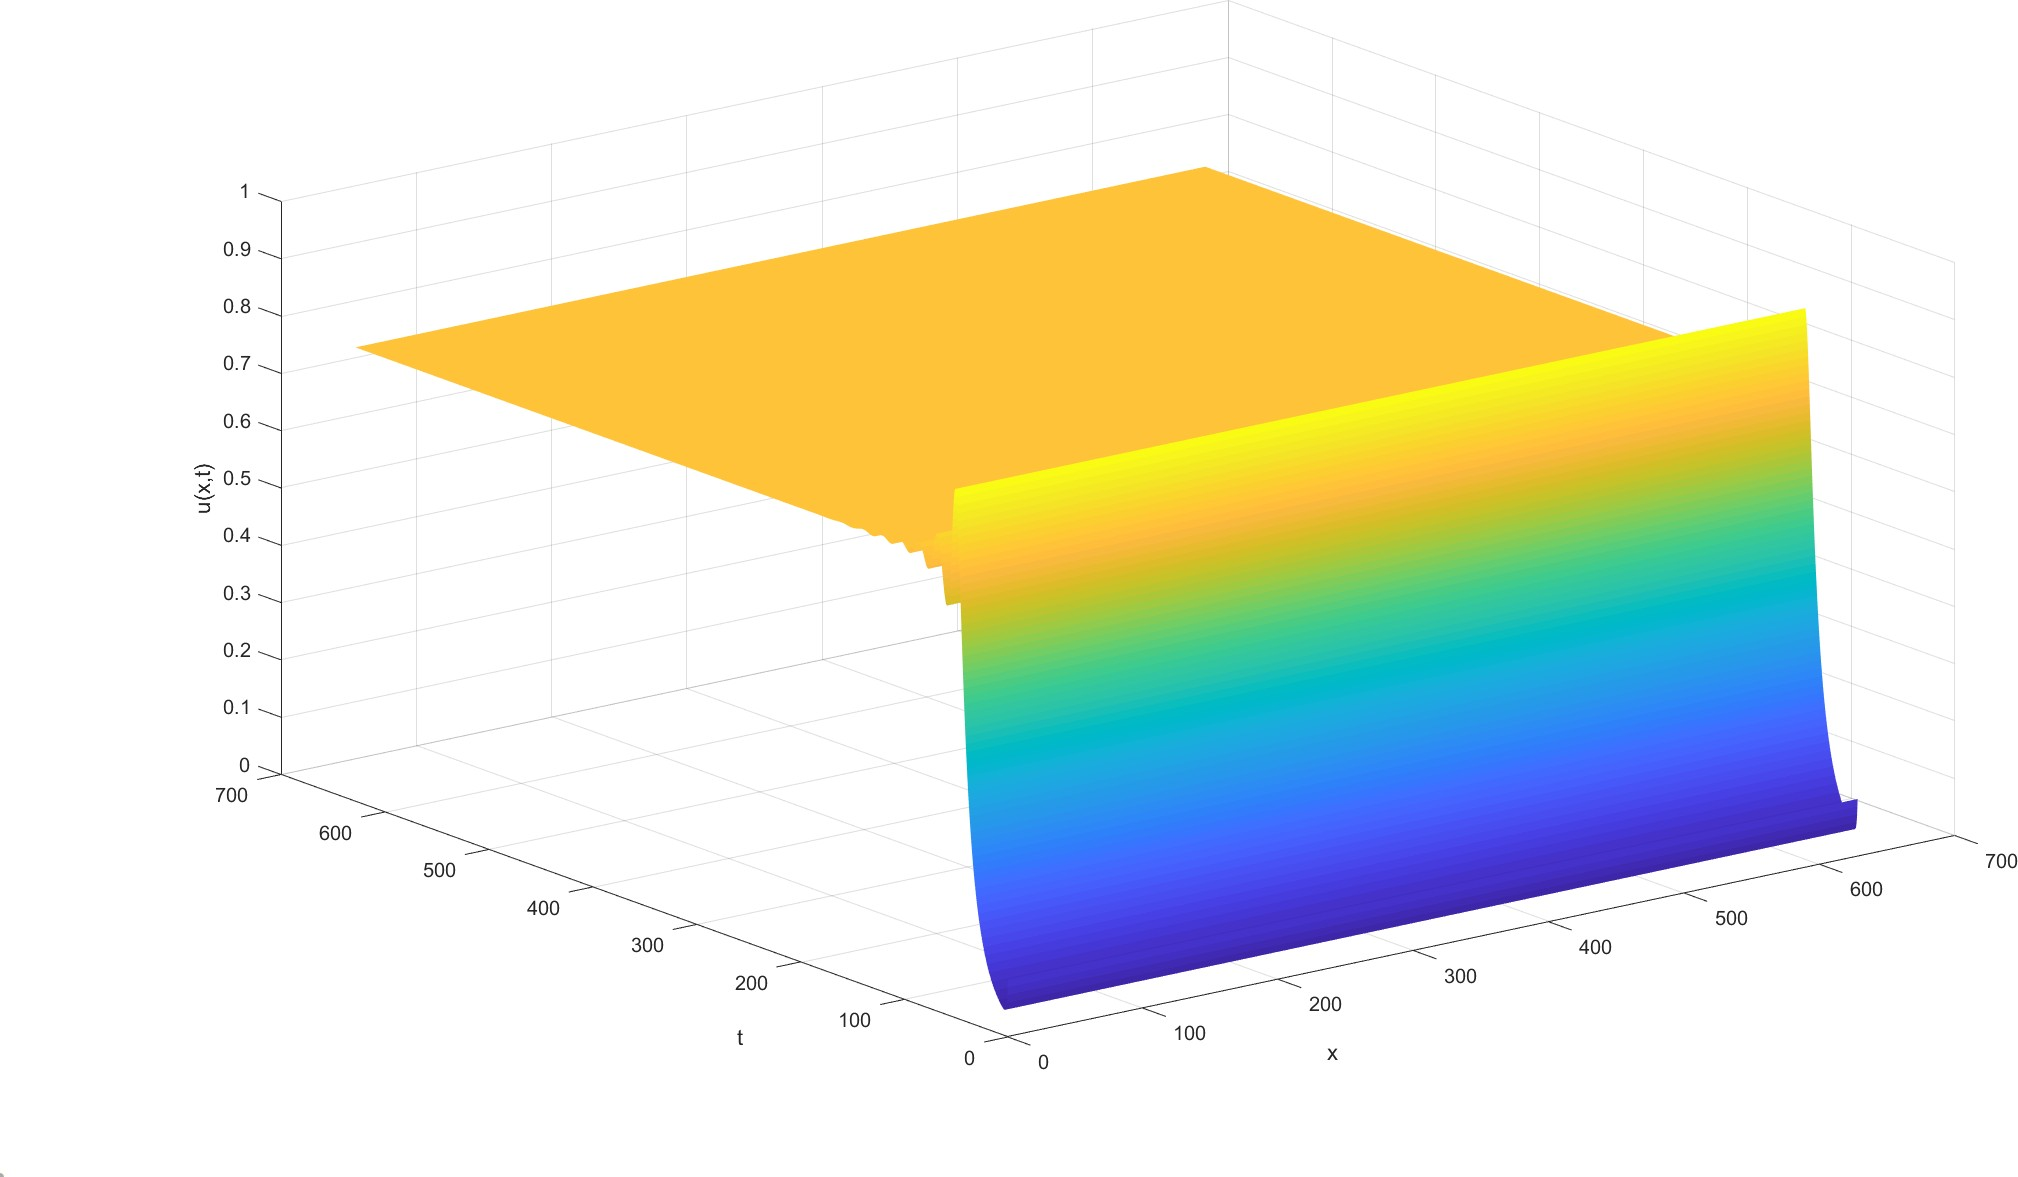
Fig.9. Let α = 1.6, under the conditions of parameter values : d1 = 0.1, d2 = 10, βs = 10^(-10), βu = 0.1, γ = 0.05, m = 1.5, η = 0.05 and initial function is u0 = 0.1, v0 = 1, the variation of virus level u(x, t) with time and space.
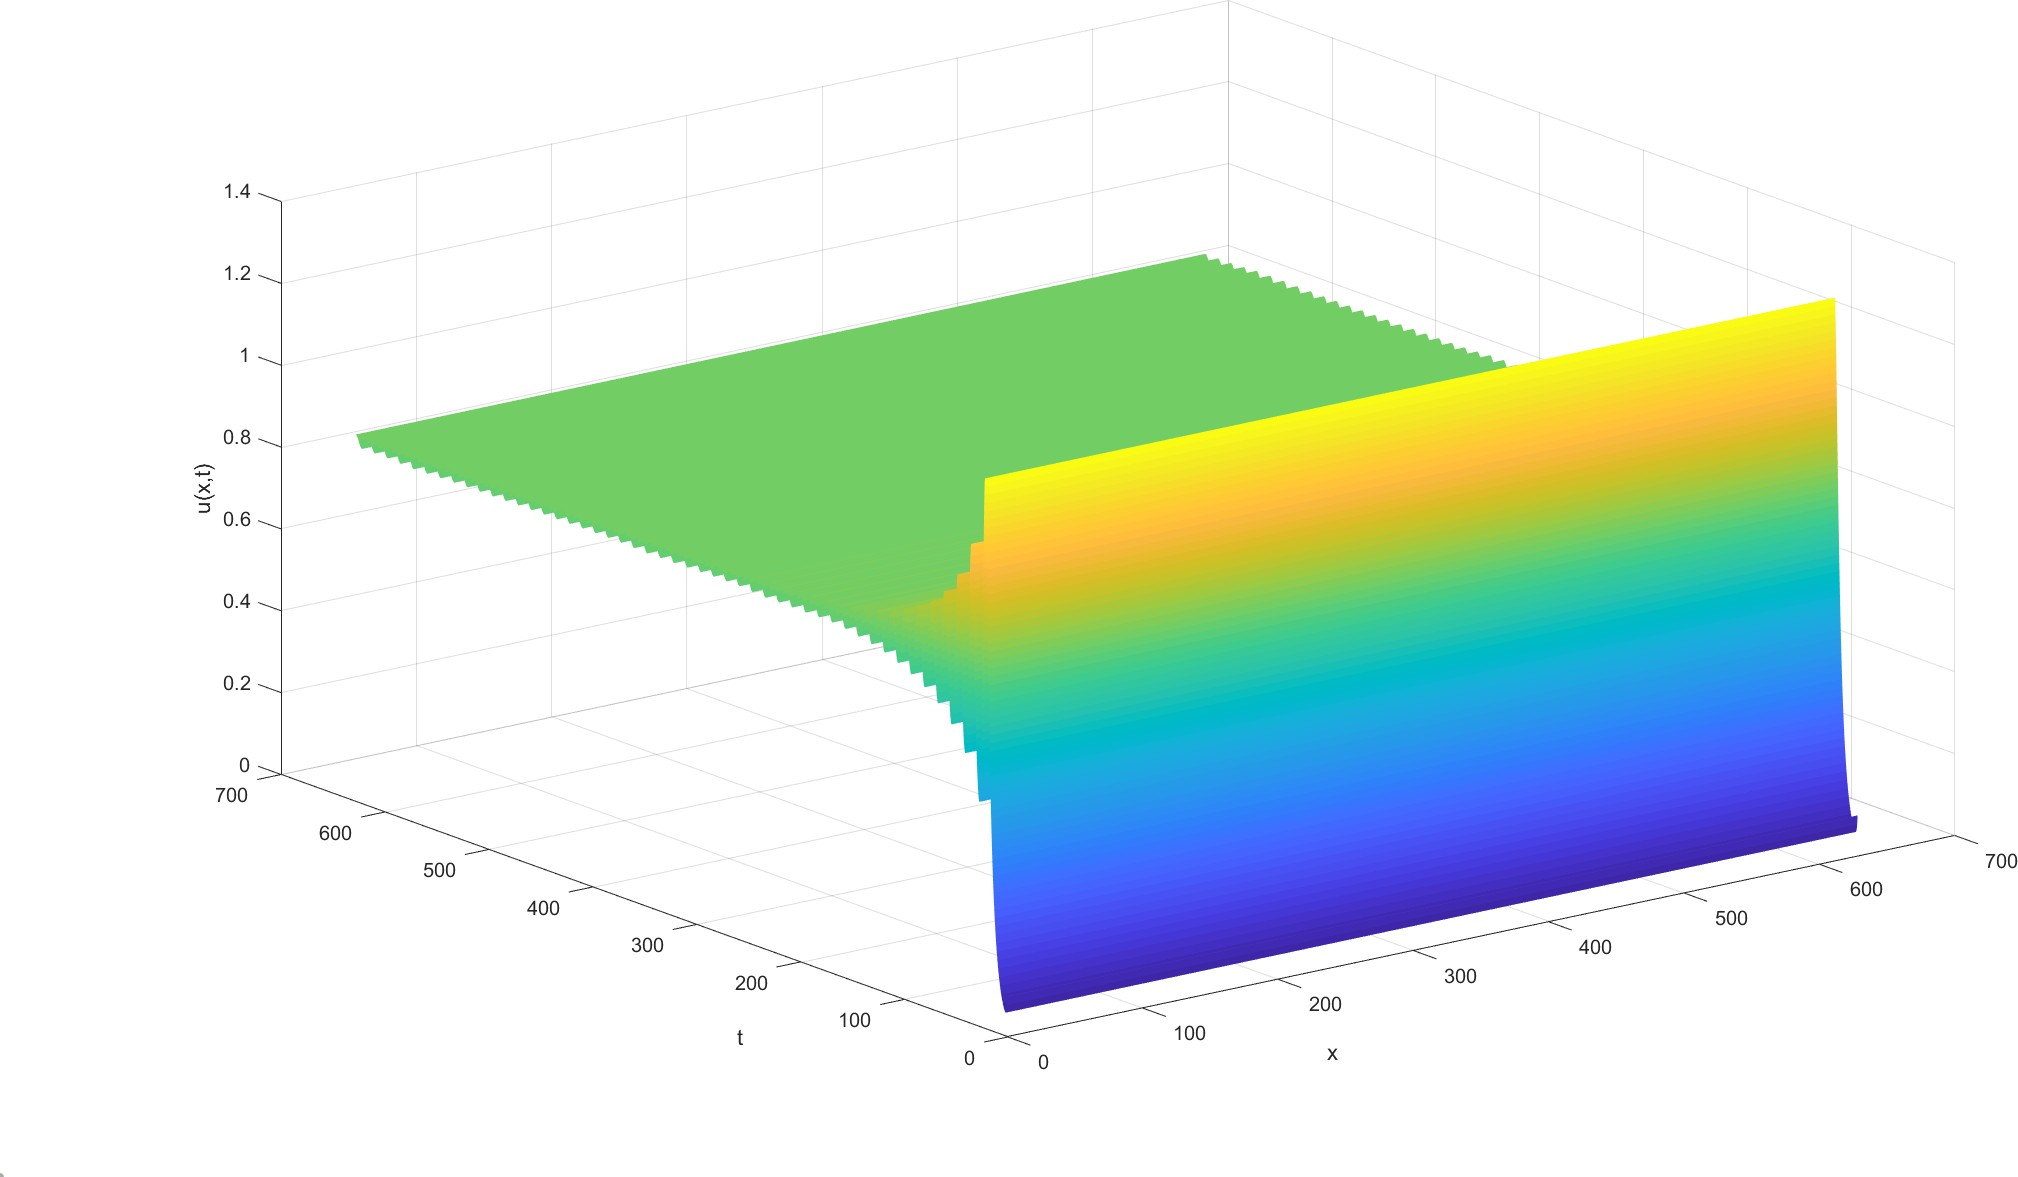
Fig.10. Let α = 1.7, under the conditions of parameter values : d1 = 0.1, d2 = 10, βs = 10^(-10), βu = 0.1, γ = 0.05, m = 1.5, η = 0.05 and initial function is u0 = 0.1, v0 = 1, the variation of virus level u(x, t) with time and space.
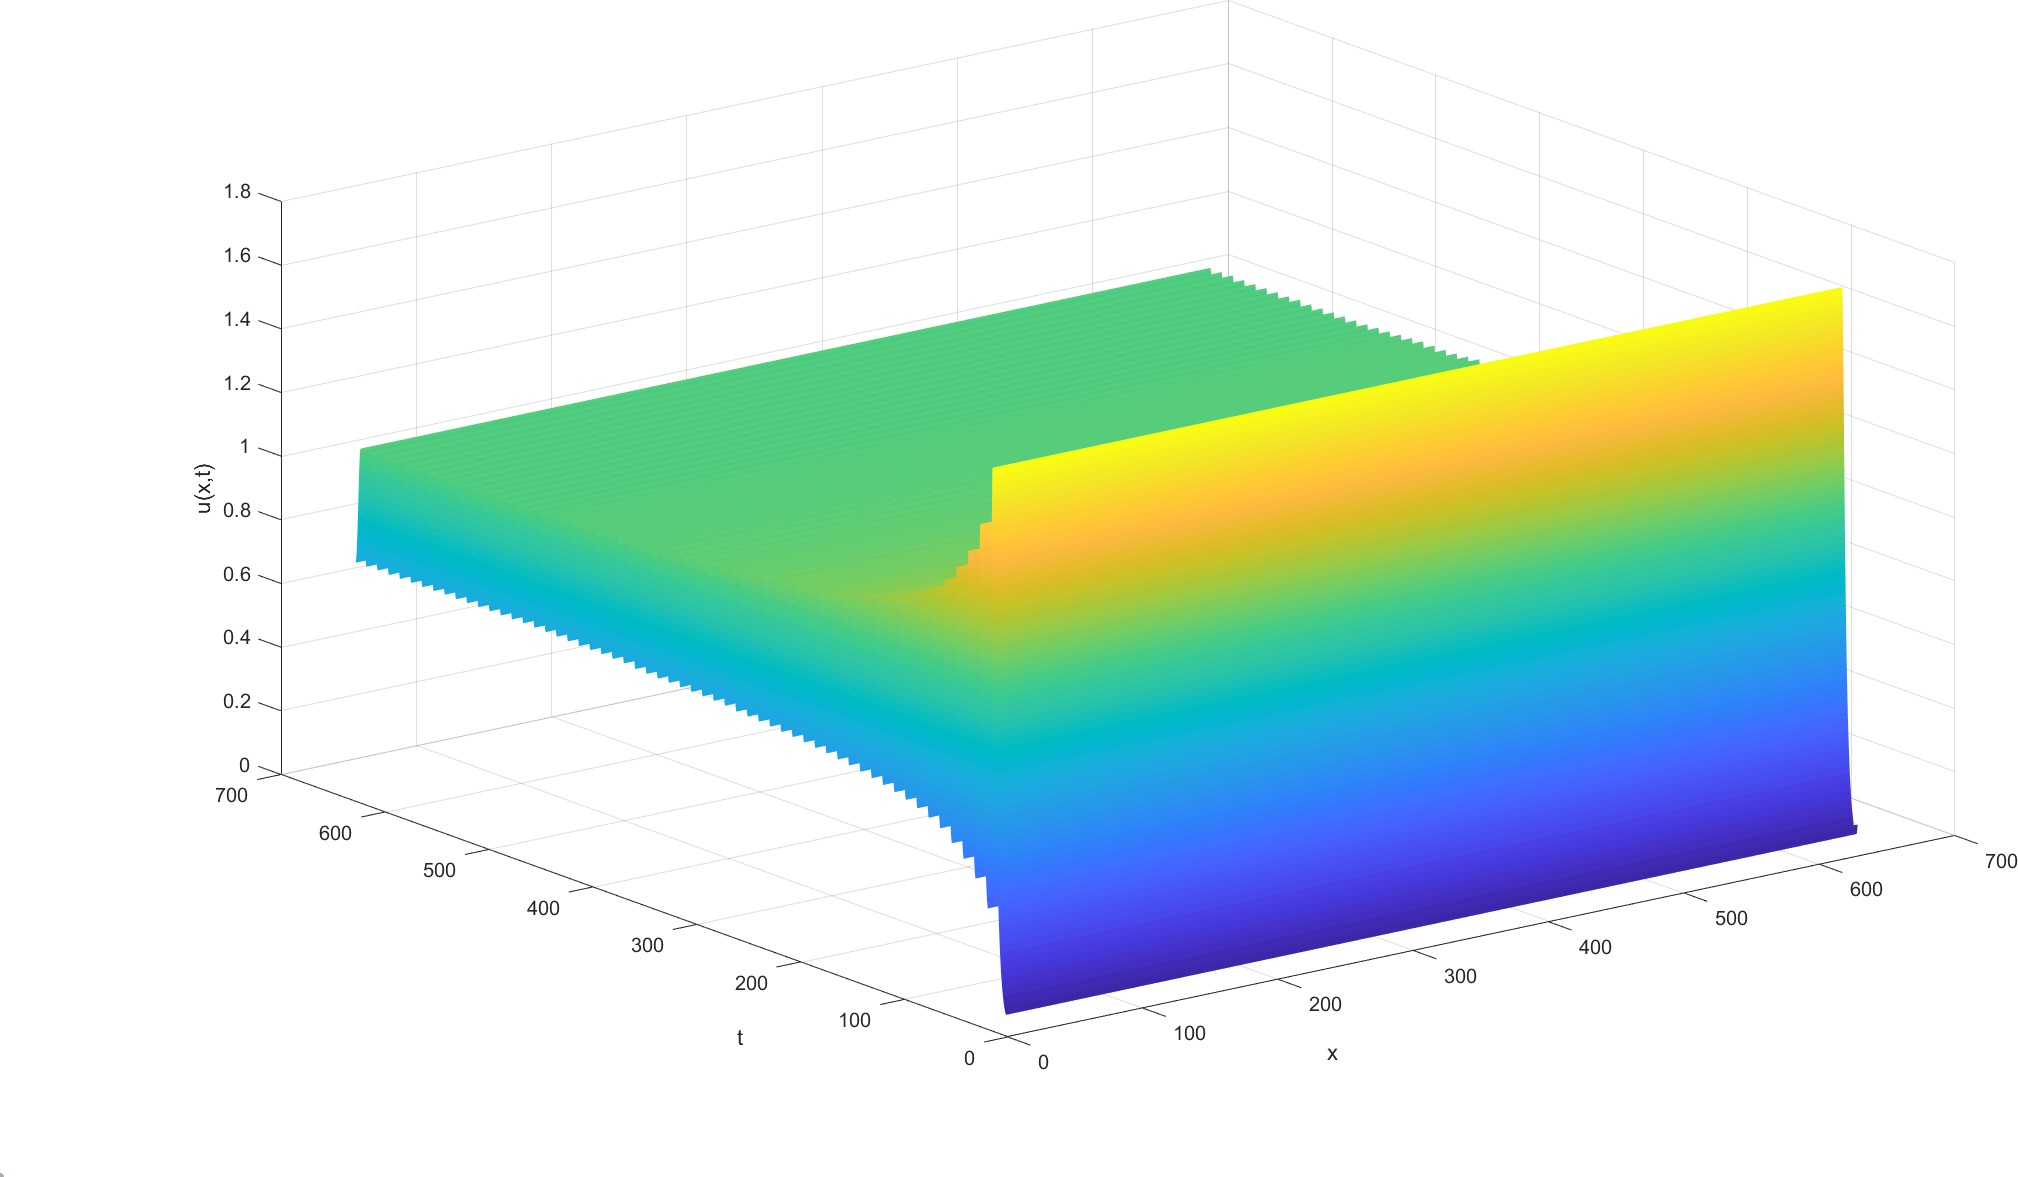
Fig.11. Let α = 1.8, under the conditions of parameter values : d1 = 0.1, d2 = 10, βs = 10^(-10), βu = 0.1, γ = 0.05, m = 1.5, η = 0.05 and initial function is u0 = 0.1, v0 = 1, the variation of virus level u(x, t) with time and space.
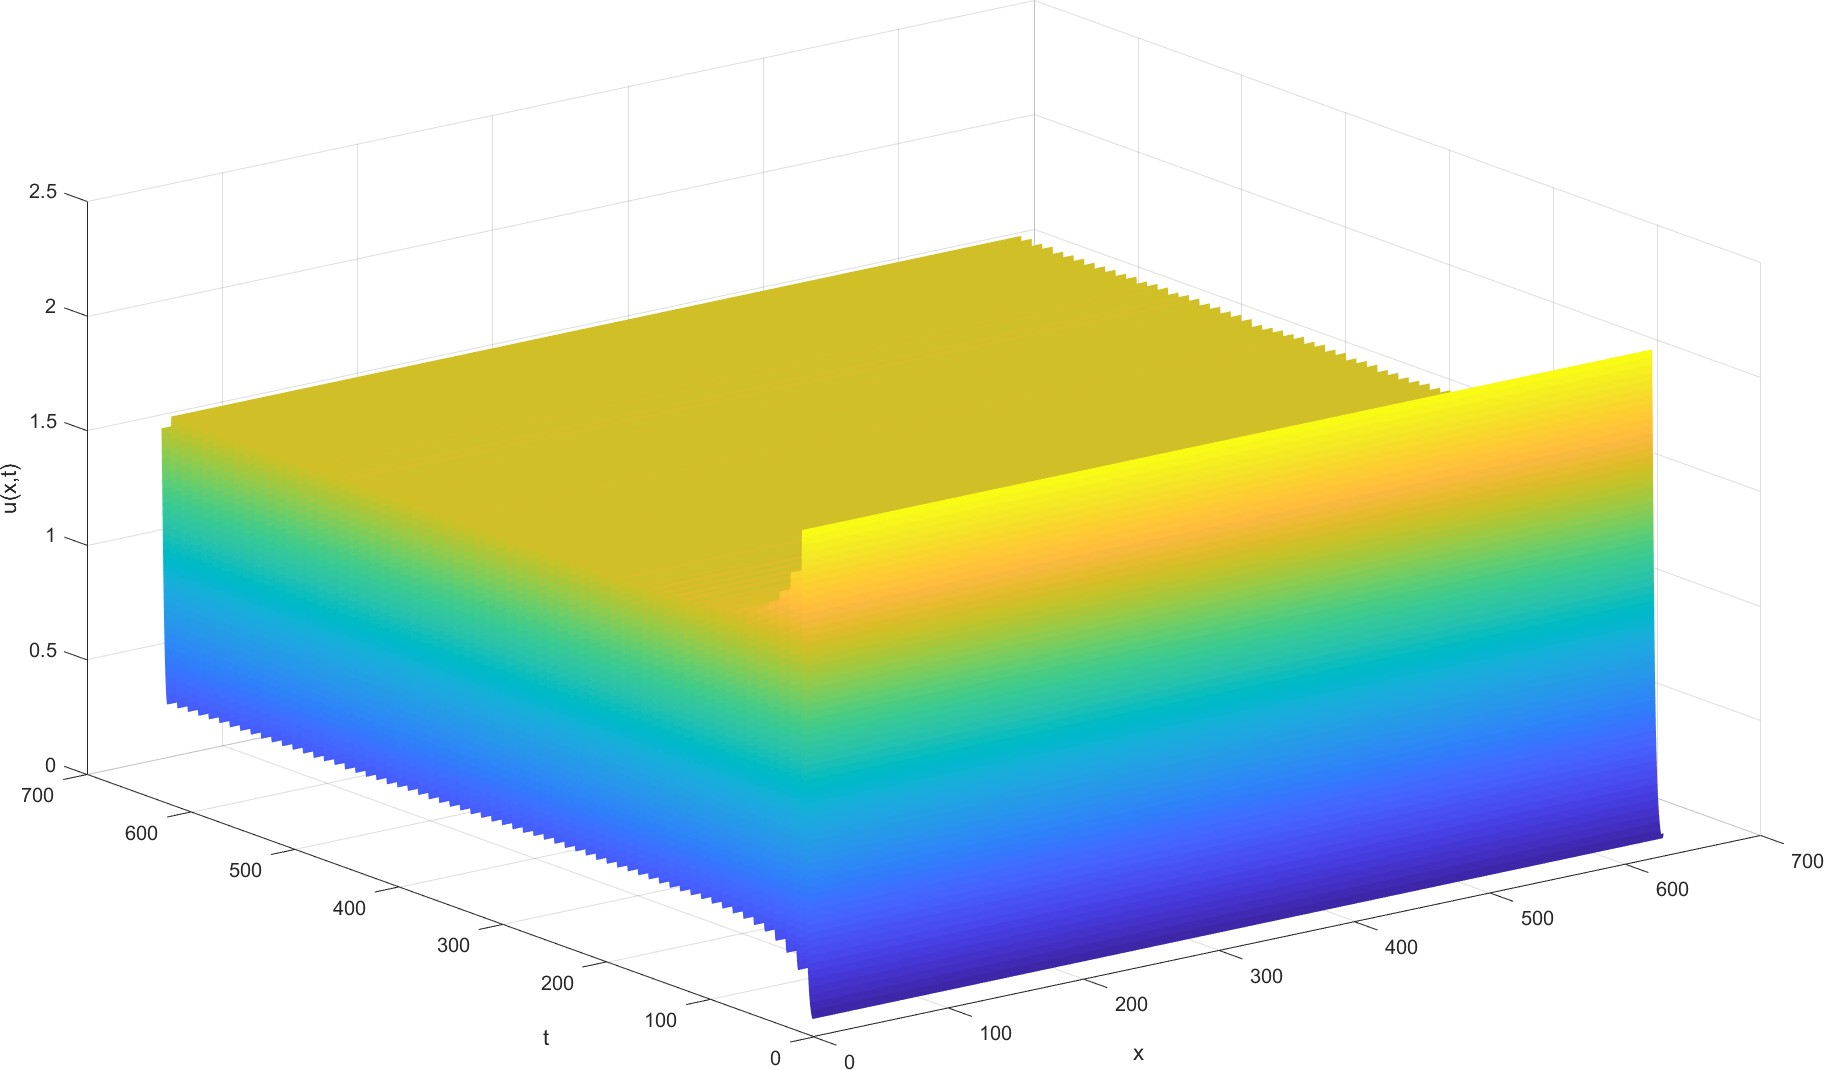
Fig.12. Let
α = 1.9, under the conditions of parameter values : d1 = 0.1, d2 = 10, βs = 10^(-10), βu = 0.1,
γ = 0.05, m = 1.5, η = 0.05 and initial function is u0 = 0.1, v0 = 1, the variation of virus level u(x, t) with time and space.
It can be seen that when the virus diffusion rate is relatively large, the immune function of the body cannot remove the residual virus, and its content will also fluctuate with time. When the virus diffusion rate is slowed to a certain extent, it can be cured only by the immune function of the body.
Model prediction
Related research[3] pointed out that the ACE2 level in high-altitude areas was low, and according to the statistical results[5], under the same intensity of social activities (population flow, total population, traffic convenience, medical and health level, etc.), the mortality rate of novel coronavirus pneumonia also decreased with the increase of altitude. Therefore, we used the ratio of the mortality rate of pneumonia in high-altitude areas to that in low-altitude areas in the real world to simulate the ratio of the virus diffusion rate in high-altitude areas to that in low-altitude areas.
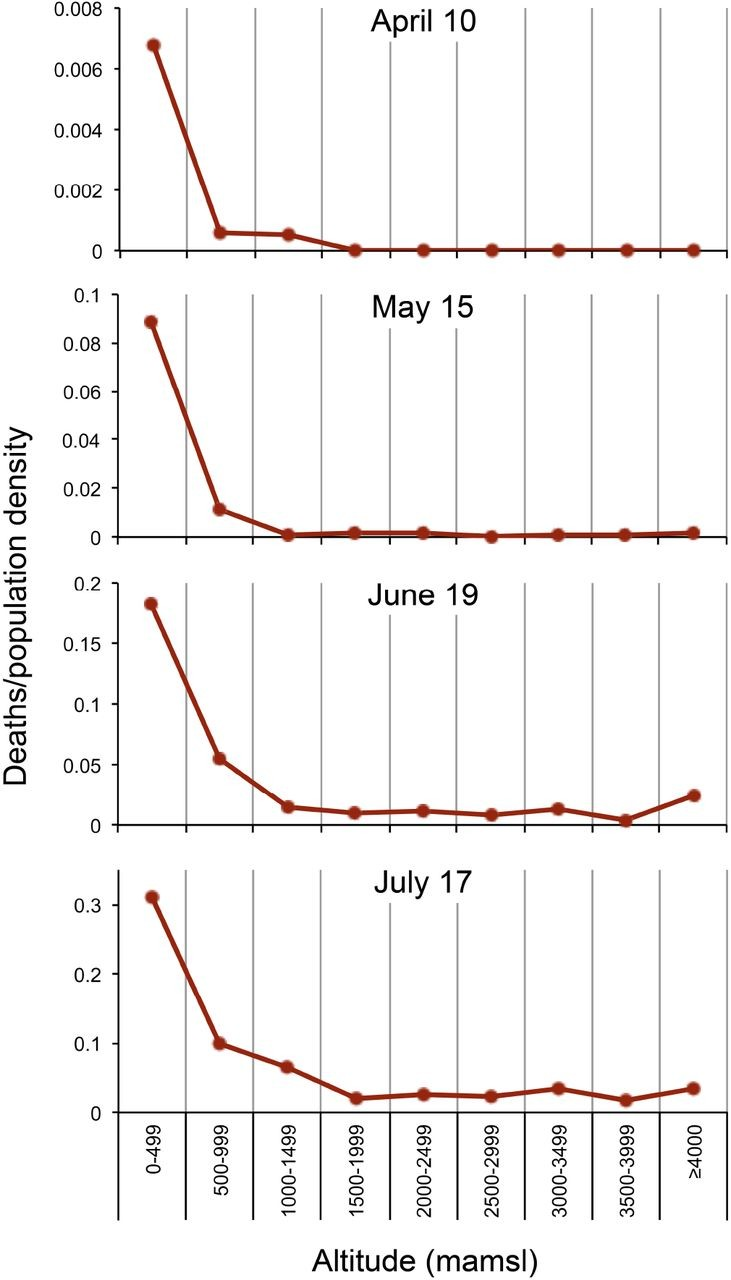
Fig.13. The survey results in Peru plateau showed that the mortality rate of COVID-19 decreased with the increase of altitude.
According to the above figure, we can obtain that the ratio of pneumonia pandemic mortality in high altitude area and low altitude area is strictly less than 0.9, so we can roughly estimate that the ratio of virus diffusion rate in high altitude area and low altitude area is less than 0.9. Therefore, we can assume that reducing the expression level of ACE2 on the cell surface can reduce the initial diffusion rate of the virus to the original 90%, which can play a therapeutic effect. When the diffusion level is only 88% of the original, we can get the following results.
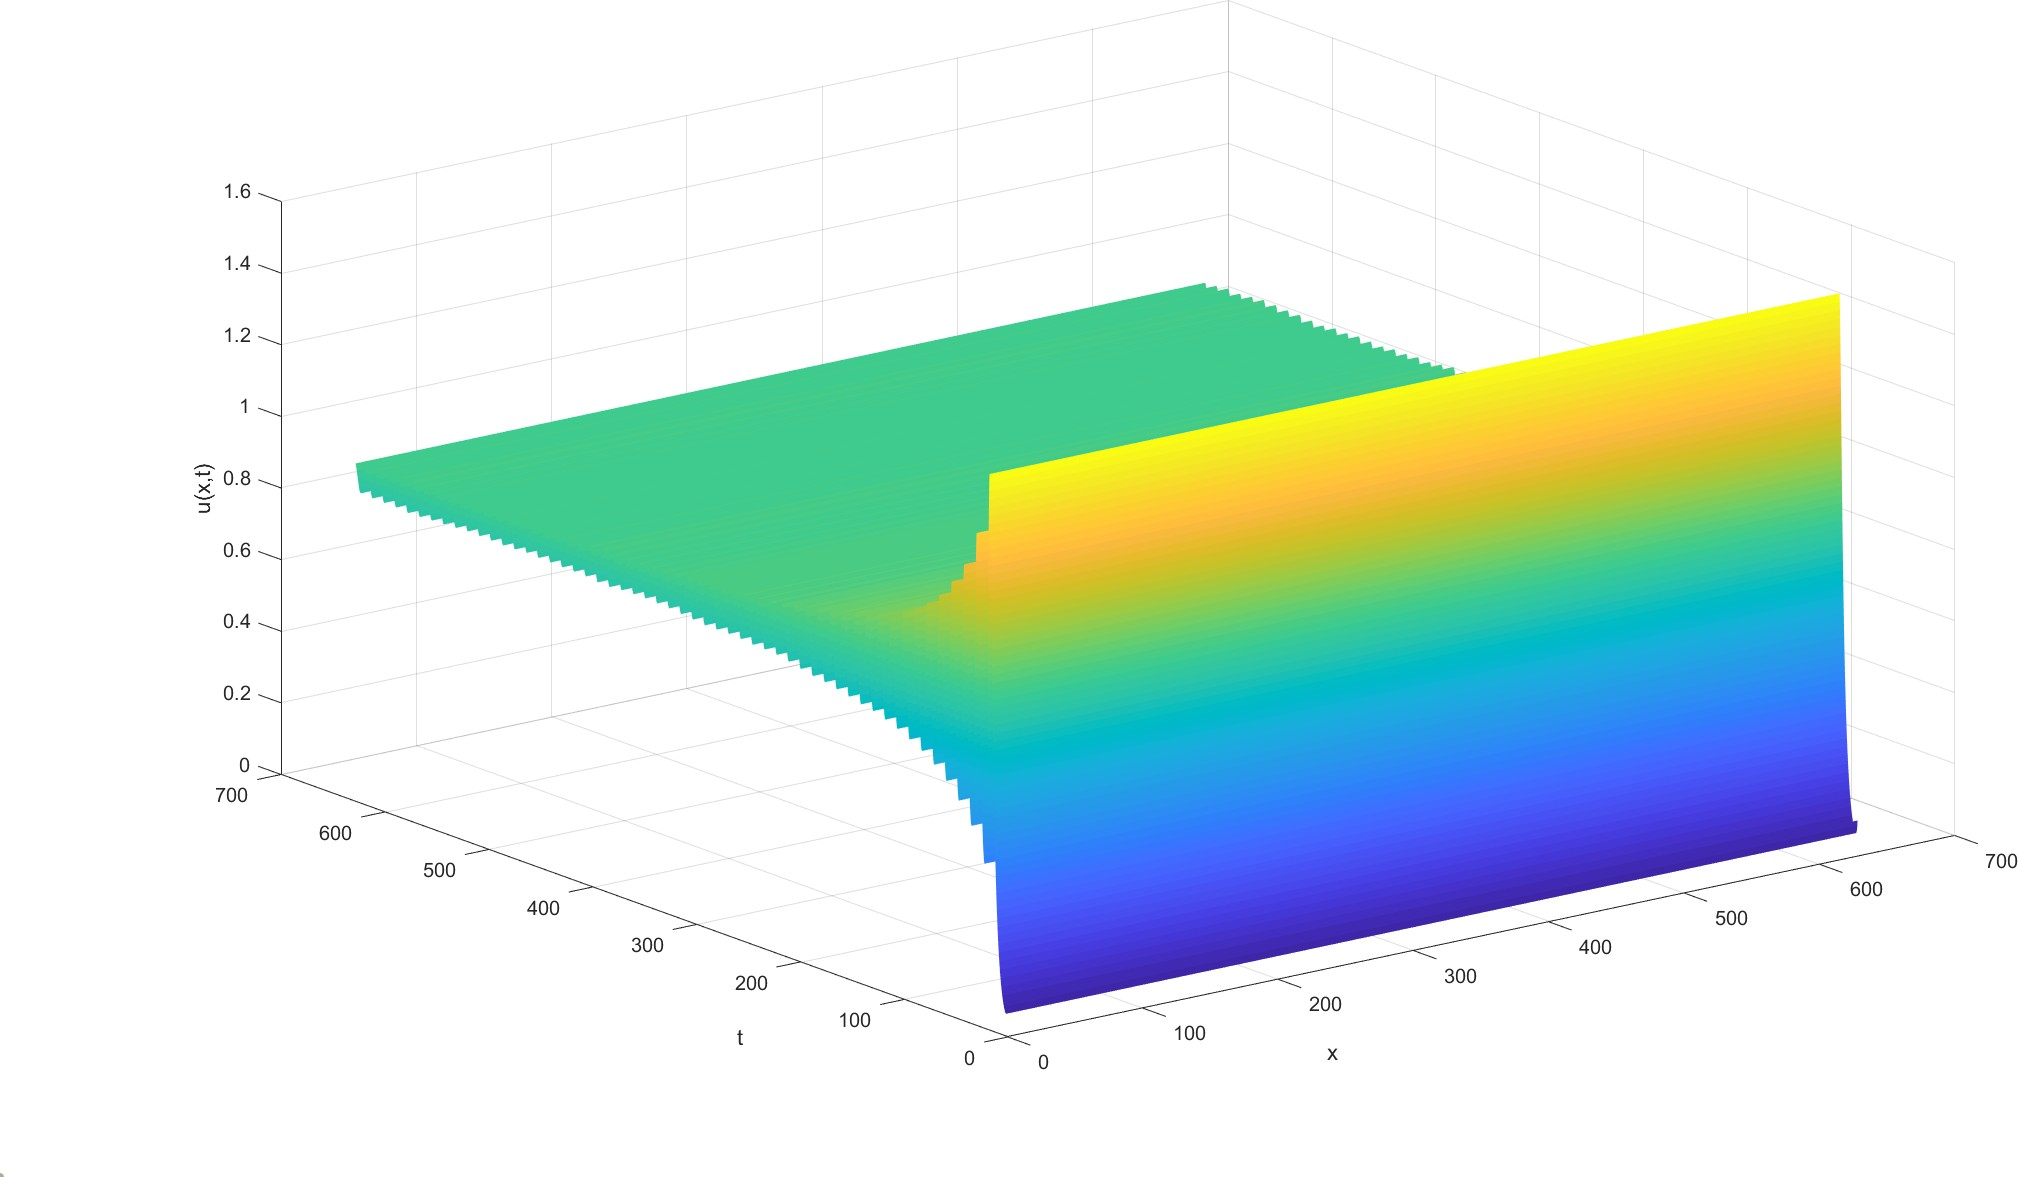
Fig.14. Let α = 1.75, under the conditions of parameter values : d1 = 0.1, d2 = 10, βs = 10^(-10), βu = 0.1, γ = 0.05, m = 1.5, η = 0.05 and initial function is u0 = 0.1, v0 = 1, the variation of virus level u(x, t) with time and space.
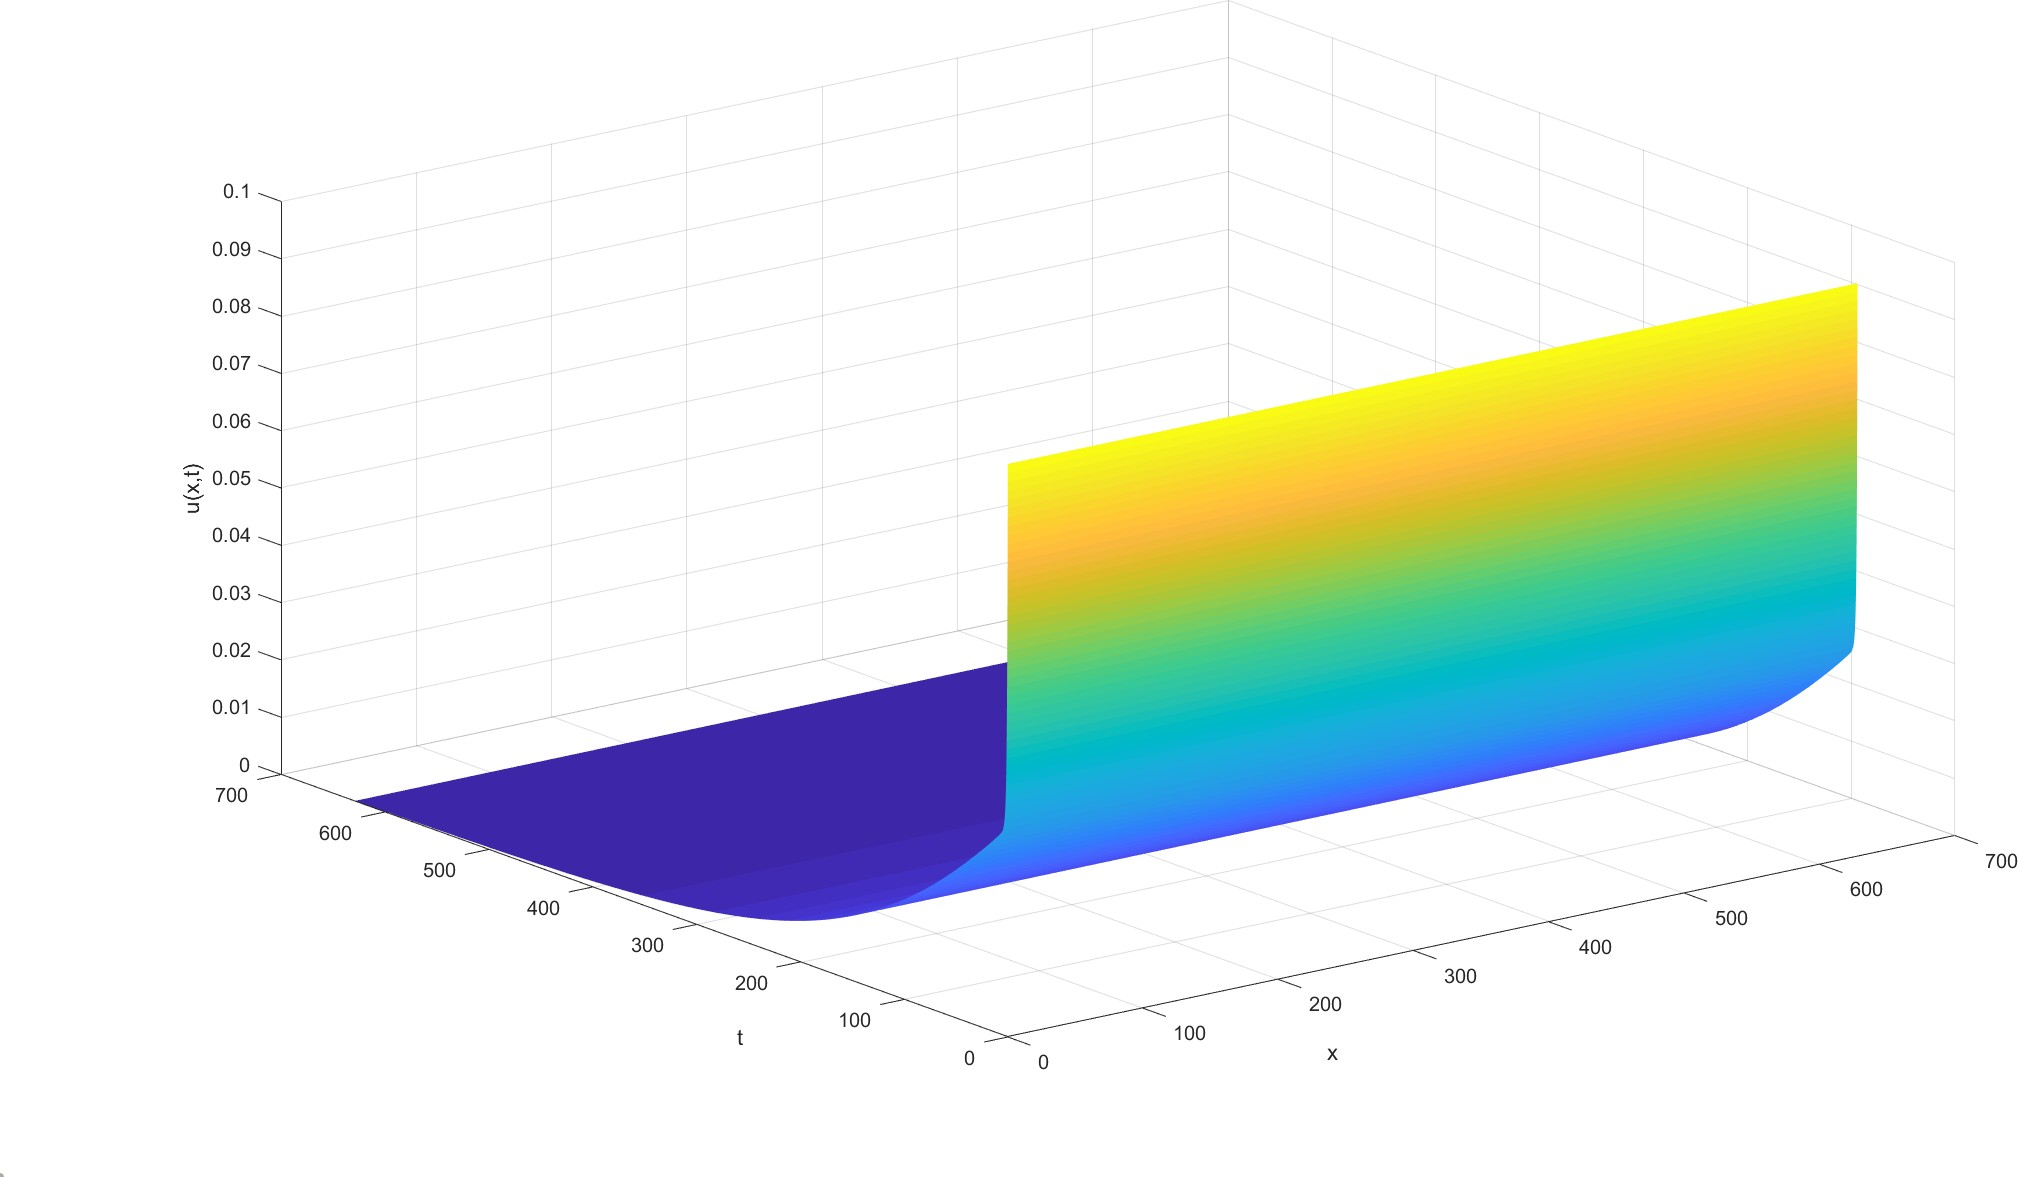
Fig.15. Let α = 1.54, under the conditions of parameter values : d1 = 0.1, d2 = 10, βs = 10^(-10), βu = 0.1, γ = 0.05, m = 1.5, η = 0.05 and initial function is u0 = 0.1, v0 = 1, the variation of virus level u(x, t) with time and space.
This means that there is no need to reduce ACE2 levels on the cell surface to achieve the treatment of novel coronavirus pneumonia, which is indeed a way to block the virus infection.
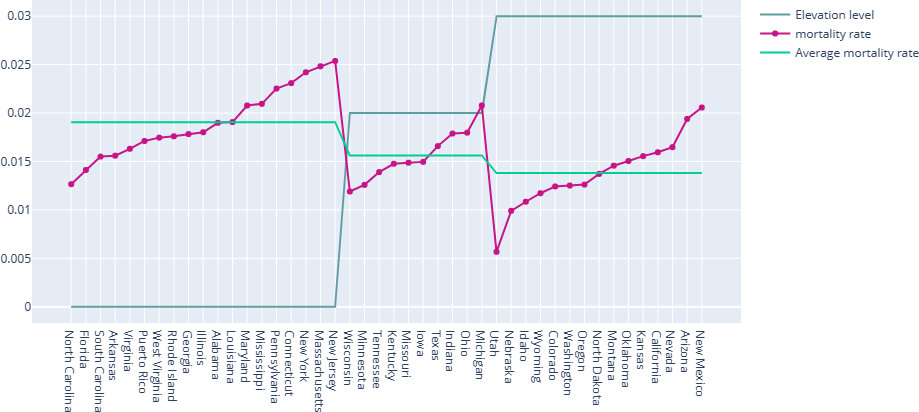
Fig.16. As of August 31, 2021, the relationship between mortality and altitude of the novel coronavirus pneumonia pandemic in some states of the United States. The image shows that the average mortality of most low-altitude (0~300m) cities is about 1.9%, while the average mortality of middle-altitude (300~1000m) areas is about 1.56 %, and the average mortality of high-altitude (≥1000m) areas is about 1.38%, which means that it is easy to reduce the mortality of low-altitude areas to 88 % of the current level.
References
[1]Vladimir, M. and Leonid, M. and Ekaterina, S. and Konstantin, K. and Konstantin, S. Nucleic Acids Research. 2016.
[2]Weitz, M. and Kim, J. and Kapsner, K. and Winfree, E. and Franco, E. and Simmel, F. C. Diversity in the dynamical behaviour of a compartmentalized programmable biochemical oscillator. Nature Chemistry. 2014.
[3]Meng, Z. Role of HIF-1alpha in the regulation ACE and ACE2 expression in hypoxic human pulmonary artery smooth muscle cells. American Journal of Physiology Lung Cellular & Molecular Physiology. 2009.
[4]Pugliese, A. and Gandolfi, A. A simple model of pathogen–immune dynamics including specific and non-specific immunity. Mathematical Biosciences. 2008.
[5]Thomson, T. M. and Casas, F. and Guerrero, H. A. and Figueroa-Mujica, R. and Villafuerte, F. C. and Machicado, C. Altitude as a Protective Factor from COVID-19. Kinetics of the CRISPR-Cas9 effector complex assembly and the role of 3 -terminal segment of guide RNA. Social Science Electronic Publishing. 2020.
 addgene
Contact Us
E-mail: 1981846330@qq.com
Address: No. 222, Tianshui South Road, chengguan district, Lanzhou City, Gansu Province,730000, P. R. China.
Copyright ©2021 iGEM LZU-CHINA Team All rights reserved.