Team:City of London UK/Model
Modelling
The home of real integration
MASS ACTION KINETICS MODEL
With the help of Imperial College’s 2020 Math Modelling paper [1], we created a mass action kinetics model, which models the concentration of our final miRNA-antimiRNA complex relative to time and initial miRNA concentration.
Initially: to form an miRNA-antimiRNA AND gate complex, we need both the 210-3p and 517-5p miRNAs. Whichever miRNA has the lowest concentration will be the limiting factor, and hence the concentration of the lesser miRNA is considered as the concentration of the binding molecule.
Assumptions
- The binding rates of the two miRNAs are equal
- Two similar miRNAs, will have minimal variance in bond formation and interactions with targets
- The concentration of miRNA = the concentration of the limiting miRNA
- The lesser miRNA is the limiting factor, and hence the excess of the greater miRNA does not have to be considered
- The hill coefficient of the miRNAs binding to the antimiRNA = number of binding sites = 2
- In an ideal situation, the coefficient of the ligand is the hill coefficient. In reality, due to successive binding, it will be around 1.2.[2]
- kd: rate of backwards reaction is half the rate of k a
- Assumption given that the forward reaction is favourable but is still reversible. We could not find an exact value for the miRNA dissociation.
- Assumes all m bind to A simultaneously, not in succession
- Allows anyone to adapt our model with little to no experimental data
- Diffusion take 0 time, ie is instantaneous
- Our system is a weakly viscous liquid solution, which justifies our assumption
Variables:
- A=antimiRNA
- m=miRNA
- C=complex
-
k=rate
- ka=rate of forward reaction
- kd=rate of forward reaction
-
K=equilibrium constant
- Ka=Forward association reaction
- Kd=Backwards dissociation reaction
| Constant | Value |
|---|---|
| Rate of miRNA-mRNA binding (when miRNA is the limiting factor) | 2x10⁻³/mole/sec[3] |
From basic stoichiometric factors that our complex formation equation will look like:
- \(A + nm ⇌ C\)
- n = 2 (Number of miRNAs binding to our antimiRNA. In an ideal world, this is our Hill coefficient, where the two miRNAs show high positive cooperativity. In reality the hill coefficaient will be around 1.2[4]
- \(A + 2m ⇌ C\)
From general equilibrium constant rules, we know that:
- \[\boldsymbol{K_a} = \frac{[C]}{[A][m]^n} \]
- \[\boldsymbol{K_b} = \frac{[A][m]^n}{[C]} \]
At equilibrium, the change in complex concentration will equal 0
- \[\frac{d[c]}{dt} = \boldsymbol{k_a[A][m]^2 - k_d[C] = 0} \]
- \[\boldsymbol{k_a[A][m]^2 - k_d[C] = 0} \]
- \[\boldsymbol{\frac{k_a}{k_d} =} \frac{[C]}{[A][m]^2} \boldsymbol{= K_a} \]
- \[\boldsymbol{K_d = \frac{k_d}{k_a}}\]
Applying the Hill equation from the Imperial College Paper:
- \[The \ ratio \ of \ Bound \ A:Total \ A = \frac{[C]}{[A]+[C]} = \theta \]
- \[Subbing \ in \ [C] = \frac{[A][m]^2}{K_d} \]
- \[Becomes: \theta = \frac{(\frac{[A][m]^2}{K_d})}{[A] + \frac{[A][m]^2}{K_d}} \]
- \[Divide \ through \ by \ [A] \ and \ multply \ numberator \ and \ denominator \ by \ K_d \]
- \[We \ obtain: \frac{[m]^2}{K_d + [m]^2} \]
In action we know that:
- \[ [C] = [A_{initial}] * \theta = [A_{initial}] * \frac{[m]^2}{K_d + [m]^2} \]
We know that:
- \[ From \ research: \ k_a = 2*10^{-3} \ mol^{-1}s^{-1} \]
- \[ And \ from \ assumption: \ k_d = \frac 12 k_a\]
- \[ Therefore: \ K_d = \frac{k_d}{k_a} = \frac 12 \]
We know that \( \boldsymbol{A + 2m ⇌ C}\)
- And we need \([A_{initial}]≥ ½ [m]\)
- To set \([A_{initial}]\) to the minimum for it to not be a limiting factor, \([A_{initial}] = ½ [m]\). By doing this, we can reduce the wastage of the excess of \([A_{initial}]\)
Therefore:
- \[[C_{equilibrium}] = [A_{initial}] * \frac{[m]^2}{K_d + [m]^2} \]
- \[= \frac 12 [m] * \frac{[m]^2}{\frac 12 + [m]^2} \]
- \[= \frac{\frac 12 [m]^3}{\frac 12 + [m]^2} \]
Plotting this graph, with [m] on the horizontal axis and [C] on the vertical axis we get a graph looking like:
![Graph of [m] against [C]](https://static.igem.org/mediawiki/2021/thumb/f/f8/T--City_of_London_UK--Modelling_m_against_c.png/800px-T--City_of_London_UK--Modelling_m_against_c.png)
This graph shows the relationship between final complex concentration relative to the initial lesser miRNA concentration. Beyond the limits shown on this graph, the equations becomes nigh-linear.
Now we go back to our initial steps.
\[We \ iterated: \frac{d[c]}{dt} \boldsymbol{=k_a[A][m]^2-k_d[C]}\]
over time to figure out the complex concentration against time, knowing that \(k_a = 2*10^{-3} \ mol^{-1}s^{-1}\) and \(k_d\) is assumed to be half of \(k_a\).
The purpose of this step was to identify at which point in time the concentrations of the complexes significantly differed between preeclampsia patients and unaffected people.
From our preliminary project research, we found out that the miRNAs in preeclampsia patients were upregulated by 4 fold. With this information, we produced two graphs, one of which had quadruple the concentration of miRNA of the other, ie: 0.1M and 0.4M.
In addition, we did not set our anti miRNA concentration to double the miRNA concentration as we wanted to keep the miRNA concentrations as our only independent variable. Therefore, we set anti miRNA concentration to an excess of 2M instead of 0.2M and 0.8M respectively.


As can be seen from the graphs, it was actually the case that at quadruple the concentration of miRNA, the complex concentrations rapidly diverged between the two samples, almost within seconds of iteration. Both took the same amount of time to reach equilibrium (ie. time taken to plateau). At 5000s past zero, the concentrations of the two samples differed by 15 times, which was definitely significant enough to cover all errors due to toehold leakiness, human error, and other environmental factors.
Improvement on BATMAN 2017
Now using our AND gate model, we can substitute our calculated complex concentration as ‘miRNA’ on BATMAN’s model.
To figure out Firefly luciferase luminescence instead of GFP expression, the next step would only require the substitution of 2 rates: the transcription and translation rates of luciferase instead of GFP.
Once the substitution is done, our model and the BATMAN’s Mass Action Kinetics Model can be combined to provide future researchers and teams a tool to predict reporter gene expression relative to initial limiting miRNA concentration in a single Toehold Switch system involving multiple miRNAs in an AND gate.
Limitations
-
Hill coefficient is NOT 2 in real life
- This will mean that less miRNA will bind to the anti miRNA than theoretically expected.
-
Complex concentration over time graphs inaccurate
- 0.1M and 0.4M are exaggerated values and in reality, the miRNA concentrations in blood plasma/amplified product will be much less.
- This however, can be overcome by fixing the anti miRNA concentration of 2.0M to a reasonable excess concentration compared to the concentration in the blood plasma.
Nupack Model
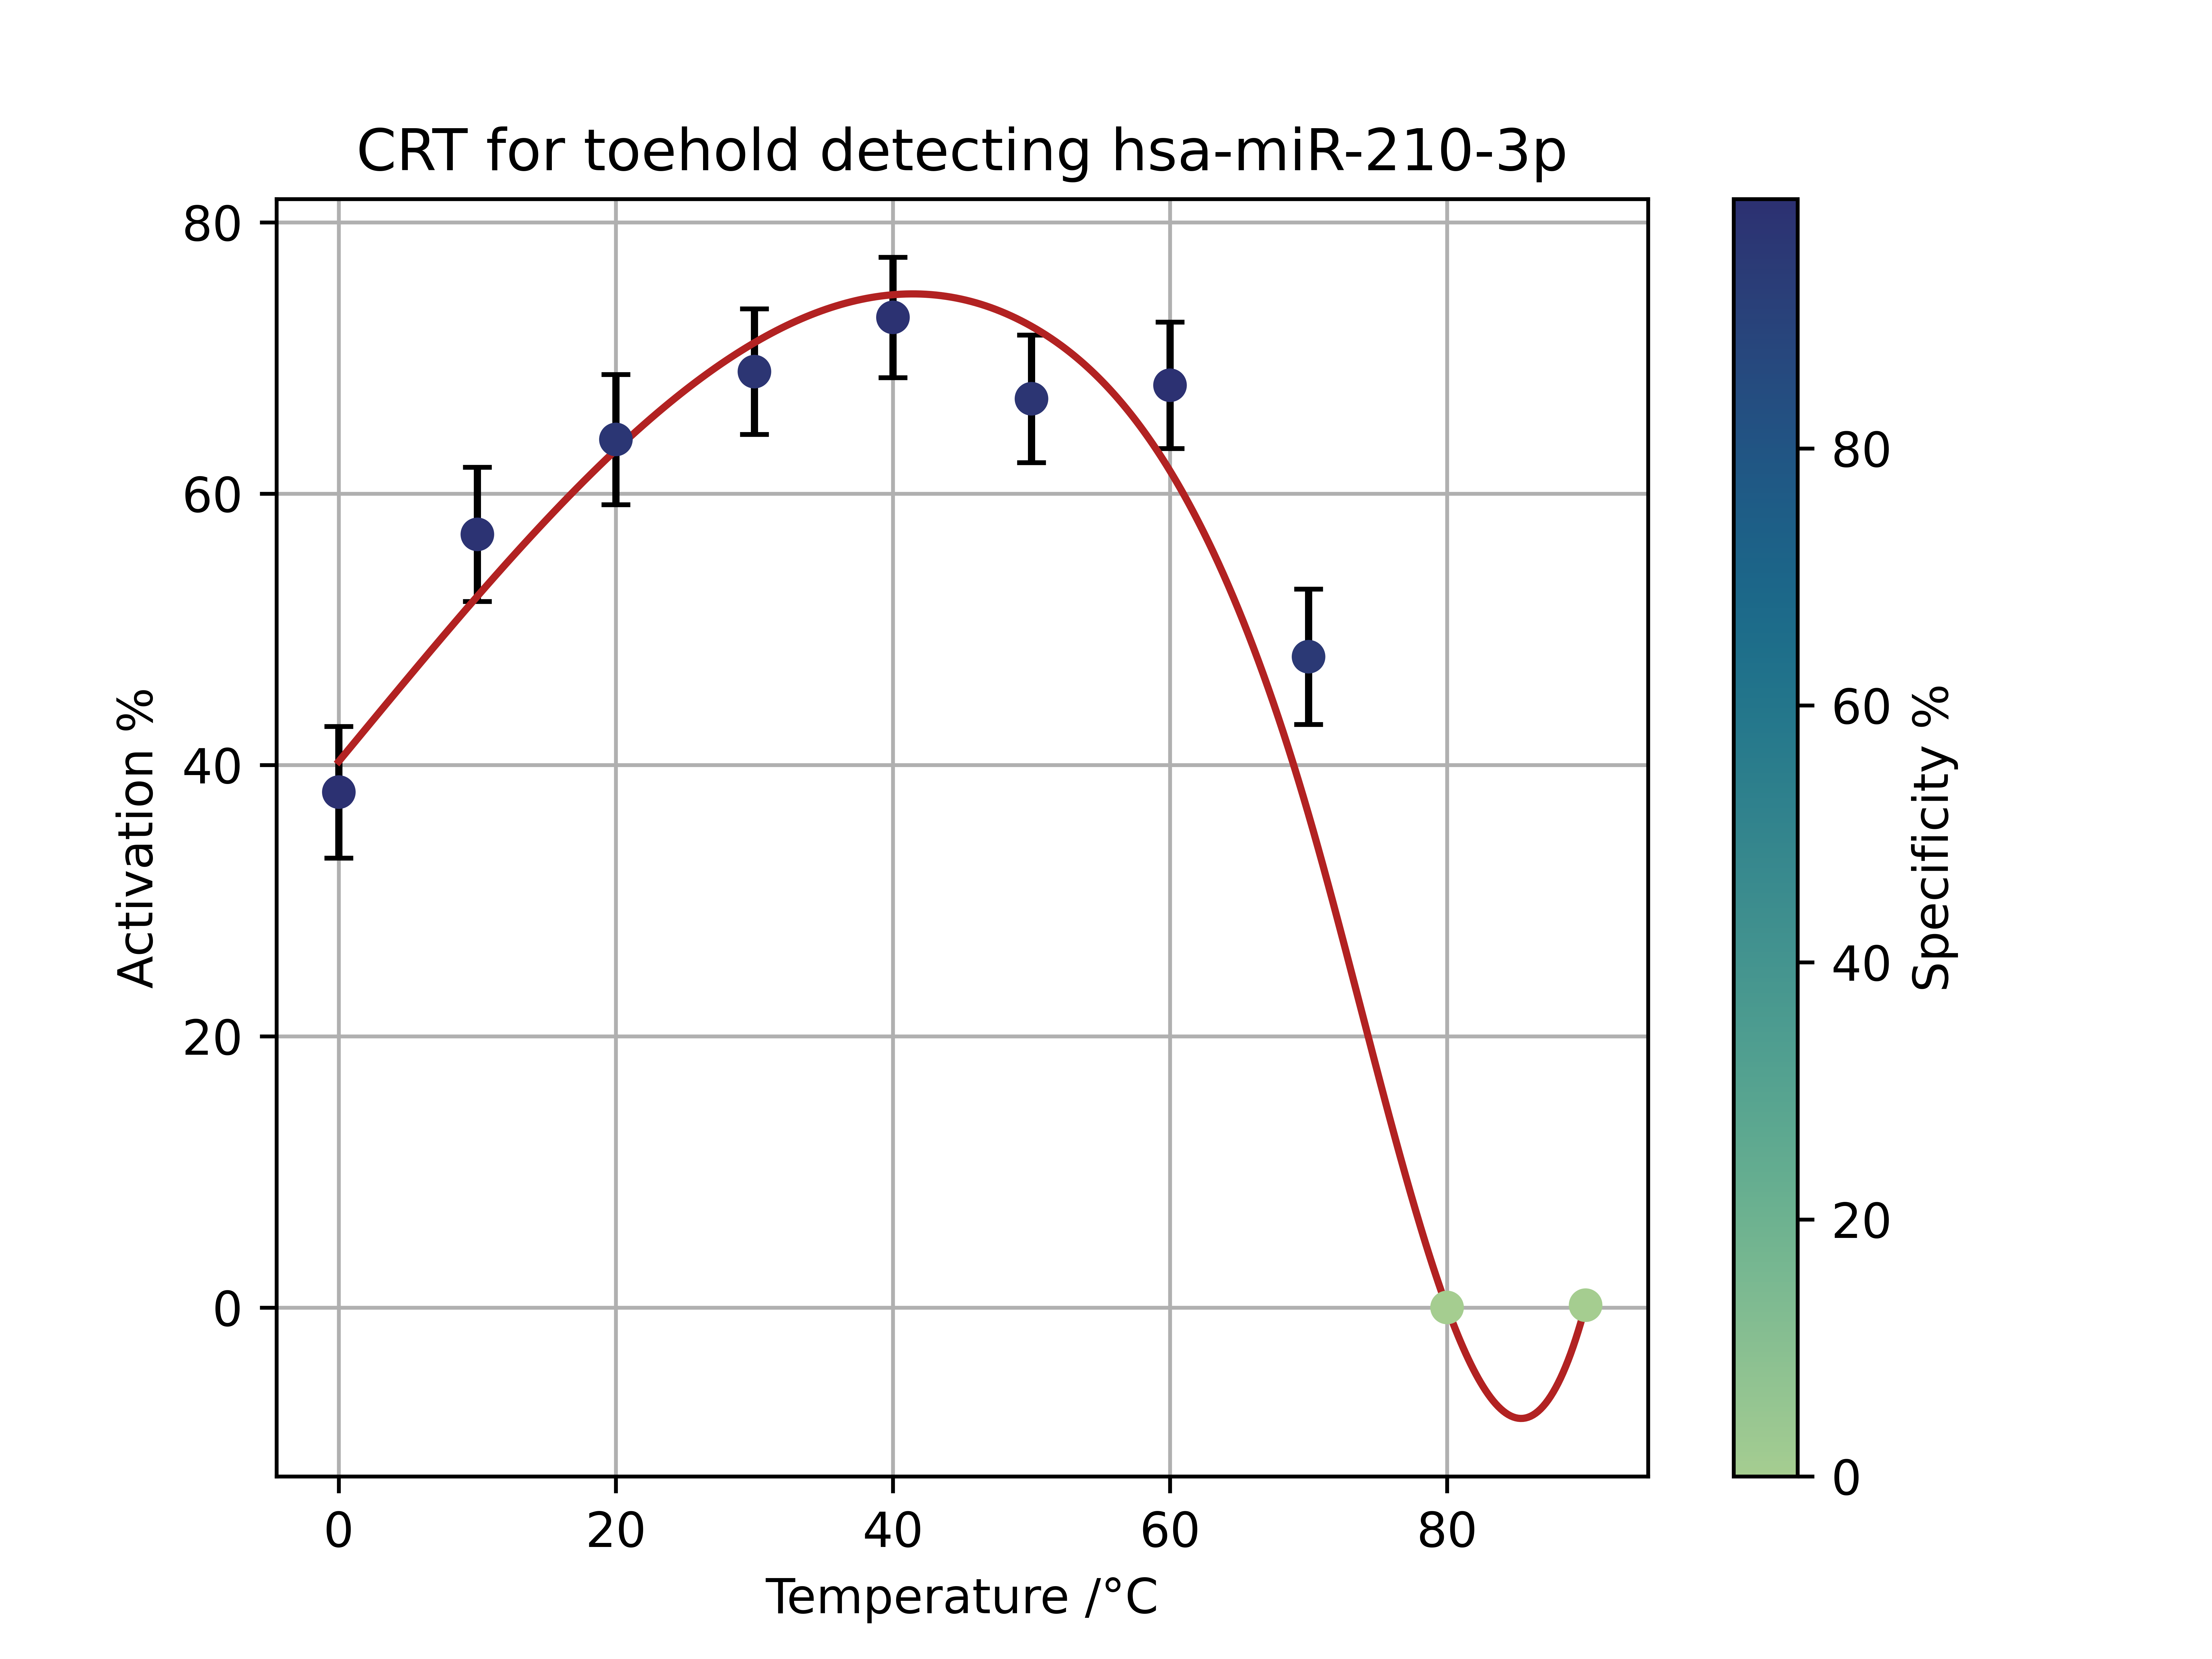
Using the NUPACK API, we developed a python script that would explore the specificity and activation of the toehold switch with our miRNA at different temperatures. The activation percentage is a scale of how often the AUG is exposed when a given toehold switch-trigger miRNA reaction takes place.
The specificity is a measure of how precise the toehold switch is at activating in response to our trigger miRNA as opposed to any other human miRNA. It is calculated by the percentage increase of activation percent of our trigger miRNA compared to their homologs.
Part BBa_K3905000, gen1 517-5p Toehold Switch

Part BBa_K3905002 gen 1 210-3p Toehold Switch
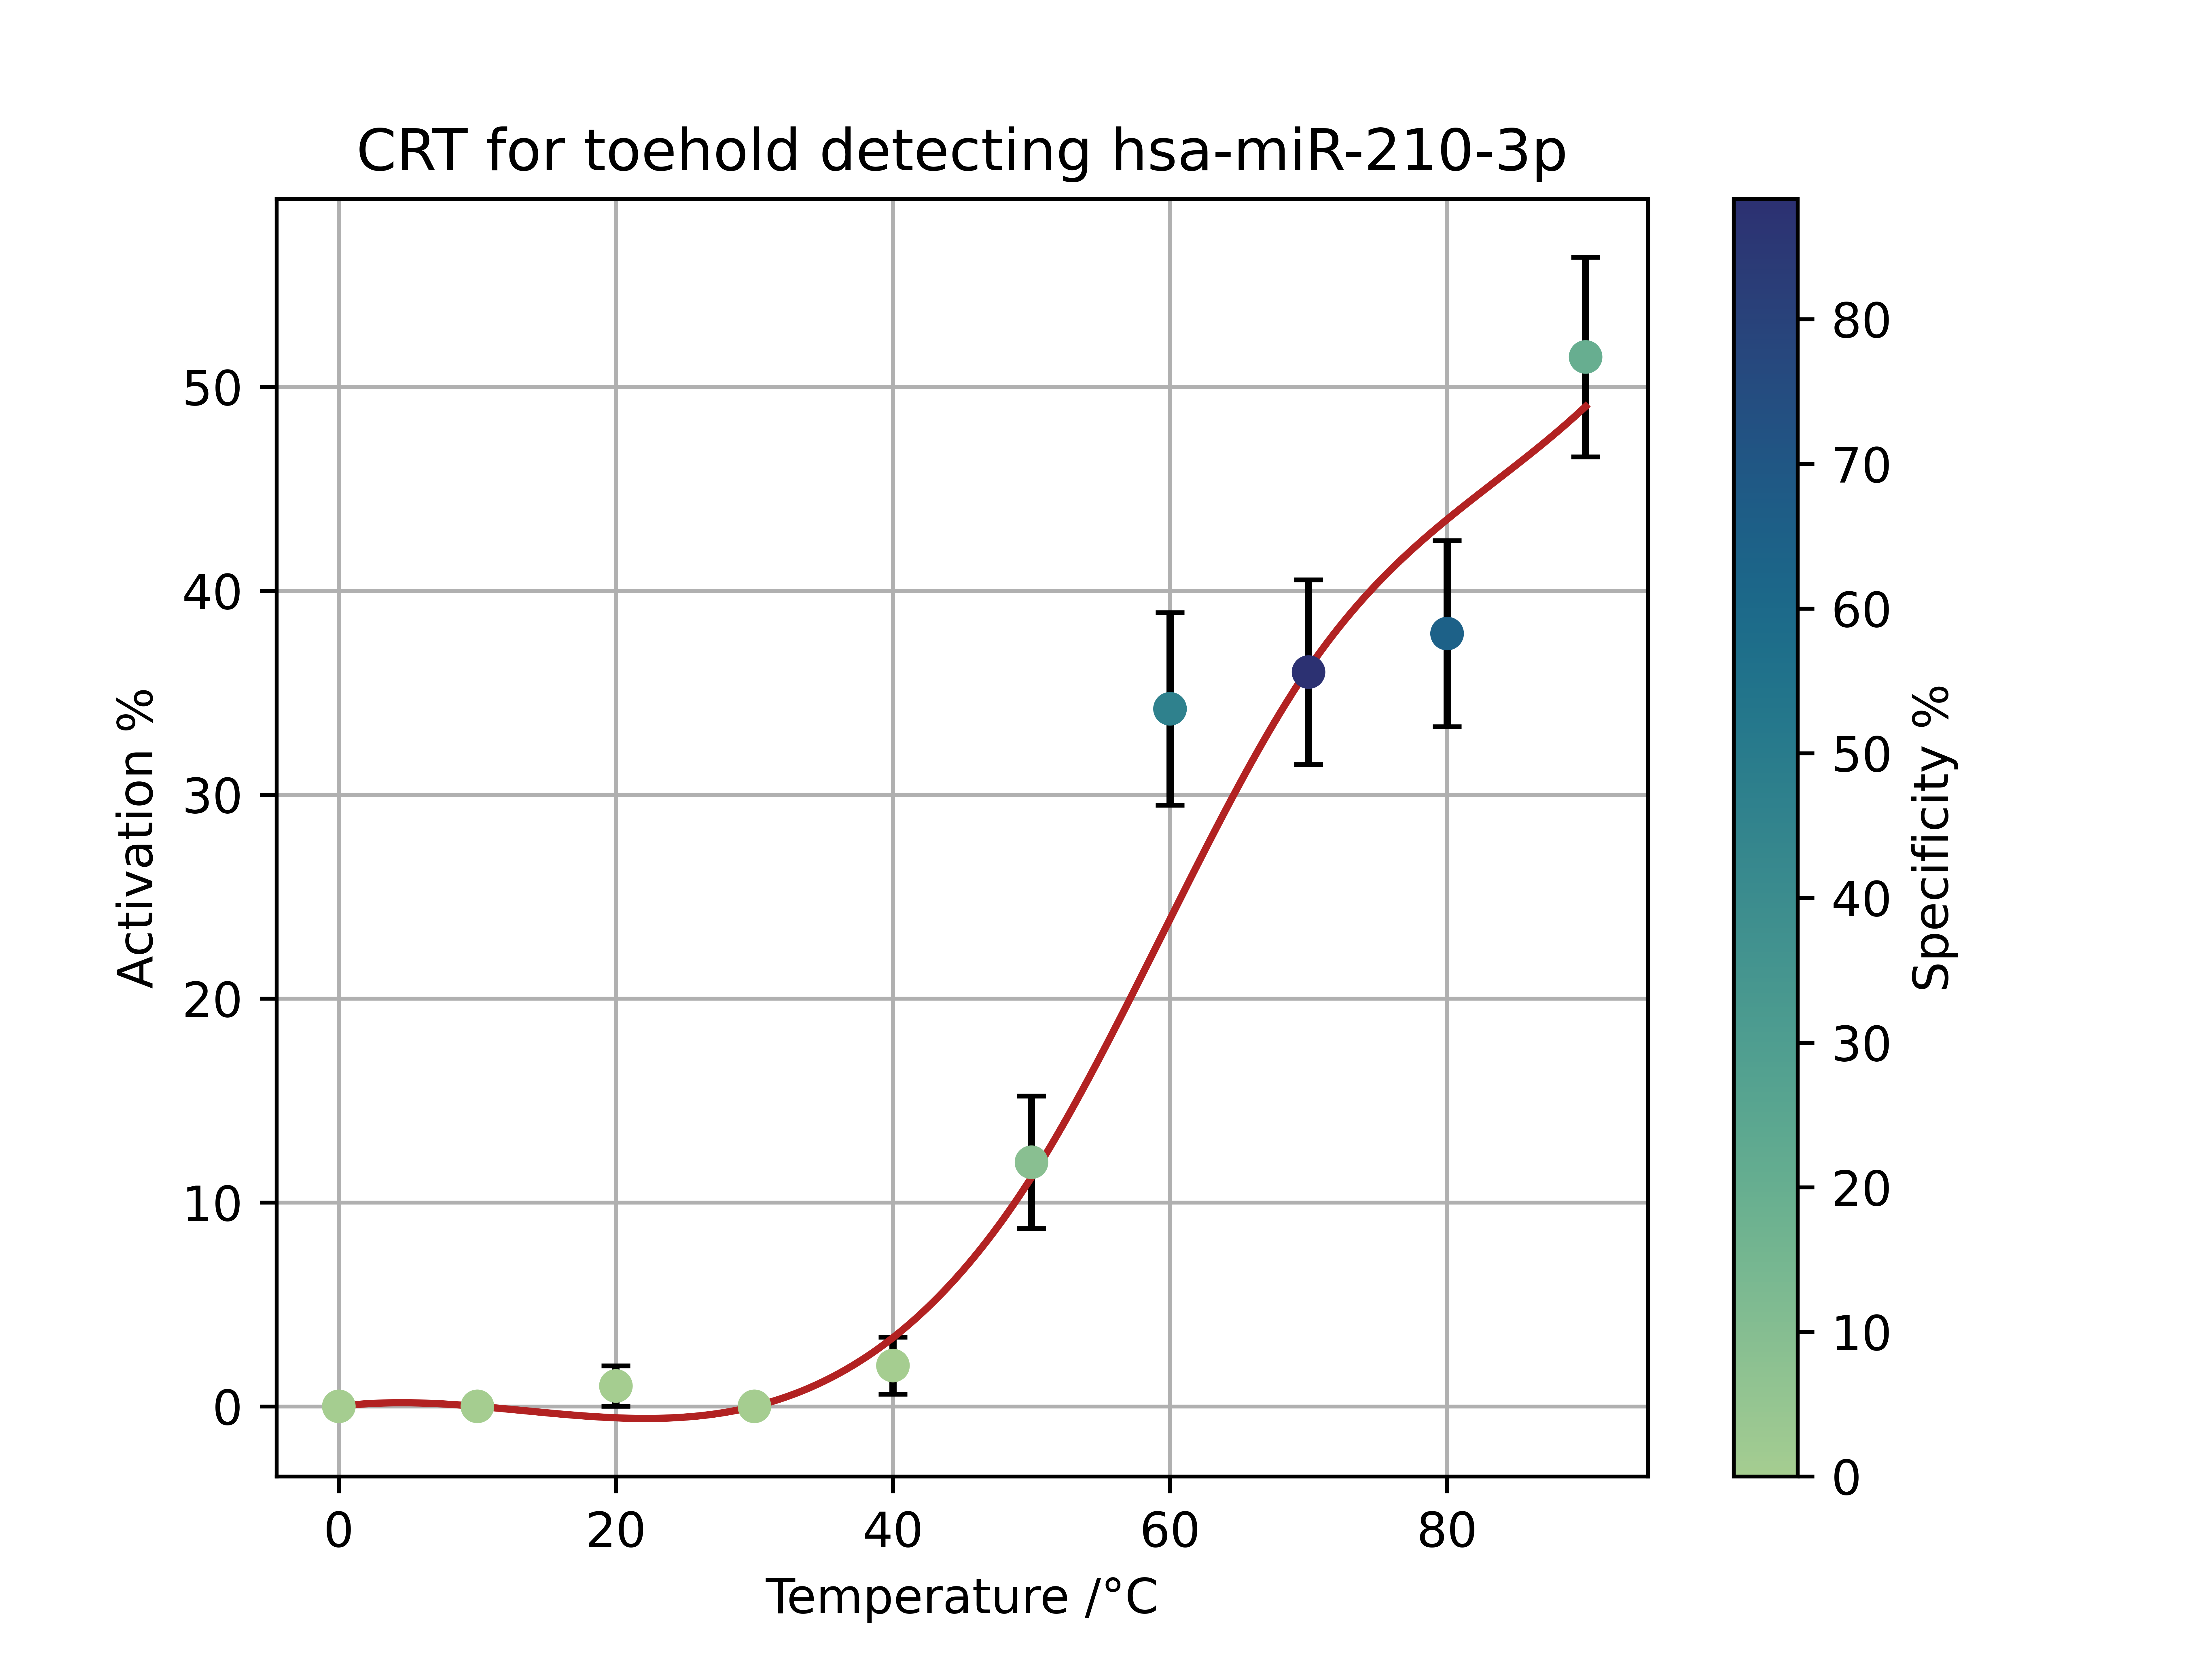
Part BBa_K3905004 gen 2 517-5p Toehold Switch
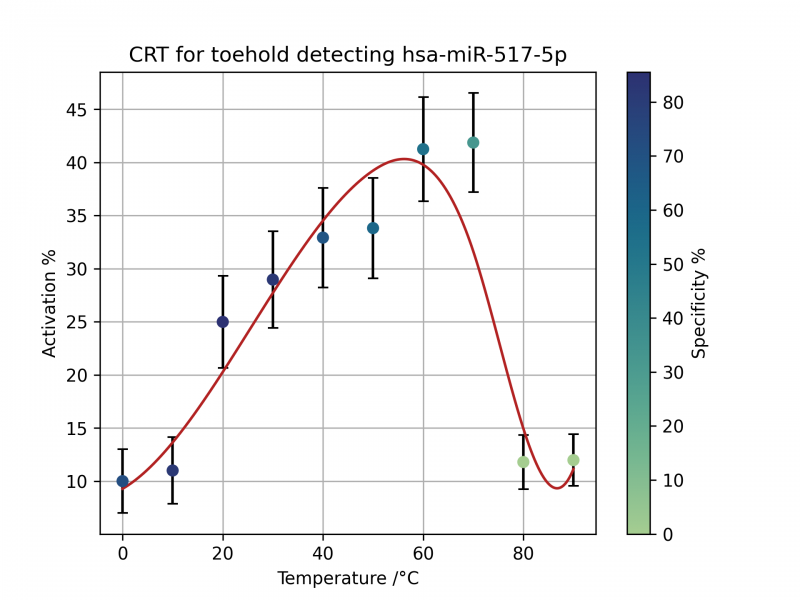
Part BBa_K3905005 gen 2 210-3p Toehold Switch
Cost Model
The statistics will focus on the UK since that’s our expertise and where we have got a lot of data on, also prices will be easier to assess since that's where we are based.
Please note before:
- Lower bounds of everything used to show that even in the worst case its still cost effective
- QALY stands for quality adjusted life year, and is one year of ‘good health’.
The calculations:
Births in the UK in 2019 were 712,0001[5]
6% of total pregnancies suffer from preeclampsia[6] \(= 712,000 * 0.06 = 42720 \)
Since in multiple studies there was high upregulation of the specific miRNAs we are testing for, we will assume the sensitivity to be 100%, meaning everybody who has preeclampsia will test positive. While false positives will obviously arise since the cost of the treatment is quite low in terms of the extra medication and the like we can ignore these since we have no concrete figures on the false positive rate anyway.
Thus, assuming we identify every one and use the range of treatments possible (and assume that the lowest bound of people are treated), we can prevent around 60% of preeclampsia cases, and assuming the same proportion of serious complications are also prevented will be assumed.[7]
42720 * 0.6 = 25632 prevented preeclampsia cases
Looking at the main complications
In regard to the study about the incidence rate of complications in pre-eclampsia - the overall preeclampsia rate was around 6% in this study which backs up the NHS’ figure of around 6%. The study was also done in Scotland which is great since it's the UK. While the data is a bit dated, the incidence of certain conditions given preeclampsia shouldn’t change much since we haven’t really become much better at predicting and treating preeclampsia since 2000.
- Eclampsia:
- 1.65% of preeclampsia births[8] → 422 eclampsia sufferers
- Perinatal death rate 5.6%[9] → 24 deaths (among children and late stage pregnancies)
- Maternal death rate[9] → Reported to be between 0 and 1.8%, hence as lower bound none assumed.
- While life expectancy in the UK is 81 years, we will use 70 to account for any health complications and premature death that result from eclampsia that result in less QALY.
- Total QALY given → 1680
- Abruptio Placentae
- Hematologic issues
- These are blood related issues that are one of the most common complications that result from pre-eclampsia (2.65%)[8], but since most are non-fatal especially in countries with developed healthcare systems such as the UK we will ignore these, which will just result in a further underestimate of our cost effectiveness.
For the statistics on perinatal and maternal death rate for abruptio placentae, the best and most robust study was done in Finland, which while not in the UK has a very good and developed healthcare system like the UK and actually has a lower infant mortality rate than the UK, hence should even be an underestimate of the death rates.
Examining the outgoing costs:
Text cost breakdown:
| Part |
Cost (£) |
|---|---|
|
LCD |
5 |
|
Arduino microcontroller |
6 |
|
Thermometer |
3.20 |
|
Wire |
2 |
|
Electromagnet |
5 |
|
Light sensor |
3 |
|
Magnetic beads |
7 |
|
Total |
£31.20 |
- The test should be reusable multiple times, so we will use 5 times as a conservative estimate, thought it could be a lot more. \[Cost \ of \ testing = £31.20 * \frac {712000}{5} → 4.44 million\]
- Cost of treatment → Since the methods of treatment are very inexpensive especially for a large healthcare system, we will assume that the cost reduction is mass producing the test will cover the cost of treatment.
Cost effectiveness:
\[\frac{4.44million}{6860} = £648 \ per \ QALY\]
Any treatment under £20,000 is deemed as cost effective by the UK’s national medical body[12], therefore even in the lowest bounds for everything and underestimating the cost effectiveness it is still well below the threshold. If the test only identified 3.5% of people or the treatment only helped 2% of those identified with the disease the cost per QALY would still be only be just under £20,000, which highlights the cost effectiveness further.
Improvements that could be made
- Going though more of the complications and finding the death rates of those.
- Going through the non-fatal conditions and trying to come up with ways to quantify the QALYs lost from those.
- Testing our kit and figuring out more exact values for the false positives and negatives.
Refrences
- Imperial College (2020) Introduction to Mathematical Modelling in Synthetic Biology Version 1 [Online] Available at: https://static.igem.org/mediawiki/2020/9/96/T--Imperial_College--introtomodelling.pdf [Accessed October 2021]
- Daniel Briskin, Peter Y. Wang, David P. Bartel. (2020). The biochemical basis for the cooperative action of microRNAs [Online]. Available at: https://www.pnas.org/content/117/30/17764 [Accessed 19 October 2021].
- Morozova, N., Zinovyev, A., Nonne, N., Pritchard, L. L., Gorban, A. N., & Harel-Bellan, A. (2012). Kinetic signatures of microRNA modes of action. RNA (New York, N.Y.), 18(9), 1635–1655. Available at: https://doi.org/10.1261/rna.032284.112 [Accessed October 2021]
- Daniel Briskin, Peter Y. Wang, David P. Bartel. (2020). The biochemical basis for the cooperative action of microRNAs [Online]. Available at: https://www.pnas.org/content/117/30/17764 [Accessed 19 October 2021].
- D. Clark. 2021. Number of live births in the United Kingdom from 1887 to 2019. [Online] Available at: https://www.statista.com/statistics/281981/live-births-in-the-united-kingdom-uk/ [Accessed October 2021]
- nhs.uk, 2018. Overview of Pre-eclampsia. [Online] Available at: https://www.nhs.uk/conditions/pre-eclampsia/. [Accessed October 2021]
- von Dadelszen, P., & Magee, L. A. (2016). Preventing deaths due to the hypertensive disorders of pregnancy. [Online] Best practice & research. Clinical obstetrics & gynaecology, 36, 83–102. Available at: https://www.ncbi.nlm.nih.gov/pmc/articles/PMC5096310/ [Accessed October 2021]
- Sohinee B., Doris M. C.. (2009). The Incidence of Severe Complications of Preeclampsia . [Online] Pages 181-190 Available at: https://www.tandfonline.com/doi/full/10.1081/PRG-200059873 [Accessed October 2021]
- Michael G Ross. (2019). Eclampsia [Online] Available at: https://emedicine.medscape.com/article/253960-overview#a20 [Accessed October 2021]
- Outi Riihimäki, Marjo Metsäranta, Jorma Paavonen, Tiina Luukkaala, Mika Gissler, Sture Andersson, Mika Nuutila, Minna Tikkanen. (2018). Placental Abruption and Child Mortality. [Online] Pediatrics Aug 2018, 142 (2) e20173915. Available at: https://pediatrics.aappublications.org/content/142/2/e20173915 [Accessed October 2021]
- Minna T., Mika G. et al. (2009). Maternal deaths in Finland: Focus on placental abruption. [Online] Acta Obstetricia et Gynecologica. 2009; 88: 1124�1127 Available at: https://obgyn.onlinelibrary.wiley.com/doi/pdf/10.1080/00016340903214940 [Accessed October 2021]
- National Institute for Health and Care Excellence. (2012). Methods for the development of NICE public health guidance (third edition). [Online] Available at: https://www.nice.org.uk/process/pmg4/resources/methods-for-the-development-of-nice-public-health-guidance-third-edition-pdf-2007967445701 [Accessed October 2021]