Team:Tuebingen/Results
Results
On the following pages we present to you the results of our various experiments.
Overview
For a better overview and easier understanding of our results, we structured the results part into the four main experimental steps Cloning , Expression in Nicotiana , Extraction and Purification , and Antimicrobial Assays . This overview page provides the summarized most important results for the seven different constructs we worked on. More details and discussion for these results are found on the other result pages.
On the Cloning page, we explain our cloning schedule, our cloning achievements in the lab, and what they mean for our overall project. In the next step, we explain our plant expression system and how it performed in the lab on the Expression in Nicotiana page. On the Extraction and Purification page, we then discuss our attempts to purify our cyclotides from the plants. The final essential experimental step in our project is the antimicrobial activity testing of our extracted and purified cyclotides. Our assays and their performance are found on the Antimicrobial Assays page.
Final Vectors
If you want to get an overview of all important information at one glance, you can easily click on the plasmids in our cloning scheme to find out which experiments we conducted with it and what the respective results are.
2in1 Vectors
3in1 Vectors


Cloning
- We designed a cloning schedule leading to a vector that enabled us to express GFP, the asparagine endopeptidase, and a cyclotide with a grafted AMP from one vector in plants.
- We successfully tested the system, cloned our constructs, and proved the high efficiency of our system.
Our cloning Levels
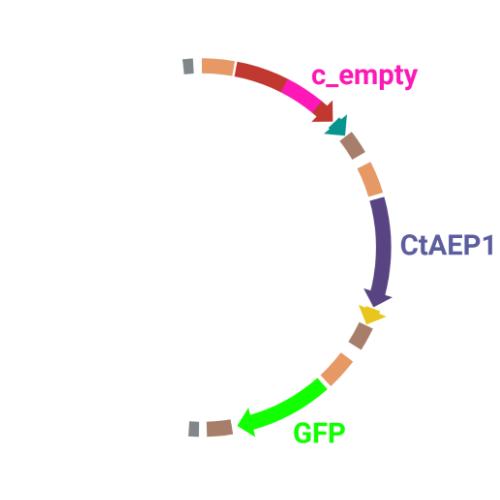
We used four levels of Golden Gate cloning to assemble our final vectors, including green fluorescent protein (GFP), the asparagine endopeptidase (AEP), and the cyclotide precursor with the different grafted cyclotide constructs. In the first cloning level, we cloned our 35S promoter, 35S terminator, the precursor coding sequence, our antimicrobial peptide (AMP)-containing cyclotide, or the tag (HA, myc) into a LI backbone. In the second level, we assembled single genes into one vector by combining promoter, coding sequence, terminator, and tag sequences from the first level. In the third level, we now combined these whole genes into one vector.

We built two kinds of level III vectors: 3in1 vectors containing the cyclotide precursor, the AEP and GFP, and 2in1 vectors containing only the precursor and GFP as a negative control. We called the vectors from this level “empty”, as they didn't contain our AMP yet. In the last level, we now cloned our AMP into the precursor in the empty LIII vectors. We labelled these vectors according to the grafted AMP and its position. So, c_CHEN_1 indicates that the cyclotide contains the CHEN AMP in loop number 1. We called the negative control cyclotide without any grafted AMP c_blank. Furthermore, all used cyclotides contained a His-Tag in loop 5.
Why we used Golden Gate Cloning
We chose a Golden Gate based cloning method as this system not only allowed us to assemble three genes into one single vector, but also to very quickly exchange the AMPs in the cyclotide precursor for grafting once the empty level III vector is assembled. These are the most important requirements our final vector had to fulfill. We needed to express three genes at the same time: our AMP grafted into the cyclotide precursor, the AEP to convert the precursor into a cyclotide, and GFP as an expression control. In theory, these genes could also be placed on different vectors and plants could be co-infiltrated with the different systems.
However, we highly preferred this 3in1 (3 genes in 1 vector) system, as this system ensures that AEP and cyclotide are expressed in the same cells, and all cells showing green fluorescence should also express the other two genes. Therefore, we regarded this system to be less error-prone and easier to handle. Building this vector by Golden Gate cloning was our preferred method, as we had access to basic vectors for this system including terminators, promoters, and tags. These vectors were kindly provided by the research group of Prof. Dr. Klaus Harter from the plant physiology at the ZMBP.
Testing our System
The vectors were assembled by Golden Gate reactions, transformed into
Escherichia coli
, and plasmids were purified from overnight cultures by Miniprep. All our cloning steps were successful, as confirmed by control digest and sequencing. The results produced for these steps are shown for the example of the c_blank vector in figure 1.

The correct cloning of the cyclotide with the respective AMP into our empty LIII 3in1 vector could also be verified through blue-white screening of the grown colonies on LB-agar plates supplemented with X-Gal. The empty LIII 3in1 vector contains a
lac-
operon, which consists of the
lac
promoter,
lac
operator,
lacZ
and
lacI
gene, at the cloning site, where the gene sequence coding for the precursor of the cyclotide (LI constructs c_blank, c_CHEN, or c_KR-12) was inserted by Esp3I restriction enzymes. The
lac
promoter is inducible, therefore transcription of the genes under its control only takes place when lactose or a lactose analog like Isopropyl-β-D-thiogalactopyranoside (IPTG) is added to the growth medium as it is otherwise repressed by an repressor encoded by the
lacI
gene.
The
lacZ
gene encodes for the enzyme β-galactosidase, which hydrolyses X-Gal to galactose and a substance, that turns blue upon oxidation
1
. Hence, we could recognize successfully cloned colonies by their color because bacteria carrying the LIII 3in1 plasmid with the cyclotide precursor appeared white and not blue due to them not expressing β-galactosidase.

The Efficiency of our System
In the end, our established cloning system enabled us to clone different grafted AMPs in a fast and efficient way. All our cloning steps directly worked, proving the high efficiency of our protocols. After the initial cloning of the level III vectors, new AMP constructs can be cloned into the final vector within 5 days. Therefore, the new AMPs have to be synthesized, which is cost-efficient due to their small size. To clone the synthesized fragments into the level III vectors within 5 days, the following schedule should be used:
| Day | Step |
|---|---|
| Day 1 | Golden Gate reaction level one (synthesised fragment into level I vector), transformation of competent E.coli cells |
| Day 2 | Pick colonies and set overnight cultures for Miniprep for plasmid purification |
| Day 3 | Miniprep, confirm correct clones by control restriction digest, Golden Gate reaction level IV, transformation of competent E.coli cells |
| Day 4 | Pick colonies (blue/white screening) and set overnight cultures for Miniprep for plasmid purification |
| Day 5 | Miniprep, confirm correct clones by control restriction digest and we have our purified plasmid for Agrobacterium transformation |
References
1 Julin, D. A. (2018). Blue/White Selection. In R. D. Wells, J. S. Bond, J. Klinman, & B. S. S. Masters (Eds.), Molecular Life Sciences: An Encyclopedic Reference (pp. 72–73). Springer New York. https://doi.org/10.1007/978-1-4614-1531-2_94
Expression in Nicotiana
- All final vectors were successfully transformed in Agrobacteria , as confirmed by colony growth on the respective selective plates.
- Successful transfection of plants and expression of our control was observed via fluorescence for all except one construct.
Procedure
After successful cloning, the purified vectors were transformed into Agrobacterium tumefaciens for the following agroinfiltration of tobacco plants. After growing the plants for 4 days, the recombinant protein expression of our control green fluorescent protein (GFP) was confirmed by fluorescence microscopy and the leaves were harvested for protein extraction and purification.
Transformation of Agrobacterium tumefaciens
The successful transformation of A. tumefaciens was confirmed by colony growth on the respective selective plates. We used the strain AGL1 which grows relatively slow, but has a high transfection rate and expression level. We successfully transformed all our level four vectors including our two negative controls for cyclisation with 2in1 vectors without the AEP gene, and 3in1 constructs containing the empty cyclotide precursor as a control (c_blank), grafted CHEN constructs (c_CHEN_1 and c_CHEN_6), and grafted KR12 constructs (c_KR-12_1 and c_KR-12_6).

Infiltration of Tobacco Leaves
Nicotiana benthamiana leaves were infiltrated with A. tumefaciens containing the respective vectors and a p19 suppressor of gene-silencing construct. Co-transfection of p19 is essential, as p19 prevents that the addition of the vector leads to RNA-induced gene silencing 1 . We infiltrated the tobacco leaves by syringe infiltration for transient protein expression. As a negative control, leaves were infiltrated with Agrobacteria containing only the p19 construct.
Fluorescence Microscopy

After growing the plants for 4 days, the expression of our expression control protein GFP was confirmed by fluorescence microscopy. In comparison to the negative control, leaves transfected with our final vectors showed clear green fluorescence for all except the c_KR-12_6 construct (figure 2). As a negative control, non-infiltrated leaves or leaves infiltrated with p19 only were checked for green fluorescence. As shown in figure 2, this negative control showed no significant level of green fluorescence, confirming that the green fluorescence we detected for other vectors can only result from successful expression of one of our final vectors.
Discussion
We can draw the conclusion that the transfection was successful for both the 2in1 and the 3in1 vectors. As the sequences coding for our antimicrobial peptide (AMP) constructs are located on the same vector as the sequence encoding for the GFP, the AMPs should be expressed in the plant cells, as further discussed in the
Extraction and Purification
section. For the c_KR-12_6 construct, where no fluorescence was observed, infiltration was only tried once and the failure could be explained by procedural inaccuracies like insufficient resuspension of the
Agrobacteria
-containing infiltration medium, leading to infiltration with a too low
Agrobacteria
concentration. Concluding from the fluorescence microscopy results, we can summarize that our transfection strategy is efficient and works for different AMP constructs.
However, not the whole infiltrated leaves were fluorescent but defined foci only, which indicates a low expression rate. As a further attempt to analyze the effectiveness of the agroinfiltration, GFP expression in the whole leave and also the whole plant could be analyzed under UV light.
Furthermore, to increase the efficiency of agrotransfection and especially the expression of the desired genes, viral vectors could be used instead of a non-replicating construct for the transient expression. RNA viral-based vectors combine several advantages in one, such as the ability of the replicons to move into neighboring plant cells by cell-to-cell movement, and therefore promise high expression yields of recombinant proteins in plants. The successful
Agrobacterium
-mediated delivery of a tobacco mosaic virus (TMV)-based vector into
N. benthamiana
leaves has already been shown
2
and it would therefore be a reasonable continuation of our project to attempt to reach higher expression yields of our cyclotides with a different vector.
References
1 Voinnet, O., Rivas, S., Mestre, P., & Baulcombe, D. (2003). An enhanced transient expression system in plants based on suppression of gene silencing by the p19 protein of tomato bushy stunt virus. The Plant Journal: For Cell and Molecular Biology, 33, 949–956. https://doi.org/10.1046/j.1365-313X.2003.01676.x
2 Marillonnet, Sylvestre; Thoeringer, Carola; Kandzia, Romy; Klimyuk, Victor; Gleba, Yuri (2005): Systemic Agrobacterium tumefaciens-mediated transfection of viral replicons for efficient transient expression in plants. In: Nature biotechnology 23 (6), S. 718–723. DOI: 10.1038/nbt1094.
Extraction and Purification
- Our standard protocols for extraction and purification did not work for our cyclotides.
- Troubleshooting and further experiments allowed us to exclude some potential problems that would explain the protocol failure and we assumed the buffer to be the most likely problem.
- MALDI-TOF MS was able to confirm the presence of peptides with masses highly similar to the cyclic constructs c_CHEN_1 and c_CHEN_6 in our extracts.
First Attempts of Extraction and Purification of our Cyclotides
The harvested leaves were frozen in liquid nitrogen and stored at - 20 °C before being pestled for extraction. The extraction was performed in HEPES buffer, whose composition was adjusted to the recommendations for the following His-purification via HisLink Protein Purification Resin (commercially available at Promega) 1 . Apart from the buffer we followed a protocol, which was shown to be suitable for the purification of plant peptides 2 .
The steps of the purification were analyzed on an SDS-PAGE gel and by western blotting using an anti-His antibody. We used tricine-SDS gels that are suitable for the separation of small peptides 3 . The first round of extraction and following purification was done with around 2 g of plant leaf tissue and a ratio of 1:2 plant mass:extraction buffer volume. In the extract, a total protein concentration between 0.6 to 1 mg/ml was detected. Afterwards purification via Ni-NTA was performed and the eluted fractions were then pooled and dialysed against HEPES buffer O.N. to remove the imidazole of the elution buffer. In this first experiment, no remarkable band was found in neither the Coomassie-stained SDS-PAGE gel, nor the western blot. Furthermore, the protein concentration in the eluate concentrated by centrifugation in protein concentrators (commercially available Amicon filters with a MWCO of 2 kDa) was under the detection limit of our protein quantification test and neither the crude extract nor the purified and concentrated protein showed any antimicrobial activity in our tests, as discussed in the antimicrobial assays section.

Troubleshooting
Overview
The empty blots and missing antimicrobial activity left us struggling with the interpretation of these results, as we could not identify which steps in the process did not work. Therefore, we collected different ideas and tried to test them to make our system work.
| The potential problem | How to test it |
|---|---|
| (A) Problem with the blotting procedure | Use a positive control, dot blot |
| (B) Expression of the peptide in plants did not work | No possibility to directly test expression, as all detection methods require extraction |
| (C) Expression of the AEP in plants did not work | Test AEP expression by western blot with HA antibody |
| (D) Low expression levels | Scale up |
| (E) Crushing of the leaves was not efficient enough | Not likely to be the problem |
| (F) Extraction buffer is not suitable for this peptide | Test more buffers |
| (G) The intramolecular His-tag cannot be recognized by the antibodies | MALDI to see a specific peak |
| (H) Peptide bound to plastic | Use control peptides in all steps and compare antimicrobial activity before |
(A) Problem with the Blotting Procedure
A.1 The Potential Problem
Using a His-tagged protein as a positive control confirmed, that the blotting and detection procedure in general worked. However, as cyclotides being very small and cyclic are very special peptides, it is still possible that they behave differently, showing a different running behavior during electrophoresis or different association with the blotting membrane. It might therefore be possible that they are not blotted on the PVFD membrane under the standard blotting conditions we applied.
A.2 How to Test it
A dot blot would be a possible alternative to the ‘classical’ blotting technique as it is a more direct technique for detecting, analyzing, and identifying proteins. It manages without prior separation via SDS-PAGE and is therefore relatively easy and fast to perform. The sample is directly applied onto the membrane and then treated with the respective antibodies 4 . This method could give us the chance to determine the expression of our His-tagged cyclotide quite early in the process without the need for previously purified protein.
(B) Expression of the Peptide in Plants Did Not Work
B.1 The Potential Problem
We used a GFP as an expression control to confirm the successful transfection of plant cells and the efficient gene expression of genes located on our vector. As we saw GFP fluorescence in our plant leaves, we know, that the agroinfiltration was successful and the plants expressed a protein from this vector with the very gene structure (same promoter and same terminator). However, we couldn’t detect the peptide neither as a specific band on the SDS-gel or in the western blot, nor detect its activity in the antimicrobial assays. Therefore, we had no direct proof for successful expression. Furthermore, it should be considered that GFP is a very well characterized and easy to express protein. Even if we codon-optimized the expression of the precursor and the AEP for Nicotiana , these genes remain more difficult to express, e.g. because of the ER-targeting signal. As our detection methods were all bound to a successful extraction of the peptide, we had no possibility to determine with step didn’t work. However, we assumed the extraction to be more likely to cause problems, as we could prove the expression of our control GFP.
(C) Expression of the AEP in Plants Did Not Work
C.1 The Potential Problem
Similar to point (B), we also couldn’t directly prove the expression of the AEP. If the AEP wouldn’t be expressed (which is still unlikely as our GFP control worked, but not impossible), the cyclotide cannot be produced. The precursor would still be expressed, but run at a different size on the SDS-gel and most likely be more unstable and could therefore be degraded in the cell up to some extent.
C.2 How to Test it
As we tagged the AEP with a HA tag, we should be able to detect it in a western blot using a common anti-HA-antibody. Again, this detection would be limited by successful extraction of the enzyme, but as the AEP is a more “usual” protein than the cyclotide, extraction shouldn’t be as problematic.
(D) Low Expression Levels
D.1 The Potential Problem
Another possibility is, that our whole system worked in general, but the expression levels of our peptide were too low for detection and antimicrobial activity.
D.2 How to Test it
We addressed this problem by increasing the number of leaves used for extraction and the assays, but we can never exclude that even higher numbers would lead to positive results. However, if the system would require such a high amount of plant mass, it wouldn’t be suitable for our project anyways, as infiltration of too many plants would contradict our demand for a fast and easy to handle system.
Click
here
to jump to our further experiments testing this potential problem.
(E) Crushing of the Leaves Was Not Efficient Enough
E.1 The Potential Problem
The next step in our protocol was the crushing of the leaves with mortar and pestle in liquid nitrogen. As our cyclotide should be located in the vacuole, successful extraction was bound to the destruction of the plant cell wall in this step. However, this step is very unlikely to be the problem in this process, this is believed to be the most efficient method to destroy the cells for protein extraction when compared to ribolyser tissue homogenizer or juicer, as confirmed by different experts we talked to. Therefore, we excluded this step to be the problem.
(F) Extraction Buffer is Not Suitable for This Peptide
F.1 The Potential Problem
Even if it was shown, that the buffer we used was suitable to extract plant proteins 2 , we assumed the buffer to be the most likely problem in our case, as the extraction of small peptides can be problematic and we had no information, how our grafted sequences could influence the process.
F.2 How to Test it
To adress this problem, more buffer conditions can be tested. Supplementing the HEPES extraction buffer with Tween20, was shown to help to extract more protein from plant tissue
5
. An acidic acetonitrile-based extraction buffer has been shown to be a well performing method for the extraction of cyclotides
6
. Therefore, we used two additional buffers, namely Lämmli buffer and an acidic acetonitrile-based buffer. During our excursion to Nomad, we got the advice, to only continue with the purification after we detected our cyclotide with Lämmli buffer extraction. Lämmli buffer is the SDS-PAGE gel loading buffer and typically contains 2% SDS and 5% β-mercaptoethanol, as well as 10% glycerol. Therefore, extraction in Lämmli buffer is a good first test to find bands on the gel and western blot, but the extracts are not very suitable for purification afterwards.
Click
here
to jump to our further experiments testing this potential problem.
(G) The Intramolecular His-tag Can Not Be Recognized by the Antibodies
G.1 The Potential Problem
We tagged our cyclotides with a His-tag for detection and purification. As the cyclotides are cyclic, the tag could not be located in the N- or C-terminal of the peptide, which would be the usual procedure. Instead, we located the six histidine residues in different loops for different constructs, flanked by flexible linkers to allow the tag as much structural freedom as possible. However, we found no comparative data for an intramolecular His-tag. Therefore, we do not know if the tag will be recognized by the antibodies in western blotting. Furthermore, the purification would be impossible, if the tag does not bind to the Ni-NTA resin. The intramolecular tag is one of the big uncertainty factors in our project. A non-functional tag would explain the problems in the western blot and purification.
G.2 How to Test it
The band in the SDS-gels should be visible independent of the tag, but only if the expression level is high enough. A further method to detect our peptide independent of the tag would be a MALDI-TOF MS experiment.
Click
here
to jump to our further experiments testing this potential problem.
(H) Peptide Bound to Plastic
The Potential Problem
Since the AMPs we used are positively charged they show strong affinity in binding non-specifically to surfaces via electrostatic forces 7 . Therefore, it is important to choose the right material of consumables in order to reduce the adsorption. A commonly used material for laboratory products is polystyrene which is negatively charged and thus our peptides would bind to the surface of these products 7 .
How to Test it
Before performing our experiments, we checked all our consumables we intended to use for working with the AMPs. For example, we bought special 96-well plates made of polypropylene. We also checked the material of reaction tubes and pipet tips which all turned out to be made of polypropylene. However, for some products we could not determine the material such as the material of the purification columns. In addition, we do not know how strong the binding of AMPs to negatively charged surfaces is and thus to what extend we would lose our product when working e.g., with materials made of polystyrene. To conclude, it might be possible that we lost part of our AMP-construct in the extraction and purification process. This would also explain why we could not detect our peptide in western blot. Due to lack of time, we could not do further experiments to prove this theory. But we thought about using a solution of our control peptides in all steps starting
from extraction until the end of purification. Finally, this sample could be used for antimicrobial assays. The comparison of the previous results of their antimicrobial activity with the solutions that undergo all process steps might reveal if the concentration of the AMP is decreasing during processing because the antimicrobial activity correlates to the concentration
8
. This is still not a proof of this theory but might give some hints on what and where the issue is.
Further Experiments
Scaling up
We thought that the main problem in our first purifications was the low protein concentration resulting in a too low product concentration in the concentrated eluates. Therefore, 5-6 g of leaves were used in the next extraction and the crushed leaves were incubated in the buffer for 1 h to increase extraction efficiency. The total protein concentration in the extracts was now around 1.5 mg/ml (1.44-1.71 mg/ml). To load more proteins on the SDS-PAGE, 100 µl of each sample were precipitated with acetone before loading. On the Coomassie-stained SDS-PAGE, no additional band was observed in the cyclotide-expressing plant extracts when compared to the flow through after His-purification. After purification, no protein band was visible on the gel. In the western blot, no protein band was detected in neither the crude extracts nor the purified samples.
Exchange of Buffer Components
Addition of Tween20
As already mentioned, from all the possibilities we figured out that could not have worked during our extraction and purification process, we considered the composition of our extraction buffer to be the most likely one. Therefore, we started a systematic testing process of different conditions. First, we supplemented our HEPES extraction buffer with Tween20, as this should help to extract more protein from plant tissue 5 . However, the addition of 0.05% Tween20 to our extraction buffer led to the same result on SDS-PAGE and western blot as before. Therefore, we used three additional buffers, namely Lämmli buffer, an acidic acetonitrile-based buffer and an adjusted SDS-buffer.
Lämmli Buffer
We resuspend our in liquid nitrogen crushed plant extracts in Lämmli buffer. After a short incubation on ice, the samples were denaturated by heating to 95 °C, followed by direct application on an SDS-PAGE. All samples showed clearly more distinct bands of all kDa sizes on the Coomassie-stained SDS-gel in comparison to the prior gels, as visible in figure 2. For example, the bands in all lanes at the size of about 53 kDa are most likely from the large subunit of the enzyme Rubisco (Ribulose bisphosphate carboxylase), a plant enzyme involved in photosynthesis.


In addition, we performed a western blot of the very same samples with an anti-His-Tag primary antibody to be able to specifically detect our His-tagged cyclotides. An immunoblot signal at a size of about 18 kDa could be detected (figure 3), which raised the suspicion that cyclization of our cyclotides by the AEP did not work, as the precursor of our constructs is about the same size as the detected signal.
Another possible explanation is that the band shows indeed our cyclotide, which does not run at the expected molecular range in the SDS-PAGE. This could be due to its highly positive charge, which might not be completely masked by the negatively charged SDS or due to its cyclic structure. Unfortunately, no signal was detected for our positive control, a His-tagged protein of about 84 kDa. This could be explained by the huge size difference between this control and our peptide. Thus, it could have happened that the blotting of the control on the membrane did not work.
Acidic acetonitrile-based Buffer
The results from the leaves, which were extracted using an acidic-acetonitrile based buffer are also displayed on the gel and blot (Figure 2 and 3). For this method (adapted from Poon et al, 2018)
6
we used dried leaf material and evaporated the extraction solvent in the last step. Prior to applying these samples onto the SDS-PAGE some of the extract was therefore solubilized in ddH2O and then mixed with 2X Lämmli buffer in equal ratio. As can be seen in figure 2, the lanes of these samples show an irregular picture, as no clear and distinct bands can be identified apart from one apparently quite big band at the height of 3.5 kDa. For these samples no signal could be detected in the western blot (figure 3).
Because of the unusual bands in the gel, we decided to repeat this experiment and applied freshly prepared samples onto a Tricine-SDS gel as well as performed a western blot afterwards. The gel looks very similar to the first attempt (compare figure 2 and 4) but on the blot we were able to detect some signal this time (figure 5). However, the molecular weight (MW) range (smaller than 3.5 kDa) in which the signal occurs does not correspond to anything we expect. Only in the lane of the construct 3in1 c_CHEN_6 a weak band can be observed at the MW of about 8 kDa, which would be around the expected size of our cyclotide construct. But as the signal is very low, this assumption would have to be verified by further experiments.


Adjusted SDS-buffer
From the above stated results, we concluded that the extraction with a buffer supplemented with SDS seems to be the best approach. However, samples dissolved in Lämmli buffer are unsuitable for further experiments, neither purification nor assays to be able to verify the antimicrobial activity. Thus, we decided to use a slightly adjusted (only 1% SDS and no β-mercaptoethanol as reducing agent) Tris-based SDS buffer, which is recommended for the extraction of plant proteins for further use in protein quantification and analysis
9
.
To use the peptides extracted with this method for our antimicrobial activity assays, we needed to remove the SDS. Our first attempt was to use dialysis chambers (which we originally used to remove the imidazole after purification via Ni-NTA resin) and dialyze against a large volume of HEPES buffer O.N. as this was the buffer all previous samples and our control peptides were solubilized in (compare
antimicrobial assays
section for more information). For analysis on the SDS-PAGE we took samples prior to and after dialysis. We could show that no remarkable amount of protein was lost (figure 6). Afterwards we figured out that removal of SDS via dialysis is somehow impossible due to the interaction of the anionic detergent with cationic proteins and we followed another protocol for the removal via acetone precipitation
10
. Afterwards the protein pellets were resolubilized and analyzed on a gel (figure 7). We observed less bright bands here, however, this might have other reasons than loss of protein, e.g., less good staining.


Here we also used western blotting as a further method for analysis of the separated protein bands on the associated gels. First of all, it can be mentioned that this time we were able to see a signal of our positive control, a His-tagged protein with a size of about 14 kDa. The protein sample was unfortunately not really purified and therefore bands of other molecular weight can also be observed (figure 8). Furthermore, on the blot of the gel with the samples directly after extraction and after dialysis O.N. several bands are visible at a size of about 18 kDa and 24 kDa. As these bands are also detectable in the negative control (p19), it might be unspecific binding of the antibody. The western blot of the gel with the samples after SDS removal via precipitation showed no signal except for the positive control (data not shown).
MALDI-TOF MS
As stated above, plant crude extracts with Lämmli buffer and with acidic acetonitrile-based buffer showed protein bands with questionable identity: The 18 kDa band detected with an anti-His antibody in the Lämmli extracts, which may correspond to the cyclotide precursor or could indicate an unusual SDS-PAGE running pattern of the cyclotide itself, and the diffuse 3.5 kDa protein load visible in the Coomassie-stained acetonitrile extracts. To get more insights into the identity of these bands, mass spectrometry (MS) was performed.
Procedure
At first, gel slices at the designated height, corresponding to the protein MW marker, were cut out of the Coomassie-stained SDS-PAGE gels. For the Lämmli extracts, gel slices were cut out at the 18 kDa height, while for the acetonitrile extracts, gel slices were cut out at the 3.5 kDa height.
Subsequently, the gel slices were destained, homogenized, extracted and dried from solvent in a vacuum concentrator. The dried samples were dissolved in 1:10 diluted HEPES extraction buffer, together with dried acetonitrile extracts. These samples were measured using MALDI-TOF MS.
Results
Most of the samples’ MS spectra showed no peaks with appropriate m/z ratio with relevant peak intensity. The MS spectrum of the 18 kDa Lämmli extract gel slice of 3in1 construct c_CHEN_1 showed a single peak corresponding to a m/z ratio of 5724.41 (figure 9). This value could fit with a single-charged M+ ion of cyclic c_CHEN_1, which has a theoretical average mass of 5718.30 Da with all cysteine (cys) residues reduced, as would be expected after the SDS-PAGE involving the reducing agent β-mercaptoethanol, and a theoretical average mass of 5712.30 Da with all cys residues oxidized. The deviation between theoretical mass and observed m/z ratio could be explained by the fact that the used mass spectrometer was only calibrated in the range of 2 to 4 kDa. Furthermore, it is unknown in which form our peptide occurs, since unknown modifications might be adhered. However, the running pattern in the SDS-PAGE gel does not fit the MW of our cyclotide construct. We speculated that the high positive charge of our construct, originating from its His6 tag and the cationic AMP graft, could influence its SDS running pattern.

The dissolved acetonitrile extracts were additionally concentrated and desalted using C18 resin. The MALDI-TOF MS spectrum of 2in1 construct c_CHEN_6 showed no fitting peaks. However, many peaks corresponding to m/z ratios around 3400 were visible (figure 10 A). These peaks fit single-charge M+ ions of peptides making up the broad band visible at around 3.5 kDa in the Coomassie-stained SDS-PAGE gel of the acetonitrile extracts. Therefore, we concluded that our cyclotides are unlikely to be represented by this 3.5 kDa band. The spectrum of 3in1 construct c_CHEN_6 showed a low-intensity peak with a m/z ratio of 6033.16 (figure 10 B). This value is similar to the average mass of a single-charged M+ ion of cyclic c_CHEN_6, which is expected to be 6041.89 Da with all cys residues reduced, and 6035.89 Da with all cys residues oxidized, as would be expected since no reducing agent was used on this construct.

Additionally, LC-MS was performed with the concentrated and desalted acetonitrile extracts of 2in1 and 3in1 construct c_CHEN_6. However, we were not able to detect any peaks characteristic for our cyclotide constructs (data not shown).
Conclusion
All in all, MALDI-TOF MS was able to confirm the presence of peptides with masses highly similar to the cyclic constructs c_CHEN_1 and c_CHEN_6, occurring in the Lämmli extract or in the acetonitrile extract, respectively. However, it is difficult to draw the conclusion that we actually detected our cyclotides, since the MS was performed with crude extracts most likely containing thousands of different peptides and proteins. We therefore presume that we may have actually detected our cyclotides using MALDI-TOF MS and western blot, but that peptide concentration is too low to see them in the LC-MS spectrum. In general, western blot is a method better suited for the detection of low abundance peptides, while mass spectrometry-based methods are used to characterize the exact mass of proteins already proven to be present 11 . Also, the occurrence of only a single peak corresponding to the cyclotide constructs in the mass spectra fits previous MALDI-TOF results of cyclotides purified from N. bentamiana .
References
1 Promega Corporation: HisLink Protein Purification Resin Technical Bulletin #TB327.
2 Potula, H. H. Surya Kumar; Kathuria, Sonal Roy; Ghosh, A. K.; Maiti, T. K.; Dey, S. (2008): Transient expression, purification and characterization of bioactive human fibroblast growth factor 8b in tobacco plants. In: Transgenic research 17 (1), S. 19–32. DOI: 10.1007/s11248-007-9072-4.
3 Schägger, H. (2006). Tricine-SDS-PAGE. Nature Protocols, 1(1), 16–22. https://doi.org/10.1038/nprot.2006.4
4 Piazza, R. M., Caetano, B. A., Henrique, C. P., Luz, D., Munhoz, D. D., Polatto, J. M., Rocha, L. B., Silva, M. A., & Mitsunari, T. (2020). Chapter 6 - Immunological tests for diarrhoea caused by diarrhoeagenic Escherichia coli targeting their main virulence factors. In C. S. Pavia & V. Gurtler (Eds.), Methods in Microbiology: Immunological Methods in Microbiology (Vol. 47, pp. 151–207). Academic Press. https://doi.org/10.1016/bs.mim.2019.11.004
5 Giritch, Anatoli; Marillonnet, Sylvestre; Engler, Carola; van Eldik, Gerben; Botterman, Johan; Klimyuk, Victor; Gleba, Yuri (2006): Rapid high-yield expression of full-size IgG antibodies in plants coinfected with noncompeting viral vectors. In: Proceedings of the National Academy of Sciences 103 (40), S. 14701–14706. DOI: 10.1073/pnas.0606631103.
6 Poon, S., Harris, K. S., Jackson, M. A., McCorkelle, O. C., Gilding, E. K., Durek, T., van der Weerden, N. L., Craik, D. J., & Anderson, M. A. (2018). Co-expression of a cyclizing asparaginyl endopeptidase enables efficient production of cyclic peptides in planta. Journal of Experimental Botany, 69(3), 633–641. https://doi.org/10.1093/jxb/erx422
7 Wiegand, Irith; Hilpert, Kai; Hancock, Robert E. W. (2008): Agar and broth dilution methods to determine the minimal inhibitory concentration (MIC) of antimicrobial substances. In: Nature protocols 3 (2), S. 163–175. DOI: 10.1038/nprot.2007.521.
8 Bernier, Steve P.; Surette, Michael G. (2013): Concentration-dependent activity of antibiotics in natural environments. In Frontiers in microbiology 4, p. 20. DOI: 10.3389/fmicb.2013.00020.
9 Conlon, H. E., & Salter, M. G. (2007). Plant Protein Extraction. In E. Rosato (Ed.), Circadian Rhythms: Methods and Protocols (pp. 379–383). Humana Press. https://doi.org/10.1007/978-1-59745-257-1_28
10 Henderson, L. E., Oroszlan, S., & Konigsberg, W. (1979). A micromethod for complete removal of dodecyl sulfate from proteins by ion-pair extraction. Analytical Biochemistry, 93, 153–157. https://doi.org/10.1016/S0003-2697(79)80129-3
11 Aslam, B., Basit, M., Nisar, M. A., Khurshid, M., & Rasool, M. H. (2017). Proteomics: Technologies and Their Applications. Journal of Chromatographic Science, 55(2), 182–196. https://doi.org/10.1093/chromsci/bmw167
Antimicrobial Assays
- Microdilution assays could be shown to be a suitable method for verification of antimicrobial activity.
- No significantly antimicrobial activity of our cyclotides could be shown.
Inhibition zone assays
As an easy and fast method to estimate the antimicrobial activity of our antimicrobial peptides (AMPs) we used inhibition zone assays. This method, also known as Agar disk-diffusion testing, was developed in 1940
1
and is nowadays still the official standard method in many clinical microbiology laboratories
2
. Generally, agar plates are inoculated with a known concentration of test microorganism and then filter paper discs containing the compound to be tested are placed on the agar. The germination and growth of bacteria is inhibited as the antimicrobial substance diffuses into the agar and as a read out the diameters of inhibition growth zones are measured
3
.
Therefore,
Escherichia coli (E. coli)
BW25113 and
Bacillus subtilis (B. subtilis)
168 were grown as overnight cultures in LB medium and those were used to inoculate new cultures. When they reached middle logarithmic growth phase (OD
600
= 0.8 - 1.0) they were diluted either 1:10 or 1:50 and spread onto LB-agar plates. Small filter plates were placed onto the agar plates and 20 µl of sample were pipetted onto each plate. The plates were incubated over night at 37 °C.
We used the crude extract of the transfected
Nicotiana benthamiana
leaves as well as the purified peptides for testing. As positive controls we applied the chemically synthesized AMPs CHEN and KR-12 as these are grafted into our cyclotide construct. We also tested leaves from plants that were transfected with the construct of the empty cyclotide scaffold (c_blank) as a negative control. All samples were solubilized in HEPES buffer (100 mM HEPES 150 mM NaCl, 3 mM KCl, pH 7.5), thus an influence of the buffer system can be ruled out.
After incubation of the agar plates O.N. we observed inhibition zones around the filter plates, on which on our positive controls were applied for both bacterial strains, which is shown in figure 1 and figure 2, respectively. However, we used much higher concentrations (100 µM and 10 mM) than the minimal inhibitory concentration (MIC) that can be found in the literature for the respective AMPs (MIC
CHEN
= 3.13 µM, MIC
KR-12
= 2.5 µM)
4,
5
. Neither the crude extracts of our infiltrated
N. benthamiana
leaves nor the purified peptides to be tested show any inhibition of bacterial growth. The negative control shows no inhibition as well.
The fact that even our positive controls only worked quite high concentrated indicates that the inhibition zone assay is unsuitable for the determination of the antimicrobial activity of AMPs. This might be due to interactions with the LB medium, which might shield the activity of the negatively charged AMPs as this charge is crucial for their functionality. This has been observed by other researchers before
6
. Therefore, we decided not to use these assays anymore for the testing of our peptides but focused on microdilution assays.


Microdilution assays
Two-fold microdilution assays were performed in order to obtain quantitative results. In each well of a 96-well plate, bacterial suspension of
E. coli
or
B. subtilis
overnight cultures were aliquoted. Samples were added in a two-fold diluting manner and plates were incubated at 37°C for 24h. Before (t
0
)and after (t
1
) incubation, OD
600
was measured. We calculated bacterial growth with the following equation: t
1
- t
0
. Since all data are represented as delta t, the influence of intrinsic colors of extracts can be excluded. For cultivation we used brain heart infusion (BHI) and the standard medium for microdilution assays, Mueller-Hinton Broth (MH). However, antimicrobial activity might be hidden by media components
6
. Therefore, we diluted MH 1 to 5 (MH 1/5) in order to reduce the influence of media on our constructs, as already shown in a recent publication
7
.
Since we used our crude extracts, we could not determine the concentration of the constructs. Thus, all results are stated as dilution factors of the respective crude extracts. For each sample we performed a serial dilution series starting with the undiluted extract (=1) until a 1/32 (=0,03) dilution. As growth controls we cultivated bacteria in the respective media without any extracts. We used synthesized peptides KR-12 und CHEN diluted in HEPES buffer (100 mM HEPES 150 mM NaCl, 3 mM KCl, pH 7.5) in defined concentrations for positive controls. All conditions were prepared in triplicates and results are stated as mean of each triplicate. Statistical analysis was performed in Origin 2019 using 1-way ANOVA with p-value at 0.05.
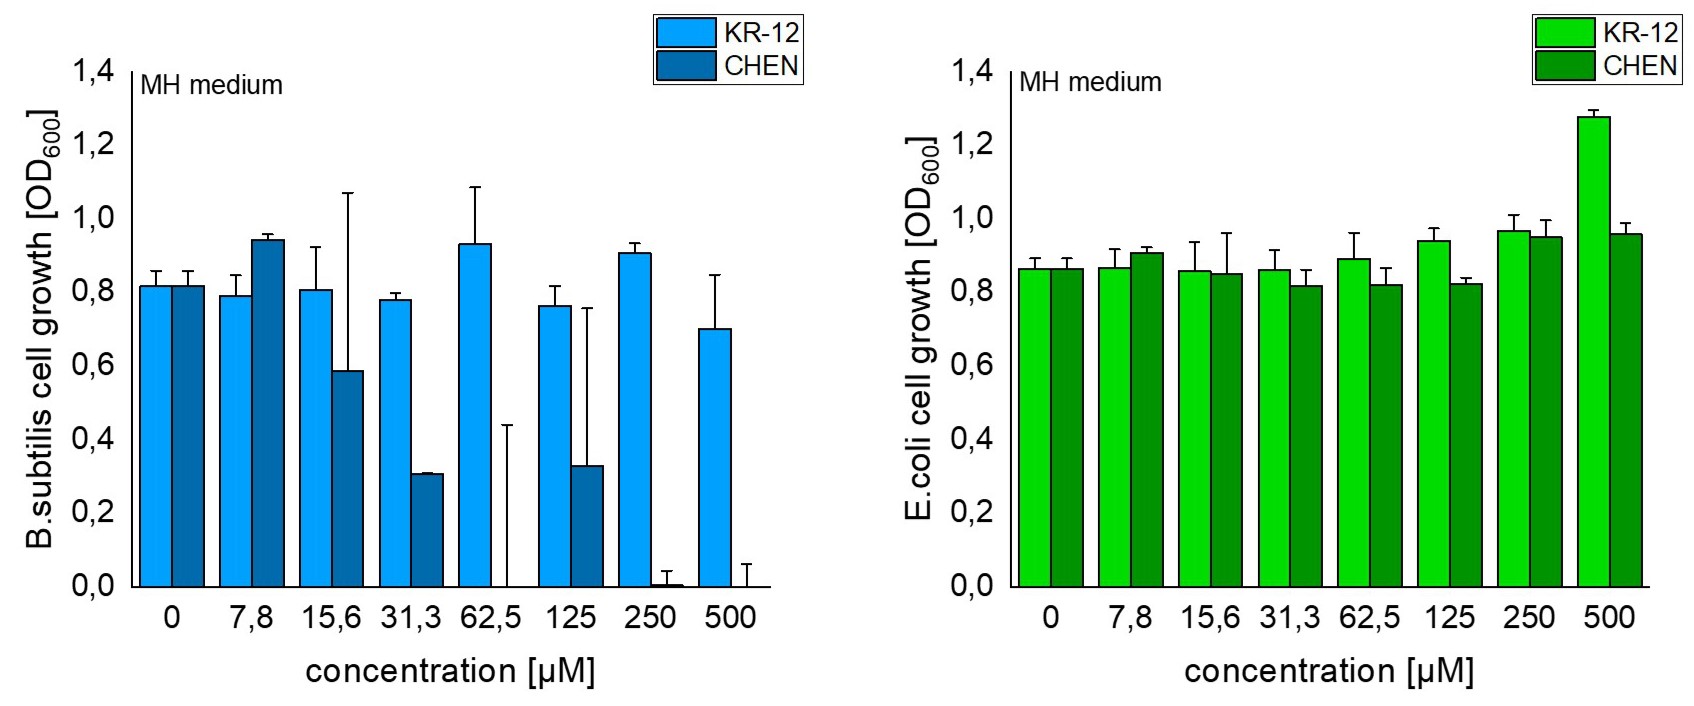
As already assumed, different media show different effects of our constructs. This is due to the fact that some media conditions can hide the antimicrobial activity 6, 7 . Since we did not observe any activity in BHI, neither for our constructs nor for the control peptides, we excluded these results in the following discussion. In the control peptides, we did not observe growth inhibition of E. coli in MH medium. In contrast, B. subtilis is sensitive to the control peptides and bacterial cell growth is significantly reduced already with a 31,3 µM concentration (fig. 3). With the control peptides we observed in MH media diluted to 1/5 (MH 1/5) an inhibition in bacterial growth in both, E. coli and B. subtilis (fig. 4) However, the growth control of both bacteria strains in MH 1/5 showed lower cell growth compared to undiluted MH media (fig. 3-4). Therefore, it might be possible that bacteria are already stressed because of a lack in nutrition and this might make the cell more susceptible to the peptides. Interestingly, in all control samples, except for E. coli in MH 1/5, CHEN showed stronger antimicrobial activity compared to KR-12 (fig. 3-4).

For all undiluted crude extracts significant cell growth decrease was observed in all constructs for
B. subtilis
in MH media and in c_CHEN_1 construct for E. coli in MH compared to growth control (fig. 5). However, both bacteria strains showed an increase in cellular growth compared to growth control in MH 1/5. As a result, undiluted extracts have beneficial effects on bacteria growth in diluted MH media. These results are in contrast to the ones of the control peptides, where samples in MH 1/5 showed stronger antimicrobial activity. In full MH medium,
B. subtilis
showed in all constructs a significant growth reduction compared to the growth control. However, this is also the case for constructs without included AMPs. Therefore, other factors have an influence on cell growth. It is possible, that buffers or residuals of any process step inhibit bacterial growth.
While figure 5 represents all undiluted extracts of all different constructs, in figure 6 and 7 all tested dilutions of the constructs c_blank, c_CHEN_1 and untransfected leaves can be found. Since CHEN showed stronger activity in the control peptides, we wanted to present this construct as a representative dilution series. Similar to the overview (fig. 5), constructs with CHEN showed no effect or an increase in cell growth. Interestingly, the untransfected leaves show significant reduction in cell growth of
B. subtilis
in MH 1/5. Since all extracts were processed in a similar way, it is unclear why extracts of untransfected leaves have antimicrobial activity while extracts with constructs do not show growth inhibition.

To sum up, we found that the AMPs CHEN and KR-12 induce a reduction in cell growth in both, E. coli and B. subtilis in diluted MH medium. However, we could not find conclusive results for our constructs. Further analysis needs to be done, in order to determine the antimicrobial activity of the different extracts.


References
1 Heatley N. G. (1944). A method for the assay of penicillin. The Biochemical journal, 38(1), 61–65. https://doi.org/10.1042/bj0380061
2 CLSI, Performance Standards for Antimicrobial Disk Susceptibility Tests, Approved Standard, 7th ed., CLSI document M02-A11. Clinical and Laboratory Standards Institute, 950 West Valley Road, Suite 2500, Wayne, Pennsylvania 19087, USA, 2012.
3 Balouiri, M., Sadiki, M., & Ibnsouda, S. K. (2016). Methods for in vitro evaluating antimicrobial activity: A review. Journal of Pharmaceutical Analysis, 6(2), 71–79. https://doi.org/10.1016/j.jpha.2015.11.005
4 Dong, W., Dong, Z., Mao, X., Sun, Y., Li, F., & Shang, D. (2016). Structure-activity analysis and biological studies of chensinin-1b analogues. Acta Biomaterialia, 37, 59–68. https://doi.org/10.1016/j.actbio.2016.04.003
5 Gunasekera, S., Muhammad, T., Strömstedt, A. A., Rosengren, K. J., & Göransson, U. (2020). Backbone Cyclization and Dimerization of LL-37-Derived Peptides Enhance Antimicrobial Activity and Proteolytic Stability. Frontiers in Microbiology, 11, 168. https://doi.org/10.3389/fmicb.2020.00168
6 Wiegand, Irith; Hilpert, Kai; Hancock, Robert E. W. (2008): Agar and broth dilution methods to determine the minimal inhibitory concentration (MIC) of antimicrobial substances. In Nature protocols 3 (2), pp. 163–175. DOI: 10.1038/nprot.2007.521.
7 Koehbach, Johannes; Gani, Jurnorain; Hilpert, Kai; Craik, David J. (2021): Comparison of a Short Linear Antimicrobial Peptide with Its Disulfide-Cyclized and Cyclotide-Grafted Variants against Clinically Relevant Pathogens. In Microorganisms 9 (6), p. 1249. DOI: 10.3390/microorganisms9061249.
Model Results
Accomplishments
- We found hundreds of new potential cyclotides via genome mining.
- We predicted the structures of our constructs.
- During our partnership with iGEM team IISER Kolkata, we simulated the membrane interaction of our constructs and several AMPs.
- We screened our constructs and several AMPs for their ability to bind to phospholipids.
Further Information
To view the results for our Hidden Markov Model Search, Structure Prediction, Molecular Dynamics simulations, and Molecular Docking, please visit Model .
To get an idea on how we ran our simulations, please refer to Experiments .
About Us
We are the iGEM Team Tuebingen, a group of motivated students who are working on creating a fast screening platform for stabilized peptides. We are aiming to provide a system that gives everyone the ability to stabilize peptides such as antimicrobial peptides to create better medical agents.


