Team:ASTWS-China/Engineering
Engineering Success
Welcome to iGEM 2021
|
Summary Table 1 Parts list
1. Plasmid Construction We designed our functional parts and cloning into pET-21a(+) backbone plasmid chemical synthesized by GenScript. As mentioned on our design page, strengthening the biofilm, PETase and MHETase expression is our main parts. To confirm the correctness of the plasmid, we used BamHI and EcoRI restriction enzymes to digest the plasmids. The gel electrophoresis results (Figure 1) showed that the OmpR234 (739 bp), PETase (1236bp) and MHETase (1821bp) genes were constructed as expected. In addition, we confirmed the results by sequencing the entire plasmid.
Figure 1 Nucleic acid gel electrophoresis results of OmpR234, PETase and MHETase.
2. Protein Expression Test SDS-PAGE electrophoresis was used to check the expression of OmpR234 protein, PETase proteins and MHETase proteins. As shown in Figure 2, compared to the blank control, the lane contained OmpR234 protein (27 kDa), PETase (30 kDa) and MHETase(42 kDa) protein indicated that these three proteins have been successfully expressed.
Figure 2 Protein SDS-PAGE electrophoresis results of OmpR234 , PETase and MHETase.
We evaluated the production of PETase using the constructed expression systems in E. coli BL21 line. To compare the induction effects by IPTG addition, we also performed time series analysis in our expression system. As shown in Figure 3, the expression of PETase in BL21 is time-dependent, and increased with the IPTG addition. When we analyze the PETase by means of Western blotting using the concentrated culture media, we observed clear bands with a molecular weight of approximately 30 kDa from IPTG induced BL21 cells (Figure 3). As the calculated molecular weight of PETase is 30.2 kDa, we suspected that these bands were the expressed PETase.
Figure 3 Production of PETase in E. coli through IPTG induction.
3 Independent Function Test 3.1 Expression of OmpR234 Increases Biofilm Formation In order to verify whether the insertion of PETase and MHETase genes affects the enhancement of biofilm by OmpR234, we used a dye called Congo Red, transferring them to microtiter plates and incubating with the glass cover for 3 days. If biofilms were present, they would absorb the dye and appear as red, so the strengthened biofilm production would show a higher concentration of dye.
Figure 4 Congo red assay stains biofilm after overexpressing of PETase-SC (BBa_K3609000) , OmpR234 (BBa_K3576000) and MHETase-ST (BBa_K3609002).
Under the condition that the total volume is the same, we add LB medium, PETase-SC+OmpR (1:1), OmpR234, MHETase-ST+OmpR (1:1) into the four microtiters. It indicates from figure 4, the higher the OmpR concentration, the redder the color displayed. Besides, it also demonstrated that the expression of PETase and MHETase has no major effect on the expression of OmpR234.
3.2 Enzyme Activity Test of PETase The enzyme activity of PETase was performed by p-NP assay which is a common way to quantify hydrolytic activity. We selected p-Nitrophenylbutyrate (p-NPB) as the substrate, which can be hydrolyzed by PETase to p-nitrophenol (p-NP), but cannot be hydrolyzed by MHETase (Figure 5). Thus, using p-NP assay, the enzyme activity of PETase and the impact of the addition of MHETase can be characterized by measuring the optimal optical density (OD) values at 405 nm. The plasmid used here is PETase-SpyCatcher (BBa_K3906000, Abbr. PETase-SC), OmpR234 (BBa_3576000, Abbr. OmpR), and MHETase-SpyTag (BBa_K3906002, Abbr. MHETase-ST).
Figure 5 The mechanism of p-NPB degradation
As shown in Figure 6, after overexpressing by PETase-SC and OmpR, the OD405 value of p-NP gradually increased at different substrate concentration levels with the extension of reaction time, which indicates that the degradation activity of the PETase. While overexpressing the PETase-SC + OmpR protein and PETase-SC + OmpR + MHETase-ST, respectively, it can be seen from Figure 7 that there is no significant difference between the two groups. In other words, it demonstrated that the addition of MHETase-ST would not affect the enzyme activity of PETase
Figure 6 OD405 of p-NPB hydrolysis by overexpressed PETase-SC and OmpR.
Figure 7 OD405 of p-NPB (0, 0.5, 1, 2, 4, 8 mM) hydrolysisby overexpressed PETsae-SC+OmpR and PETase-SC + OmpR + MHETase-ST respectively. 3.3 Enzyme Activity Test of MHETase We measured the concentration of TPA (MHET degradation product) by HPLC to analyze the degradation activity of MHETase. The result is shown in Figure 8, and the relationship between the concentration of product TPA and MHET is shown in Figure 9. By comparison, when the concentration of the substrate (MHET) is in the range of 0 - 2 mM, the results indicated that the co-expression of OmpR234 can improve the degradation activities of MHETase. However, when the concentration of the substrate (MHET) reached more than 2mM, the presence of OmpR weakened the MHETase degrading activity.
Figure 8 (A) HPLC results of MHETase-ST, (B) HPLC results of MHETase-ST and OmpR.
Figure 9 Comparison of MHETase enzyme activity with and without OmpR234.
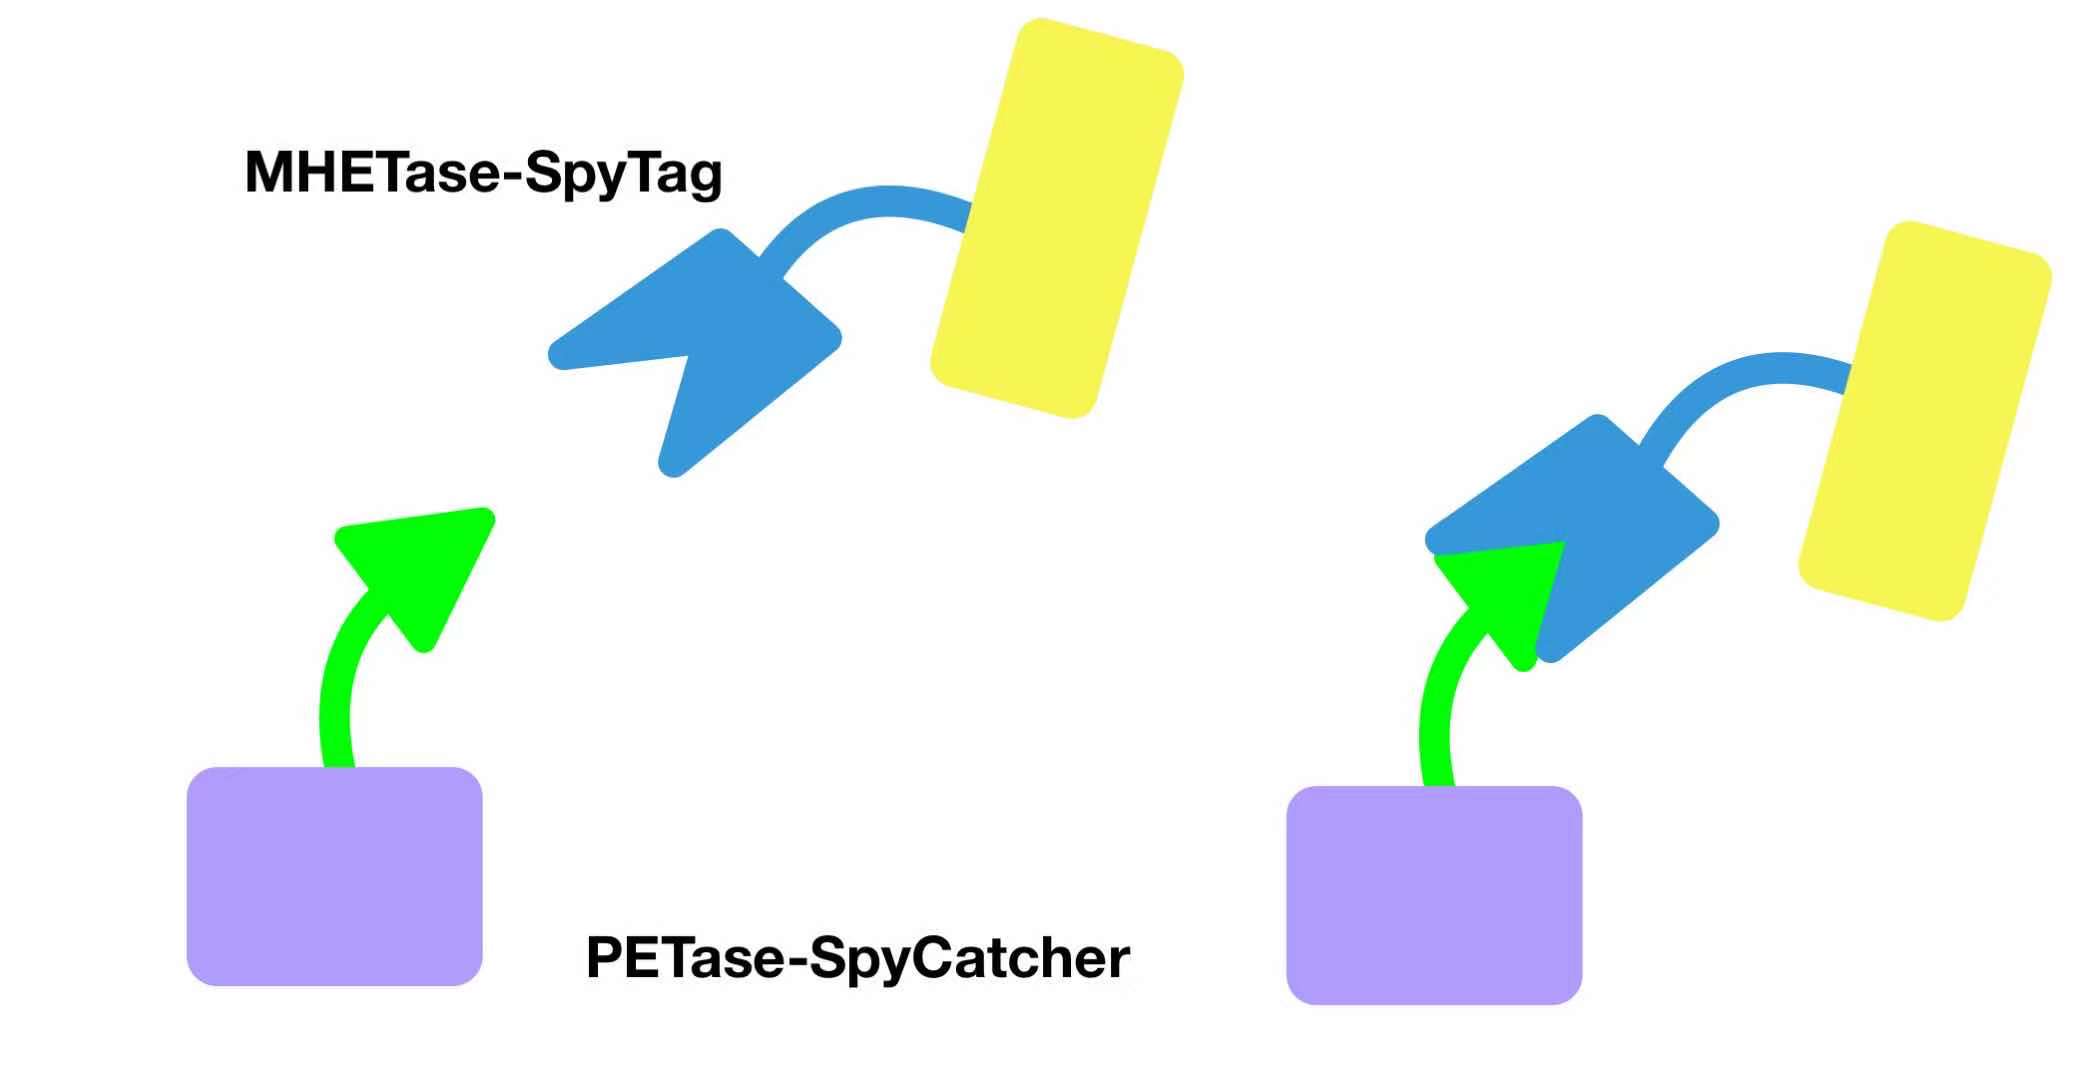
4. Dual-enzyme System 4.1 Strategy 1: SpyCatcher-SpyTag System To obtain the better degradation activity of the dual-enzyme system, we introduced the Spy system into our system, including SpyTag and SpyCatcher. These two components are recombined with MHETase and PETase, respectively. Figure 10 shows the schematic diagram of this Spy system. Through the C-terminal combination of SpyCatcher and SpyTag, PETase and MHETase are bound. Figure 11 shows the genetic circuit design of the SpyTag-SpyCatcher system. To visually observe whether the expression is successful, the GFP and mCherry fluorescent reporter genes are introduced into the two plasmids (Figure 11). If the two combine as expected, we can see the change in fluorescent color. When separated, one is displayed in red and the other is displayed in green, and when combined, the two are displayed in yellow.
Figure 10 Schematic diagram of SpyCatcher-SpyTag system.
Figure 11 Genetic circuit design of double fluorescence reporting system 4.2 Recognition Verification of Spy System In order to verify the recognition of MHETase-SpyTag and PETase-SpyCatcher, we transformed three sets of plasmids (PETase-eGFP-SC, MHETase-mCherry-ST, PETase-eGFP-SC + MHETase-mCherry-ST) into E. coli (BL21) and used fluorescence microscope to observe. The result is shown in Figure 12. As mentioned above, the E. coli transformed with MHETase-SpyTag is designed with mCherry reporter, which shows red in the photomicrograph (Figure 12-B), and the PETase-SpyCatcher designed with eGFP reporter shows green (Figure 12-A). It is worth mentioning that when the two are displayed together, the microscopic image appears yellow (Figure 12-C), which also qualitatively proves the effective combination of MHETase-SpyTag and PETase-SpyCatcher.
5. Real sample test In order to verify the degradation effect of our system on the real PET plastic, we used HPLC to test the degradation effect of our system using PET power. The result is listed in Table 2 and figure 13. The results indicated that OmpR strengthen biofilm can significantly improve the degradation efficiency of the dual enzyme (PETase-MHETase). And compared to the calculated rate of reaction from model, although the calculated value is not exactly the same as the experimental value, but basically in line with the tested reaction rate, which further verify the MM equation predict the measured data very well.
Figure 13 Comparation of calculated and tested TPA concentration.
6. Future Work According to the research, the thermal stability is another concern we need to consider. Normally, enzymes like PETase cannot survive in high-temperature surrounding and therefore not being able to degrade PET efficiently. In addition, it is necessary to develop a more effective combination strategy for PETase-MHETase, such as optimizing the concentration ratio of the two enzymes. In order to prevent the escape of engineered E. coli, it is also necessary to properly design suicide genes into our system.
|


iGEM ASTWS-China | SINCE 2017
Copyright 2021 iGEM ASTWS-China All rights reserved.
WeChat: ASTWS-ChinaHZ
