Team:Ecuador/Model
<!DOCTYPE html>


Description

Model

Experiments

Engineering

Safety

Implementation

Hardware
Model
We have designed a dynamical model to understand the inhibitory actions of Agrobactory to control any pathogen of interest, particularly Fusarium wilt caused by Foc TR4. The mathematical model is described for each module:
Module 1.- Production of dsRNA using a constitutive promoter, so Agrobactory's cells allocate their resources to produce dsRNA of the target gene.
Module 2.- Delivery and Release of dsRNA molecules via a cell lysis protein, that is only activated Quorum sensing mechanism triggers cell lysis
Module 3.-RNA silencing of the target gene Velvet and describing how dsRNA and RNA interference molecules can inhibit its gene expression, and eventually control Fusarium wilt.
Production of dsRNA
dsRNA expression
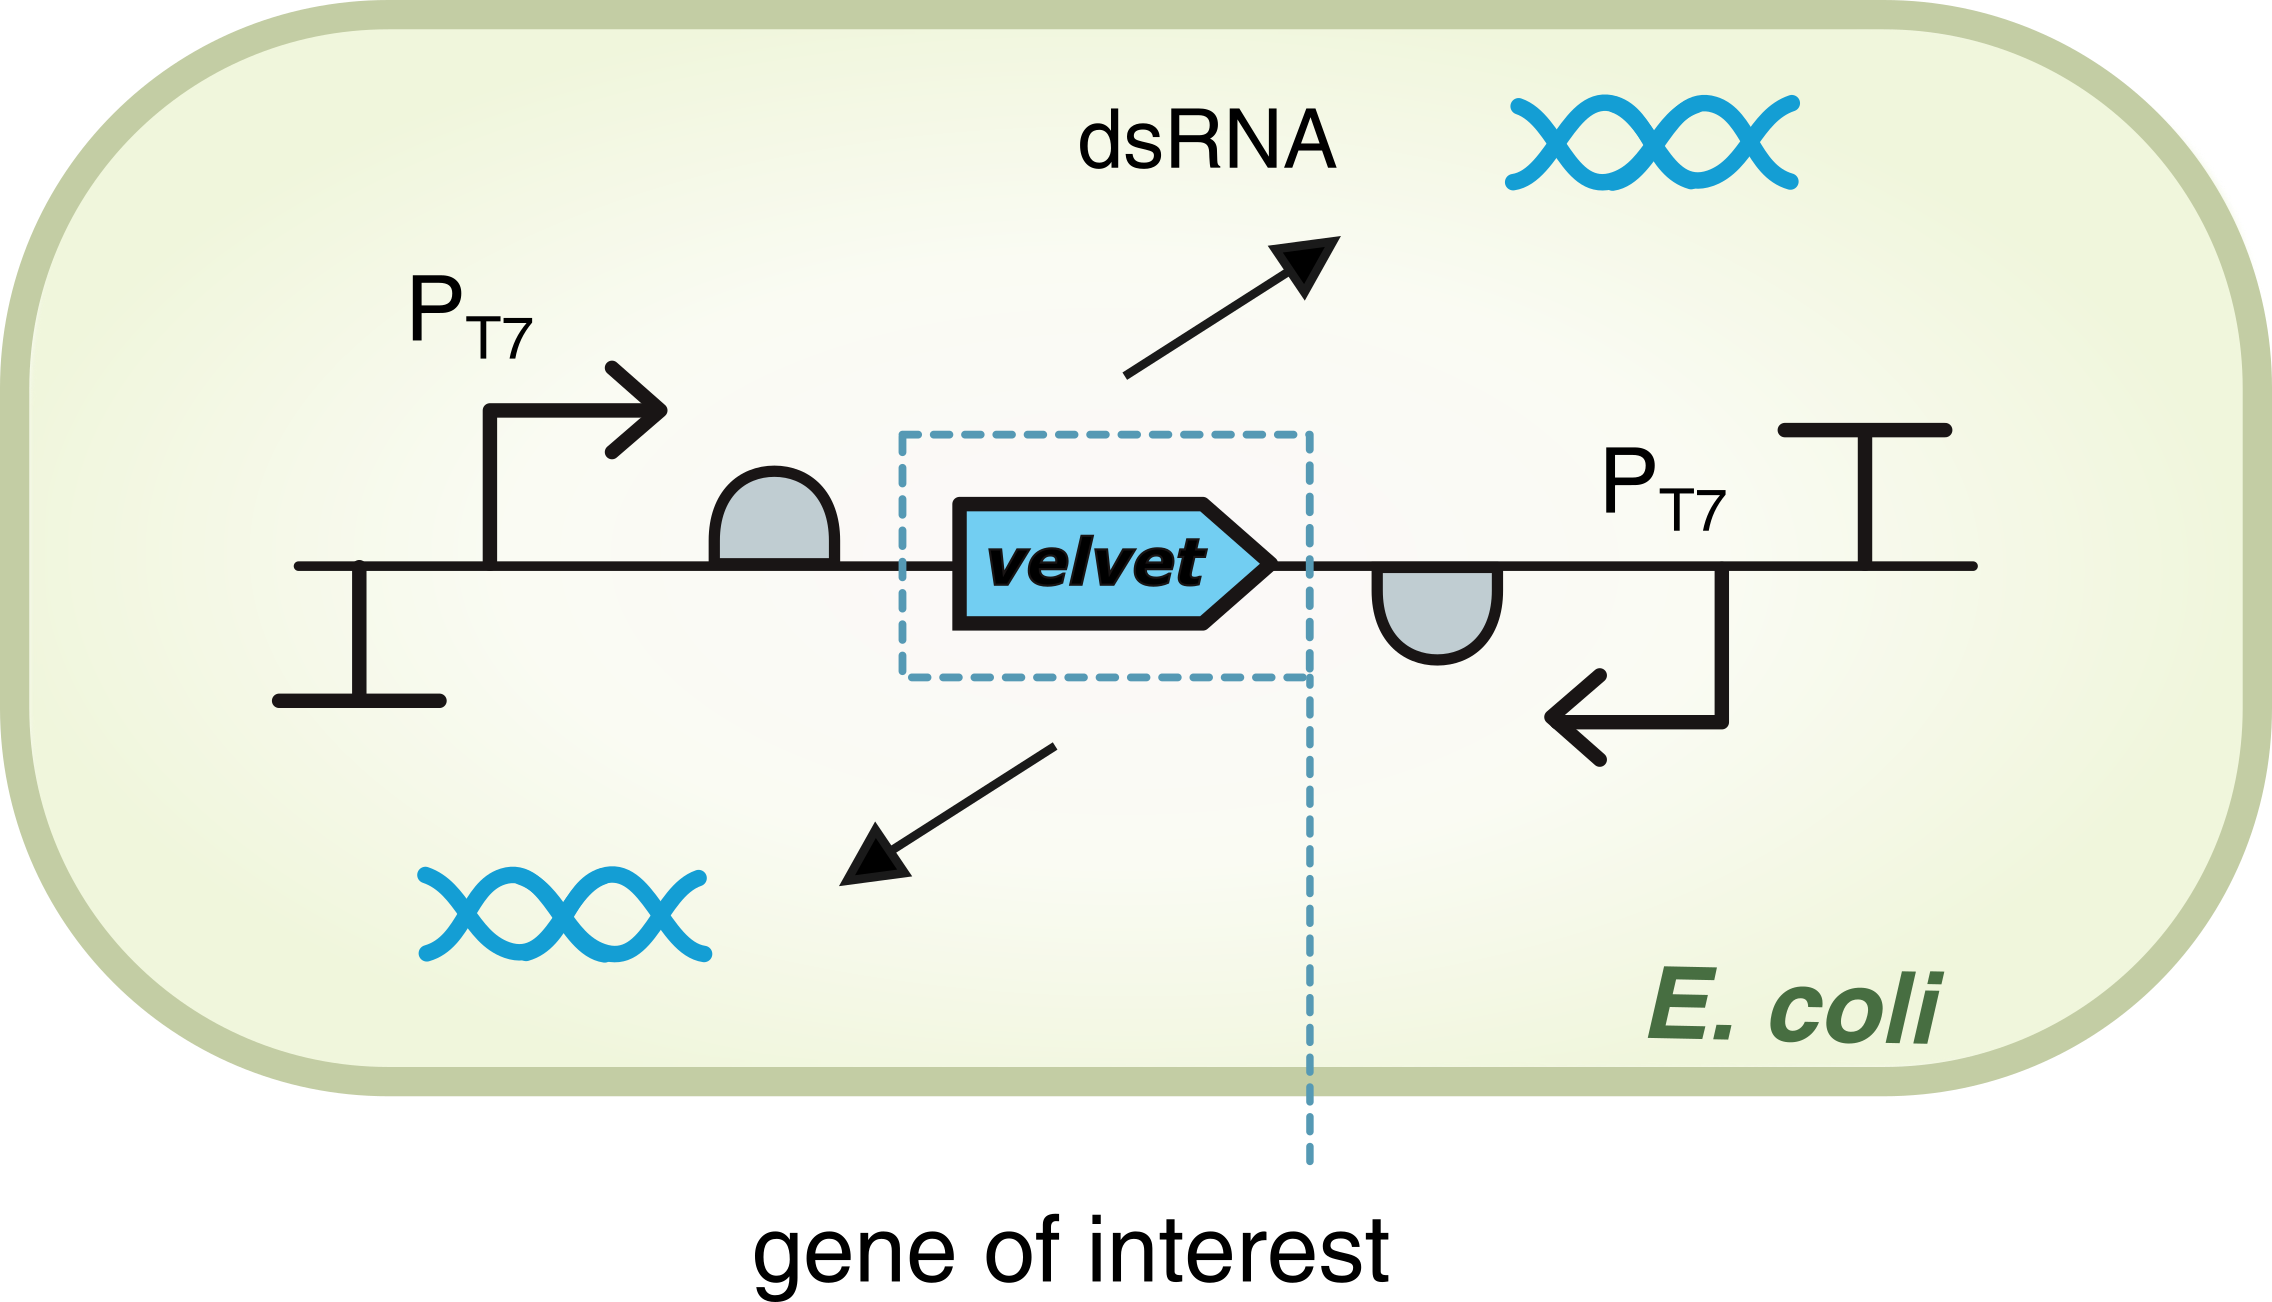
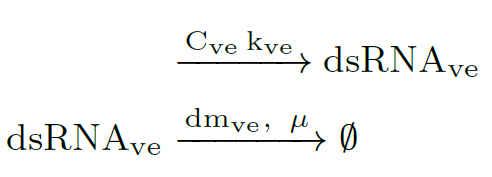
For the gene of interest Velvet, production of double-stranded RNA (dsRNA$_{ve}$) is driven by T7 polymerase, which in turn bounds to each promoter PT7. The promoters are located on both sides of the gene, positioned in opposite directions so that there is a two-way transcription. This allows the formation of a double-stranded structure for the RNA.
The first reaction describes the constituve transcription of dsRNA, and the second one represents the degradation of of this species, where (hereinafter): $C_x$ is the copy plasmid number for gene $x$, $k_x$ is the transcription rate of mRNA$_x$, $dm_x$ is the degradation rate of mRNA$_x$, and $\mu$ is the specific growth rate. All the parameters values are in Modeling and Parameters.
ODE model
This reactions rates can be expressed using the Law of Mass Action [3]. Therefore, constitutive expression of dsRNA is mathematically described by an ordinary differential equations (ODE) that captures the species dynamics. dsRNA of velvet gene is denoted as $V_e$:
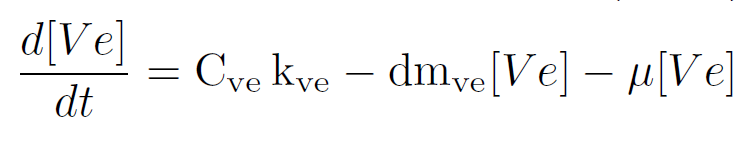
This equation is also one of the states of models in Module 2-Delivery and Release and Module 3-RNA silencing.
T7 Promoter and IPTG for dsRNA expression
To express recombinant genes cloned downstream of a T7 promoter, Isopropyl β-d-thiogalactoside (IPTG) is required to induce maximum expression with the T7 RNA polymerase. This RNA polymerase has the advantage that it is not consumed by cells [1]. IPTG is added to the medium and enters the bacteria by passive diffusion process. Upon entry, it interacts with the LacI dimer, which repress expression of the Lac operon. In turn, the interaction between IPTG and LacI de-represses the promoter, so operon transcription is activated. Therefore T7 RNA polymerase can regulate expression of dsRNA [2].

Figure T7 promoter and IPTG: Gene expression driven by T7 RNA polymerase. The Lac operon is used to express the polymerase in presence of IPTG. velvet gene is the target gene to silence in the genome of FOC TR1 and FOC TR4.
Biochemical reactions and ODE model
The following model was developed taking into account insights from the model of ZJU-China 2020 Team and in collaboration with the current IISER TVM team.
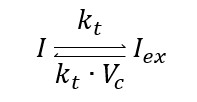
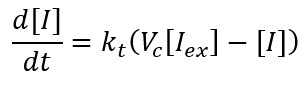
Extracellular/intracellular diffusion process of IPTG includes the extracellular IPTG is denoted as $I_ex$ and intracellular one as $I$. Hereinafter: $C_x$ is the copy plasmid number for gene $x$, $k_x$ is the transcription rate of mRNA$_x$, $dm_x$ is the degradation rate of mRNA$_x$, and $\mu$ is the specific growth rate. All the parameters values are in Modeling and Parameters IPTG. We use the same ratio from above to relate both volumes Vc=Vcell/Vext, so we have:
This biochemical reaction can be expressed as an ordinary differential equation (ODE) using the Law of mass action:
Constitutive expression of gene lac I include the translation stage of lacI mRNA:
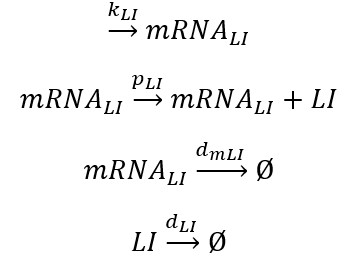
Now, we have an ODE set:
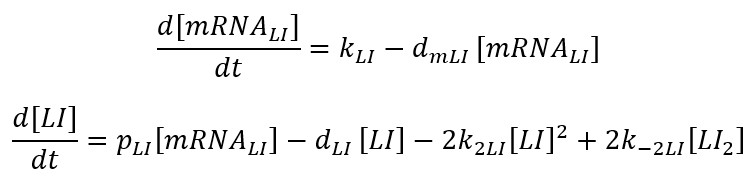
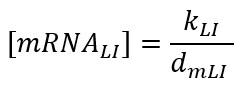
But if we consider transcription faster than translation, the mRNA level is at equilibrium:
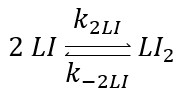
For Dimer LacI: , dimerization of LacI repressor is assumed to follow second-order kinetics.
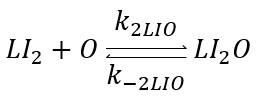
The total operator concentration $([O]_T)$ is constant and equal to the free operator concentration plus that bound to the repressor is $[O_T]=[O]+[LI_2O]$. Now we have the ODE as:

Repression of Dimer laci is:
So its ODE will be:

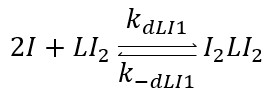
First derepression mechanism: The first derepression mechanism considers the binding of the inducer dimer LacI to a free repressor. Again, lacY transcription is faster than translation, so we can distinguish the effect of the de-repression mechanisms from the blurring and plateaus generated by the low mRNA concentrations.
We assume cooperative binding, with a Hill coefficient n=2. Therefore, the phenomenon can be modeled as one third-order reaction:
The ODE model is:

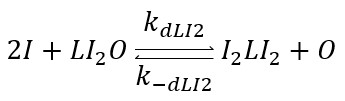
Second derepression mechanism is produced when IPTG binds to the repressor-operator complex, thereby the operator is released from the repressor:
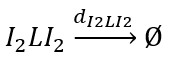
Degradation Repression $[LI_2]$ –inducer $[I_2]$ :The repressor does not degrade when is bound to the operator.
T7 RNA Polymerase Production
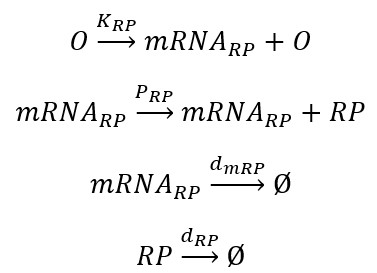
When lacI is present, the operon $(O)$ is free and starts transcribing the mRNA corresponding to T7 RNA Polymerase (mRNARP). This reaction is driven by the transcription rate KRP. The mRNARP is then translated allowing the formation of the T7 RNA Polymerase (RP). This reaction is driven by the translation rate PRP. The mRNARP and the RP are eventually degraded. These reactions are driven by the degradation rates dmRP and dRP.
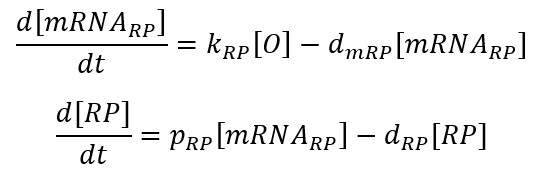
The corresponding ODE model is:
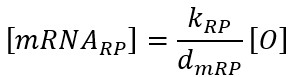
Considering $mRNA_{RP}$ at equilibrium:
Full ODE Model
As we said previously, the total operator concentration is ($[O]_T=[O] +[LI_2O]$), so the full ODE model:
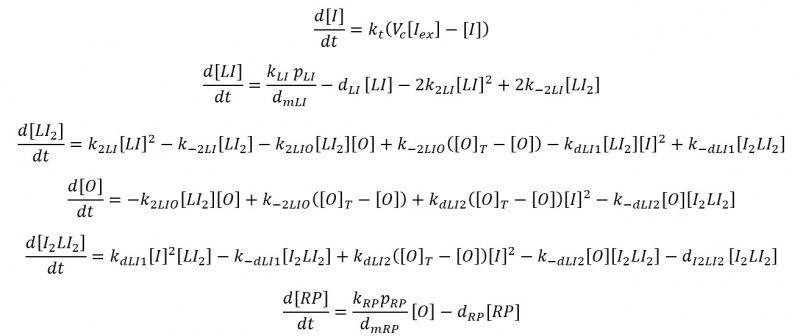
dsRNA Production with T7 ARN Polymerase
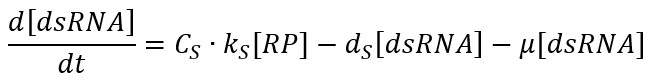
The RP binds to the promoters PT7 located at each side of the gene and starts the transcription of the gene, leading to the formation of the dsRNA and leaving free RP. This reaction is driven by the transcription rate kS. Then, dsRNA is eventually degraded, where dS is the degradation rate and $\mu$ is the specific growth rate due to the dilution effect:

The ODE model is:
The computational simulations, the model parameters and further details can be found in the Appendix Modeling and Parameters IPTG.
Appendix
Modeling and Parameters
Modeling and Parameters IPTG
References
[1] Delgado-Martín, J., & Velasco, L. (2021). An efficient dsRNA constitutive expression system in Escherichia coli. Applied Microbiology and Biotechnology, 105(16), 6381-6393.
[2] Stamatakis, M., & Mantzaris, N. V. (2009). Comparison of deterministic and stochastic models of the lac operon genetic network. Biophysical journal, 96(3), 887-906.
Delivery and Release
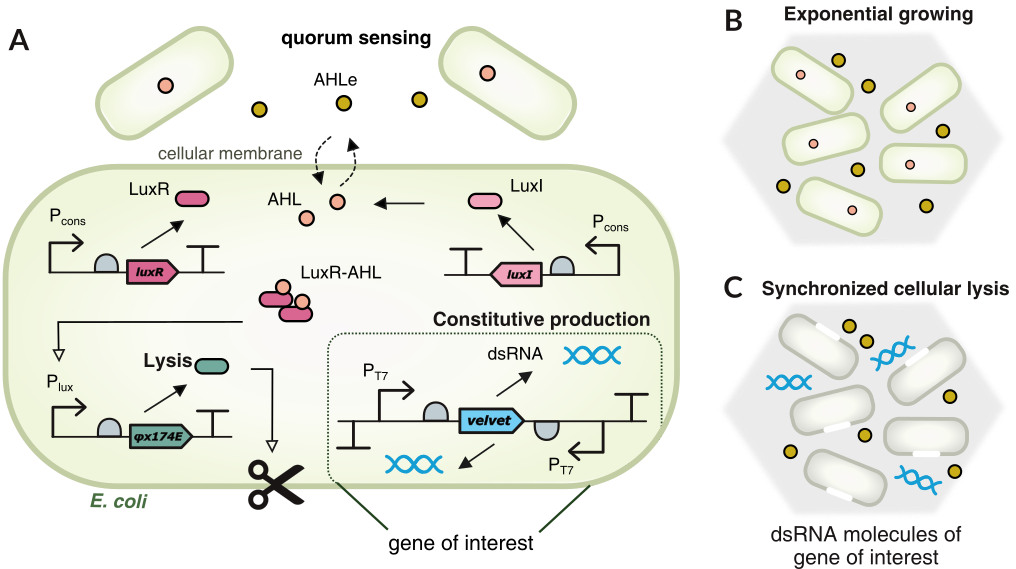
Figure: A,B.This module of Agrobactory produces dsRNA to silence the target gene velvet from FOC TR4 genome. When cells grow exponentially, AHL molecules act as communication signalS for quorum sensing. C. Once the concentration of lysis protein reach a threshold, cells dead and release the dsRNA molecules. Lysis protein acts as a switch killing ON/OFF based on its own concentration. Module 2 has an 'oscillatory behaviour' for delivering and releasing dsRNA.
Realeasing mechanism
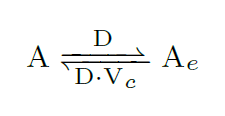
Quorum sensing is a cell-to-cell communication mechanism via 3OC6 homo-serine lactone (AHL) molecules that passively diffuse across the cell membrane (at a diffusion rate $D$ min$^{-1}$). Extracellular/intracellular AHL molecules denoted as $A_e$ and $A$ respectively, interact between them as in [4]. To relate both the culture medium volume and the cell volume, we used the ratio Vc=Vcell/Vmedium:
Nomenclature for all intracellular species: $C_x$ is the copy number of the plasmid, $k_x$ is the effective transcription rate (1$/$min), $p_x$ is the effective translation rate (1$/$min), $d_x$ is the degradation rate of that species (1$/$min), and $\mu$ is the dilution effect due to cell growth (1$/$min).
Constitutive expression of luxR gene (R):
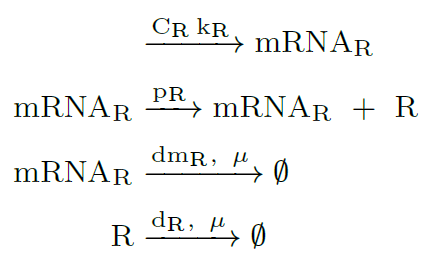
Constitutive expression of luxI gene (I):
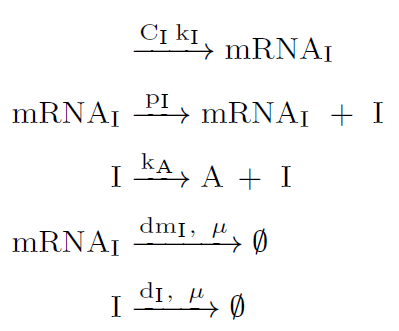
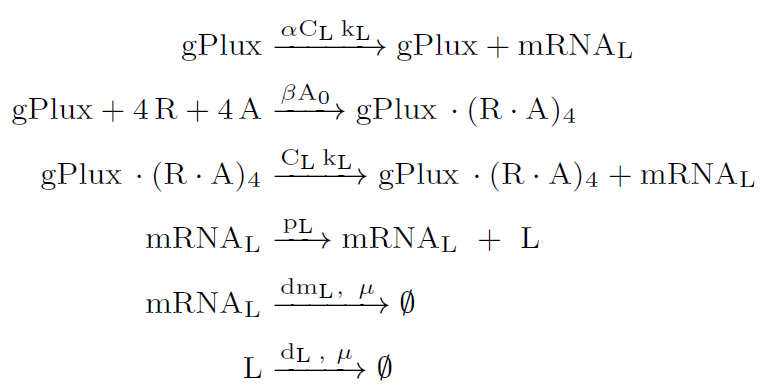
Lysis protein coded by gene $\varphi X174E$ is activated by the transcription factor LuxR-AHL or $(R \cdot A)_4$. When lysis protein reach the threshold $A_0$, the cells in the population dead whereas dsRNA molecules are released to the banana roots.
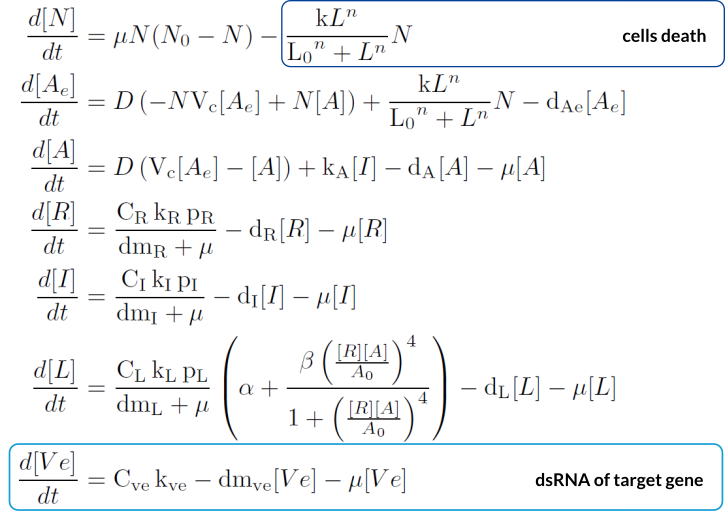
ODE model
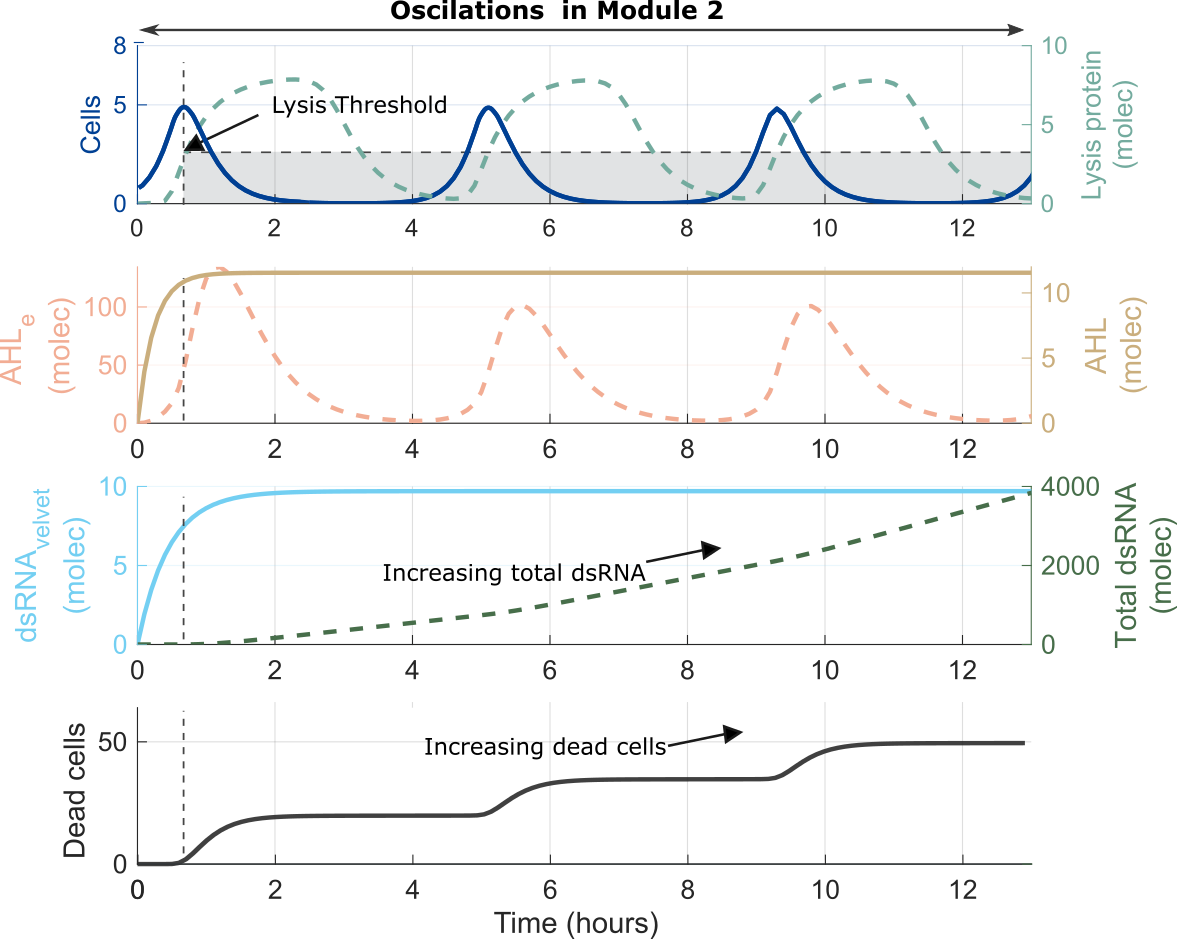
Once the intracellular AHL and LuxR protein thresholds are reached, the intracellular production of the promoter $P_{lux}$ driven gene $\varphi x174E$ is brought to the ON state. This is due to the positive feedback provided by the activation term for the $P_{lux}$ promoter. Increasing the lysis protein $\varphi x174E$ leads to a rapid reduction of cell number via the killing term for the N cells. It was modeled as a Hill function to switch killing ON/OFF based on the concentration of lysis protein. Once intracellular AHL and lysis protein levels decay, $P_{lux}$ and the N cells turn back to their OFF stable states, allowing cell number to rise and repeat the process.
This ODE model was also used to characterized some of the biological parts of this Module 2 in Engineering. All the parameters values are in Modeling and Parameters.
Assumptions
- As in Module 1-Production of dsRNA, we used the Law of Mass Action to obtain an ODE model that captures the dynamics of this Module 2.
- We have considered the same assumptions as in [5,6] for quorum sensing mechanism and cell death. The number of cells $N$ and the 3OC6-HSL (homo-serine lactone) $A_e$ are both extracellular species. The remaining species are intracellular ones, and the dsRNA of gene \emph{velvet} is denoted as $Ve$.
- Transcription is considered faster than translation, so the mRNA species for genes luxR, luxI, and $\varphi x 174E$ are in equilibrium (steady$-$state).
- The diffusion coefficient was calculated as $\mathrm{D = S P_n/V_{cell}}$ min$^{-1}$. It depends on the cell surface area $\mathrm{S=4\pi r^2}$ (spherical area with r=10 $\mu$m), the membrane permeability $\mathrm{P_n}= 3E-3 \,\mu$m $\cdot$ min$^{-1}$ and the typical \emph{E. coli.} volume $\mathrm{V_{cell}}=1.1E-9 \, \mu$ L.
Computational simulations
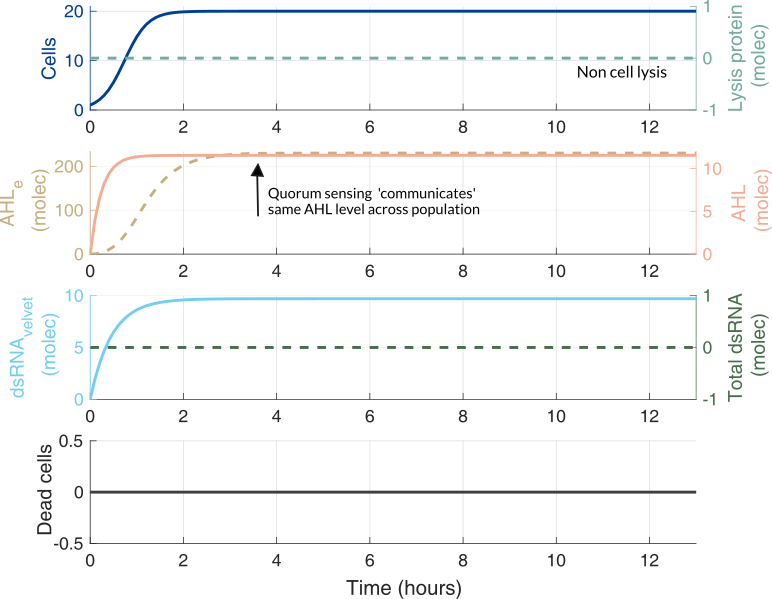
Using the previously described parameters and initial conditions according to the experiments in the lab, we performed computational simulations. Below it is shown how cells die as the lysis protein increases.
No lysis protein production
Lysis protein production
Using measurements to understand and improve our model
Characterization of pLux promoter
Once the model is able to give us good computational simulation results, i.e. it shows oscillations, it is time to go back to the laboratory and use the available measurements to understand our model better. For this we took our new part BBa K3893028, which includes a GFP under the control of the pLux promoter, and the constitutive expression of LuxR protein. Then, we obtained the temporal behavior of the device at different AHL inducer concentrations added in the lab. This experiments were done following a standard experimental procedure and the Measurement/Engineering Committee recommendations for calibration for Particles and MEFL. Check our page contribution, or our modeling report for more detailes.
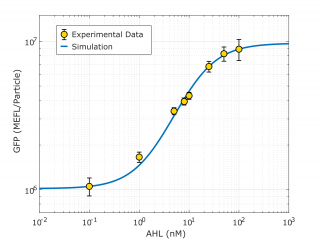
Using this characterization information we obtained from this smaller DBTL, we could characterize the pLux promoter (in the context of the transcriptional units data was taken, which is the same as the context of our oscillator).
| Parameter | Value |
| Effective translation rate 𝛼 | 𝛼 = 8.11e8 molec min-1 |
| Effective dissociation constant Kd | Kd = 15.34 nM |
| Hill coefficient | n = 0.958 |
| Basal expression | 𝛽 = 0.1049 |
| Growth (Dilution) rate μ | μ = 0.0115 min-1 |
Improving the model
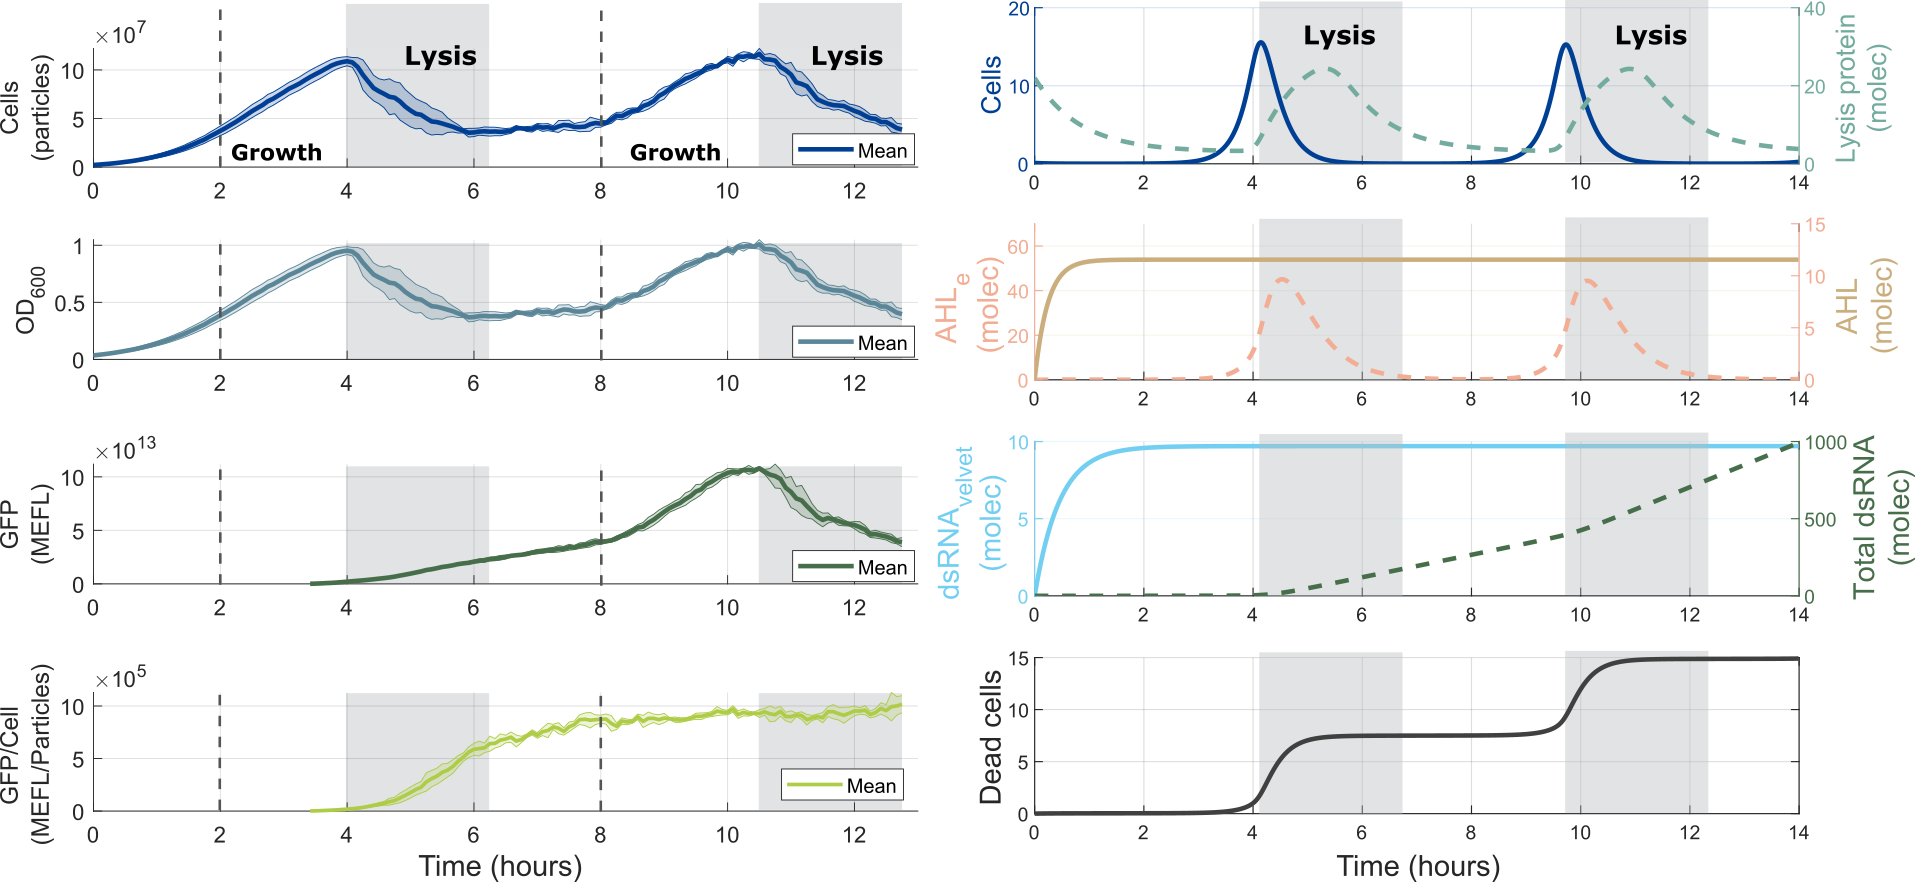
The characterization of the pLux promoter, and in particular the parameters that are from the promoter itself: Effective dissociation constant Kd, Hill coefficient, and Basal expression were feedback to model. Then, new computational simulations were performed.
The results are striking. By comparing the in silico vs. in vivo results, we can see that our model not only captures the temporal dynamics of the oscillator but also recapitulates with the Total dsRNA being similar to the Total GFP in the experimental data.
An interesting point is that we did not fit the oscillator model with data from the experiment from part BBa_K3893030, but we incorporated the characterization made of one of the components of the system, and still, we got good agreement between the model of Module 2 and its corresponding experimental data. This, speaks itself about the power of modeling and the DBTL cycle in Synthetic Biology.
Finally, our newly adjusted ODE model can be used to redesign our device, by predicting outcomes for different conditions of components, and also it can be used in an optimization process to improve other aspects of our devices we need to improve. Now, we have a starting point for optimization that can be done in silico, instead of building a new set of genetic circuits to see which one performs better than the original.
Appendix
Modeling and ParametersReferences
[4] Yadira Boada, Alejandro Vignoni, and Jesús Picó. Engineered control of genetic variability reveals interplay among quorum sensing, feedback regulation, and biochemical noise. ACS synthetic biology, 6(10):1903–1912, 2017.
[5] Yadira Boada, Alejandro Vignoni, and Jesús Picó. Multiobjective identification of a feedback synthetic gene circuit. IEEE Transactions on Control Systems Technology, 28(1):208–223, 2019.
[6] Momar Din, Tal Danino, Arthur Prindle, Matt Skalak, Jangir Selimkhanov, Kaitlin Allen, Ellixis Julio, Eta Atolia, Lev S Tsimring, Sangeeta N Bhatia, et al. Synchronized cycles of bacterial lysis for in vivo delivery. Nature, 536(7614):81–85, 2016.
RNA Silencing
Silencing mechanism
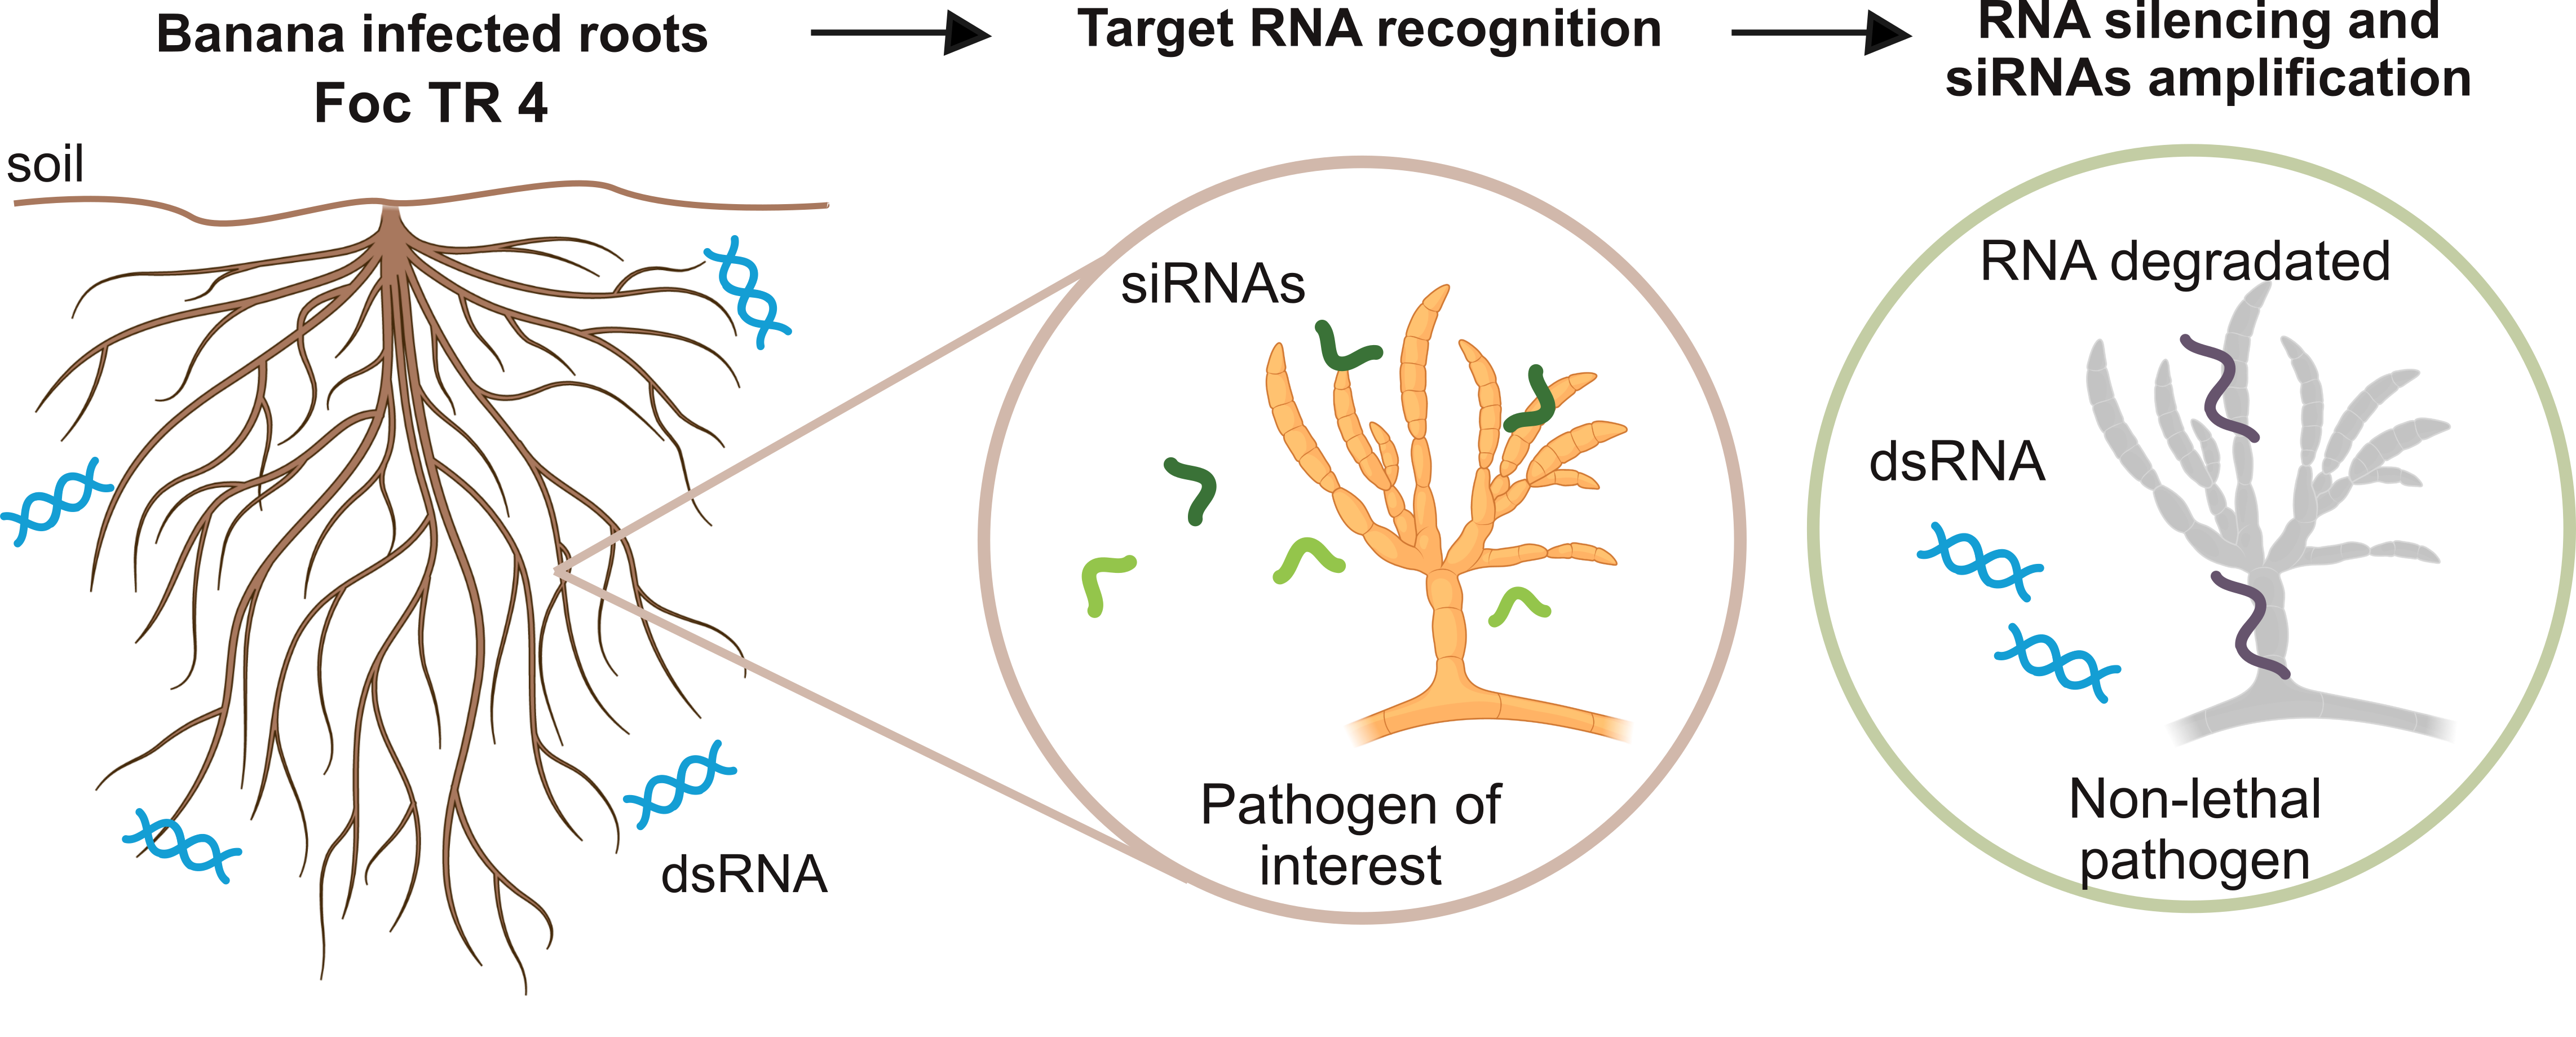
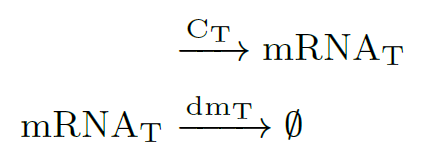
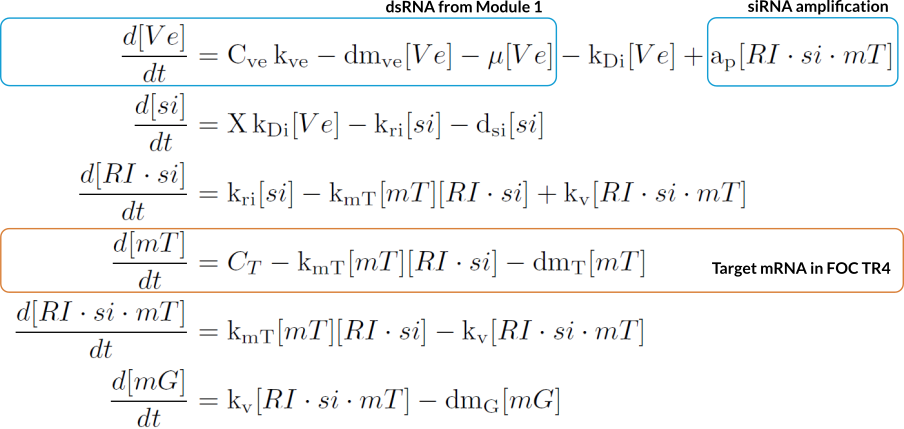
After Module 2 releases the key molecules of Agrobactory, that is, the double-stranded RNA molecules dsRNA over banana roots, the silencing of the target gene velvet can begin. First, considering constitutive transcription of target mRNA$_T$ in the pathogen Foc TR1, we have:
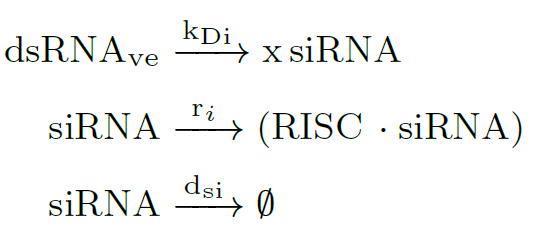
Then, Dicer protein processes the dsRNA precursors into $X$ short fragments (20–30 nucleotides) [7, 8]. All gene-regulatory phenomena involving siRNAs are thought to require one or more Argonaute proteins (Ago) [7]. These proteins are one of the central components of the RNA-induced silencing complex (RISC). siRNAs molecules rapidly enter into a RISC assembly (near the Ago site), so the RNA silencing mechanism is triggered:
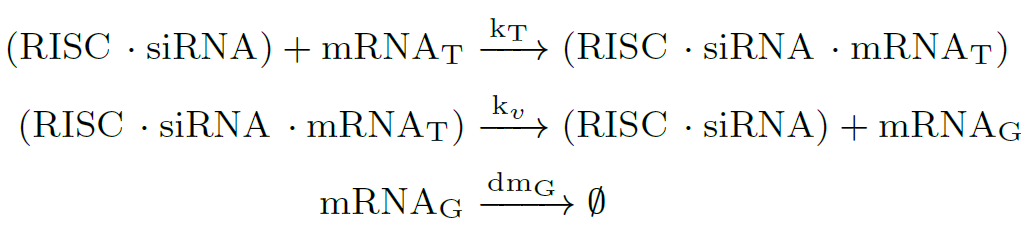
Target RNAs are recognized by base pairing, and then the $(RISC \cdot siRNA)$ complex cleaves RNA target to finally silence it. RNA silencing ensues at the $k_v$ rate, and inside the eukaryotic cell accumulates RNA garbage (mRNA$_G$). After that, the target RNA is released:
In many species as fungus, the amount of siRNA molecules can be amplified by the action of RNA-dependent RNA polymerase (RRP) enzymes [8], strengthening and perpetuating the silencing response. Here, dsRNA induces synthesis of secondary siRNAs, only if the target mRNA is present:

ODE model
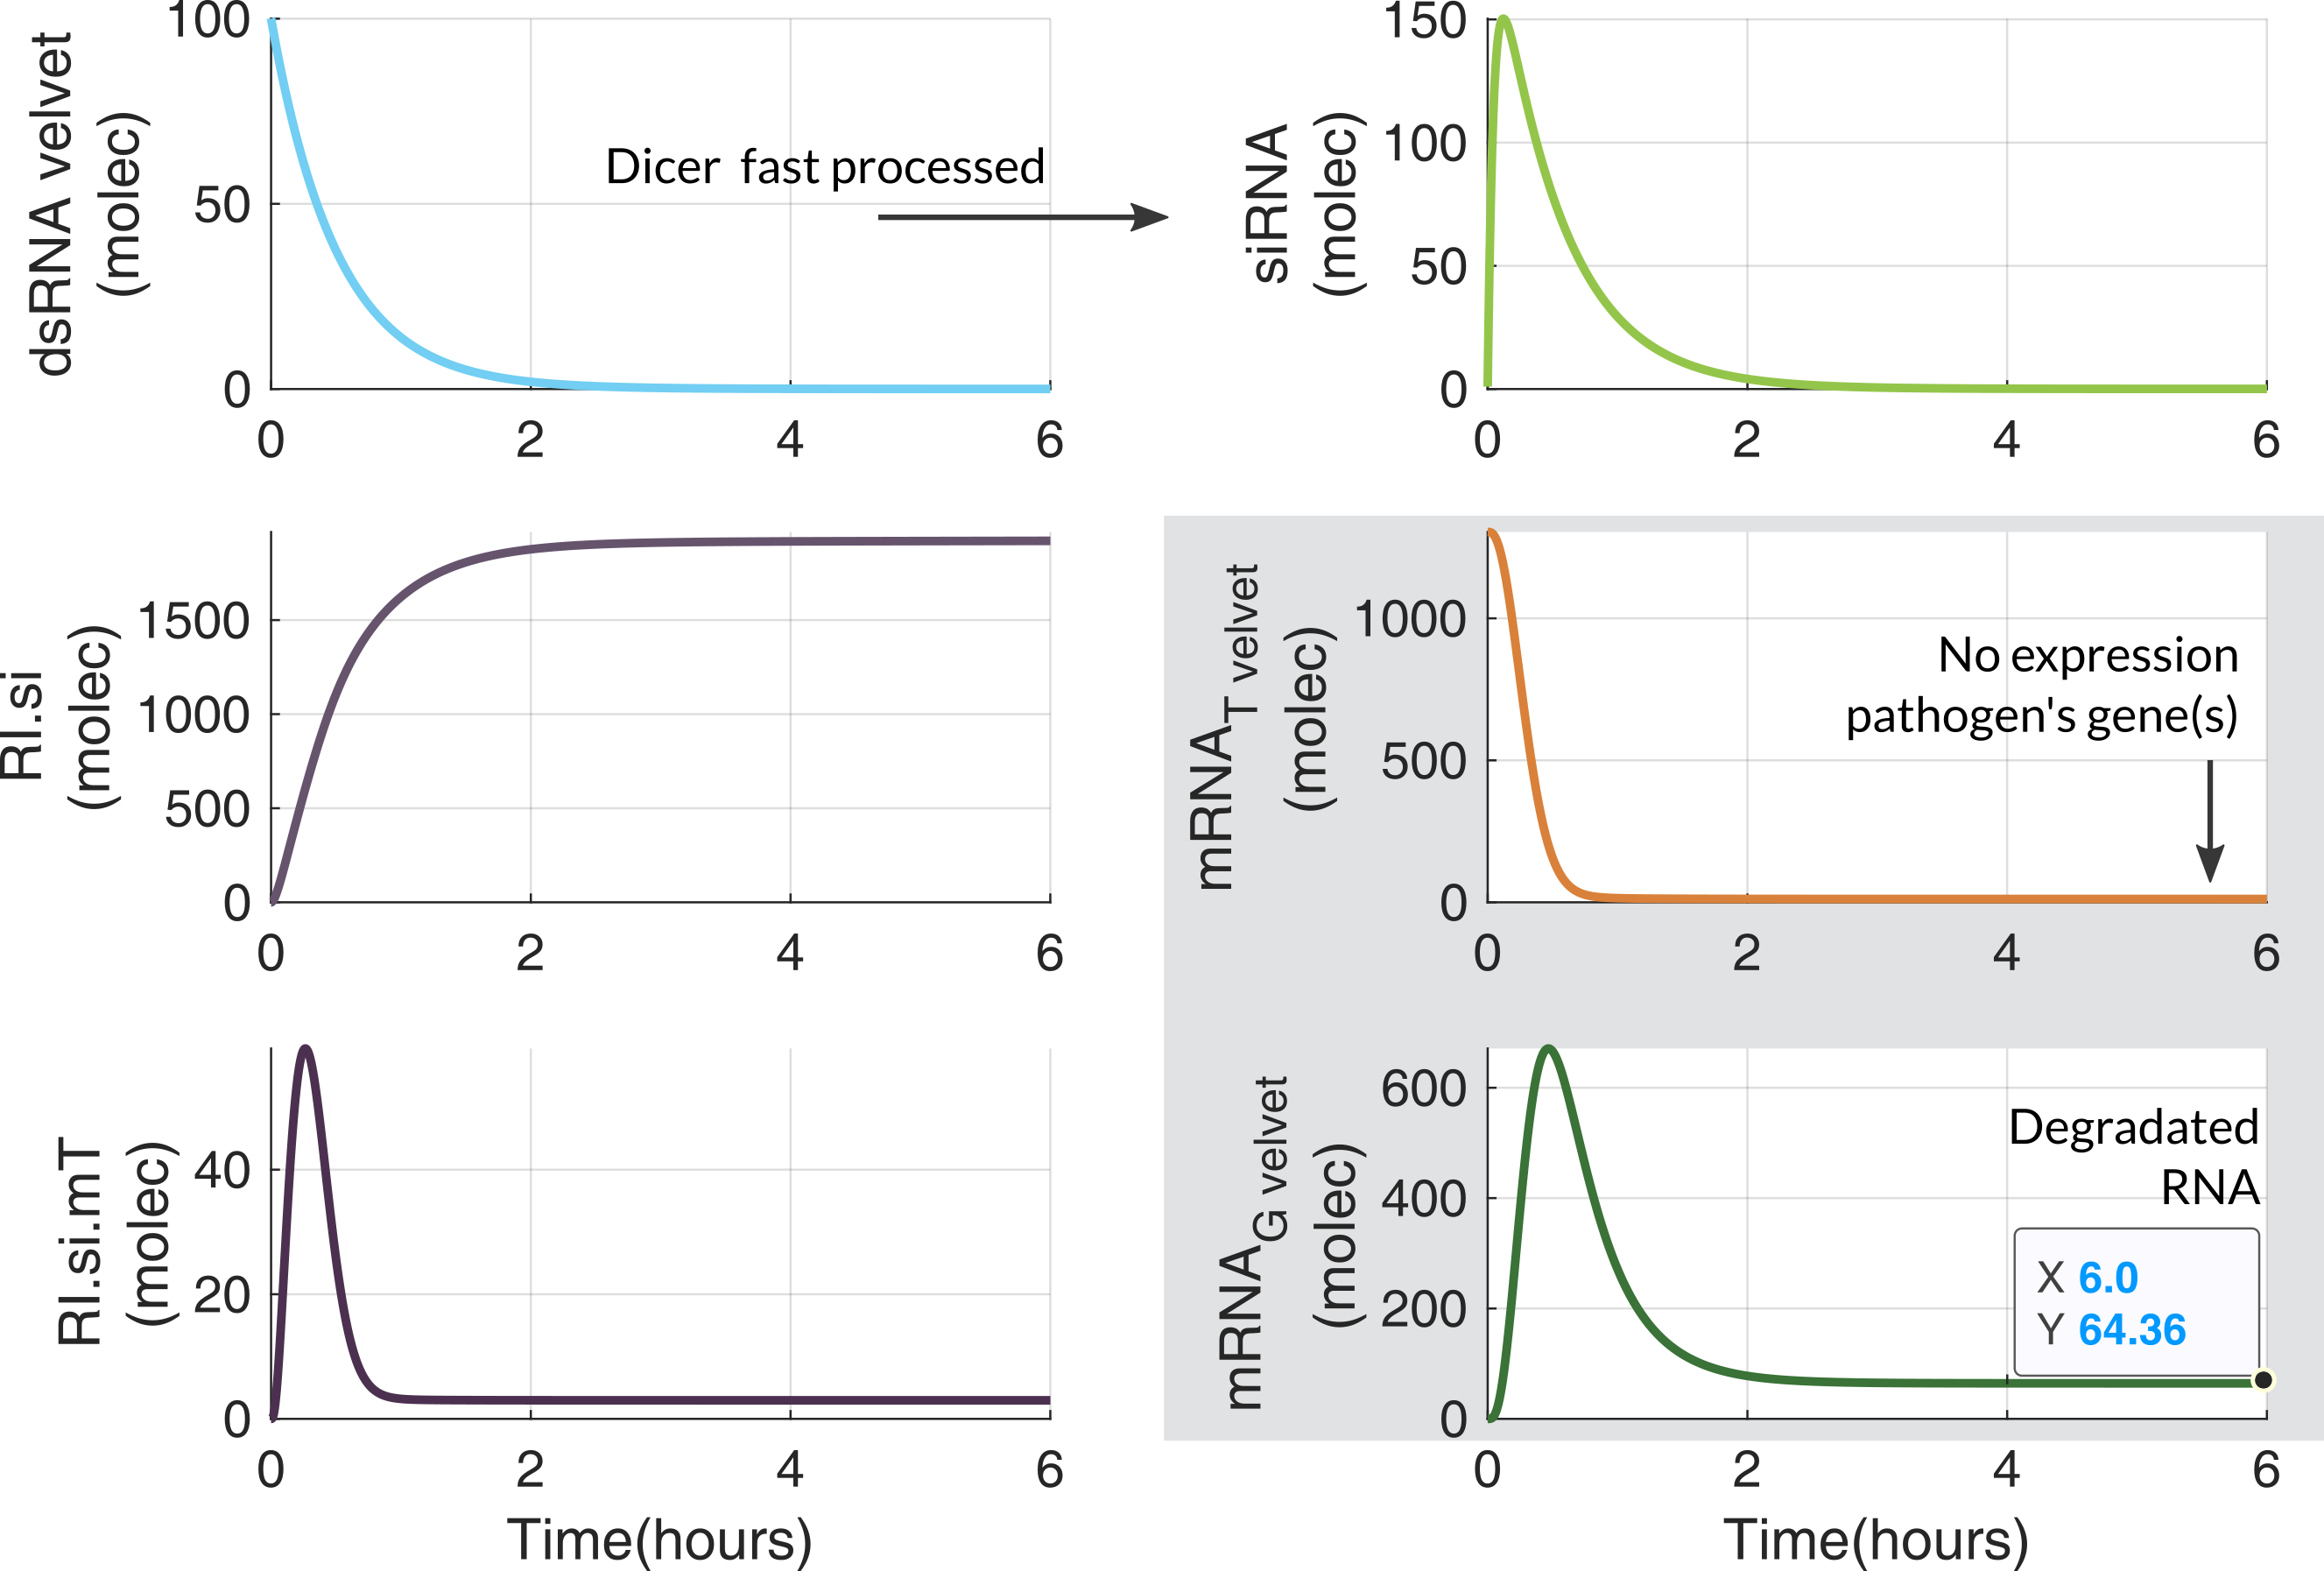
The ODE model was designed for an eukaryotic cell like FOC TR1/TR4. It has 1 state for the dsRNA coming from Module 2, and 5 states describing RNA silencing. All the parameters values are in Modeling and Parameters.Assumptions
- Dicer protein, RISC complexes, and RNA-dependent RNA polymerase enzymes concentrations are assumed to be large enough, so they fluctuations over time can be neglected.
- Conversion of dsRNAs into $X$ siRNAs (approximately 21–23 nucleotides) was considered as an irreversible and fast reaction.
- $X$ is a number of siRNAs that depends on the length of the target RNA.
- Only one siRNA molecule is enough to cleave the target RNA, and subsequently starting the RNA silencing mechanism.
- The binding between siRNAs and the RISC complex was considered 10 times faster than siRNAs processed by Dicer.
- mRNA$_T$ is the target RNA coming from Foc TR4, and mRNA$_G$ is the degraded RNA.
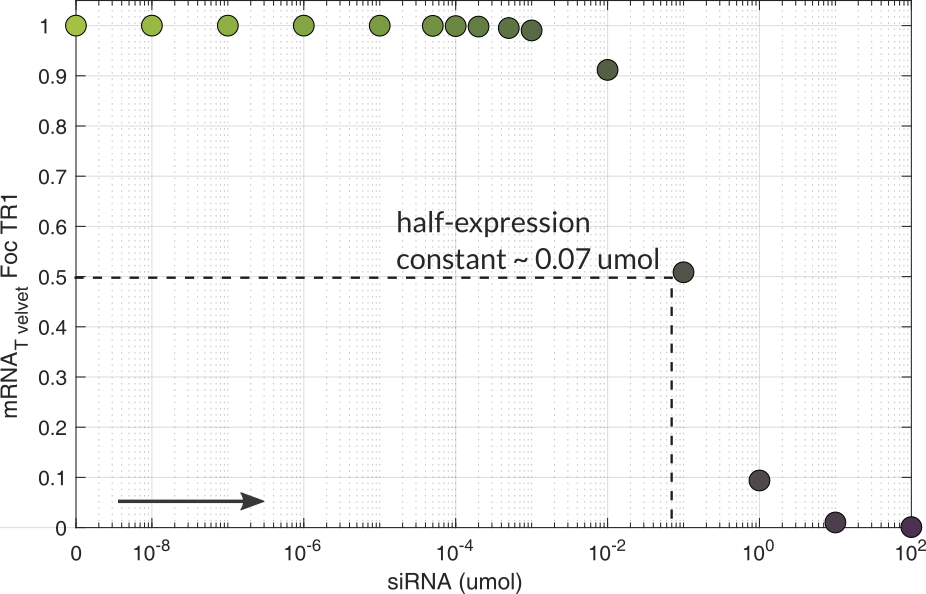
Computational simulations
Dose response
This response helped us to approximate the siRNA concentration needed to silence the RNA target. This dosification is useful to quantify siRNA precursors and the dsRNA level that Agrobactory has to produce.
Appendix
Modeling and ParametersReferences
[7] Huimin Meng, Zhangxun Wang, Yulong Wang, Hong Zhu, and Bo Huang. Dicer and argonaute genes involved in rna interference in the entomopathogenic fungus metarhizium robertsii. Applied and environmental microbiology, 83(7):e03230–16, 2017.
[8] Richard W Carthew and Erik J Sontheimer. Origins and mechanisms of mirnas and sirnas. Cell, 136(4):642–655, 2009.